Yilu Li, Haining Wang (2025). Effects of Mouse Back Shape on Grip Comfort: An Ergonomic Study. In: Ergonomics In Design and Kansai Engineering. AHFE Open Access, vol. 170, pp. 12–22. https://doi.org/10.54941/ahfe1006163
The shape of a computer mouse’s back, specifically its curvature or arch height, is a key factor influencing user comfort during prolonged use. However, this aspect of mouse design has received relatively little attention in ergonomic research. This study examines the impact of shifting the highest point of the mouse back on grip comfort and muscle activation. Five mouse models were evaluated, including a baseline model and four modified designs with varying peak positions (higher, lower, forward, and backward). Subjective comfort was assessed using Likert scale ratings, and muscle activity was measured using electromyography (iEMG) during controlled clicking tasks. One-way ANOVA was used to analyze subjective ratings, while the Kruskal-Wallis H test was employed for the iEMG data. Results revealed significant differences in subjective comfort, with the baseline and forward-shifted models rated higher. However, no significant differences in muscle activation were observed. These findings suggest that peak position influences perceived comfort but does not significantly affect short-term muscle activity. The results provide valuable insights for optimizing ergonomic mouse design.
The increasing reliance on computer workstations has led to heightened attention on the ergonomic design of computer mice, due to its influence on user comfort, productivity, and musculoskeletal health (Dennerlein and Johnson, 2006; Odell and Johnson, 2015). Prolonged and repetitive mouse use has been associated with musculoskeletal disorders (MSDs), particularly affecting the wrist and forearm muscles, thereby contributing to discomfort and long-term health concerns (Fagarasanu and Kumar, 2003). Consequently, ergonomic studies have focused on various design factors, including mouse shape, weight, angle, and grip posture, to minimize muscle strain and improve user comfort (Gustafsson and Hagberg, 2003; Lin et al., 2015).
One key aspect of mouse design that remains underexplored is the position of the highest point of the mouse back. Previous research has investigated the influence of mouse weight (Chen et al., 2012) and grip posture (Keir et al., 1999) on muscle activity and wrist motion, revealing that ergonomic adjustments can significantly affect muscle load and user performance. Similarly, studies comparing mouse geometries have highlighted their role in wrist posture, carpal tunnel pressure, and user preference (Hasan, 2017; Karlqvist et al., 1999; Lourenço et al., 2022). However, few studies have systematically examined how shifting the highest point of the mouse’s back affects grip comfort and muscle activity.
Effects of Mouse Back Shape on Grip Comfort: An Ergonomic Study 13
To fill this gap, this study examines how the peak positions of the mouse back influence grip comfort and forearm muscle activity. This study comprehensively analyzes the relationship between mouse geometry and user experience by systematically evaluating five mouse prototypes with different peak positions. Objective assessments include integrated electromyography (iEMG) measurements to quantify muscle activation, while subjective evaluations involve user-reported comfort ratings based on grip fit, muscle relaxation, and overall comfort. The findings contribute to the ergonomic optimization of mouse design by identifying structural modifications that reduce muscle strain and enhance user comfort.
METHOD
Subjects Ten experienced computer mouse users, five males and five females, were recruited for this study. All participants self-reported using a computer for more than 10 hours per week. The average age of the participants was 23 years (ranging from 18 to 26 years), and all participants were right- handed. Before the experiment, no participants reported any discomfort or injuries related to mouse use, ensuring that individual health issues did not confound the data collection. Informed consent was obtained from all participants, and ethical guidelines were followed in the study procedures.
Hand measurements were conducted for all participants to ensure that the sample represented a diverse range of hand sizes, following the methods described by Odell and Johnson (2015). Hand length was measured from the distal wrist crease to the tip of the middle finger, while handbreadth was measured from the medial side of the palm just below the little finger to the lateral side of the palm just below the index finger. The results indicated that the mean hand length was 179.0 mm (range: 162.6 to 186.4 mm), and the mean handbreadth was 78.2 mm (range: 69.6 to 88.0 mm). The anthropometric characteristics of subjects is recorded in Table 1.
Table 1: Anthropometric characteristics.
Table available in the original PDF paper.
Variable Mean SD Minimum Maximum Age(years) 23.0 2.3 18.0 26.0 Hand length(mm) 179.0 7.2 162.6 186.4 hand breadth(mm) 78.2 4.9 69.6 88.0
Independent Variables The computer mouse prototypes used in this experiment were developed based on a benchmark model, the Logitech GPW3. The baseline model, obtained through 3D scanning of a standard Logitech GPW3 mouse, serves as the control. Four additional variants were generated by systematically altering only the position of the peak on the mouse back, while keeping all other design factors (e.g., weight, overall dimensions, and materials) unchanged. According to the pre experiment screening, the design variables are determined as follow:
14 Li and Wang
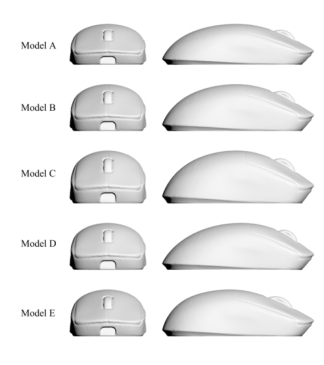
Lower Peak Model: The highest point is decreased by 5 mm. Higher Peak Model: The highest point is increased by 5 mm. Forward Peak Model: The highest point is shifted 5 mm forward. Backward Peak Model: The highest point is shifted 5 mm backward. All prototypes were fabricated using 3D printing technology, guaranteeing high precision and consistency across the models. Figure 1 shows the front and side views of the tested mouse models.
Figure 1: Front and side views of the tested mouse models. Model B (the baseline mouse) and the four conceptual mouse designs - models A, C, D, and E.
Dependent Variables Grip comfort in this study was evaluated from both subjective and objective perspectives. Subjective comfort was measured using a 7-point Likert scale, which measured participants’ perceived muscle relaxation, grip fit, and overall comfort during mouse use. Objectively, forearm muscle activity was quantified using electromyography (EMG). The integrated EMG (iEMG) value, calculated from the recorded EMG signals, served as an index of the total muscular load during operation.
For objective assessment, EMG measurements focused on the key muscles engaged during mouse use, specifically the first dorsal interosseous, the extensor digitorum, and the extensor carpi radialis longus. By combining subjective ratings with quantitative iEMG data, the study aims to comprehensively evaluate how mouse back peak position variations affect grip comfort and muscular load.
Experimental Procedure Step 1: Participant Briefing and Consent
Upon arrival, participants received an explanation of the study, signed an informed consent form, and completed a demographic questionnaire.
Effects of Mouse Back Shape on Grip Comfort: An Ergonomic Study 15
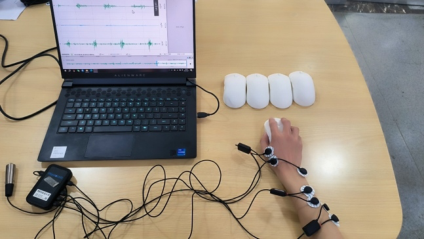
Step 2: Anthropometric Measurements Vernier callipers were used to measure the length and width of each participant’s right palm, and the measurement were recorded Step 3: Experimental Tasks Participants, seated in a natural and relaxed posture using a palm grip, tested all mouse prototypes in a randomized, repeated measures design, see figure 2 for the experimental task and environment configuration. For each mouse model, two tasks were performed with a uniform clicking pace:
Task 1 (Left-Click): 20 left-clicks were executed on a designated target area within a 20-second interval.
Task 2 (Right-Click): 20 right-clicks were performed under similar conditions.
Step 4: Randomization and Post-Task Interview The order of mouse prototype testing was randomized for each participant. Following the tasks, all subjects were asked to fill in a questionnaire to gather feedback on subjective comfort and usability.
Figure 2: Experimental task and environment configuration.
Statistics This study employed IBM SPSS Statistics Version 24.0 to analyze the subjective comfort ratings and the electromyographic (iEMG) data collected during the experiments.
Subjective Comfort Ratings Analysis The internal consistency of the comfort rating questionnaire was assessed using Cronbach’s Alpha, which yielded a coefficient of 0.942, indicating high reliability and suitability for subsequent analysis. The normality of the subjective ratings was verified using the Shapiro-Wilk test, and Levene’s test verified the homogeneity of variances. Based on these assumptions, a one- way ANOVA was conducted to compare the effects of the five mouse models on three dimensions of comfort—muscle relaxation, grip fit, and overall comfort. Significance levels were set at p < 0.05 for significance and p < 0.01 for high significance.
16 Li and Wang
Electromyographic (iEMG) Data Analysis The Shapiro-Wilk test indicated that the iEMG data deviated from normality (p < 0.001). The Kruskal-Wallis H test was applied to compare iEMG values among different mouse models for each muscle group—namely, the first dorsal interosseous, extensor digitorum, and extensor carpi radialis longus.
RESULTS
Analysis of Muscle Relaxation Levels for Five Mouse Models
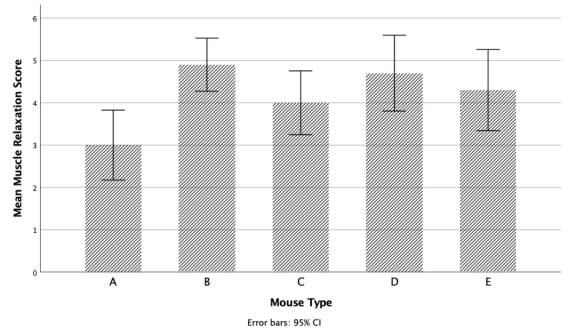
Table 2 presents the mean subjective muscle relaxation scores and the results of the one-way ANOVA for the five mouse models. The analysis revealed significant differences in muscle relaxation ratings among the different mouse designs (p < 0.01). Specifically, the medium-profile model (B) achieved the highest mean score (M = 4.90), followed by the forward-shifted model (D) (M = 4.70). In contrast, the low-profile model (A) recorded the lowest mean score (M = 3.00). The high-profile (C) and rear-shifted (E) models received mean scores of 4.00 and 4.30, respectively, see Table 2 and Figure 3.
These findings suggest that the mouse model with a medium back peak (B) offers superior muscle relaxation during use. In contrast, the low-profile model (A) may need further design optimization to reduce muscle tension.
Note: In this study, the five mouse models were designated as follows: A – low profile, B – medium profile, C – high profile, D – forward shifted, and E – rear shifted.
Table 2: Mean muscle relaxation scores (standard deviations) and one-way ANOVA results (n = 10) for five mouse models.
Table available in the original PDF paper.
Mouse Type F P A B C D E Score 3.00(1.155) 4.90(0.876) 4.00(1.054) 4.70(1.252) 4.30(1.337) 4.241 0.005
Figure 3: Average muscle relaxation scores of five mouse models.
Effects of Mouse Back Shape on Grip Comfort: An Ergonomic Study 17
Analysis of Grip Fit Ratings for Five Mouse Models
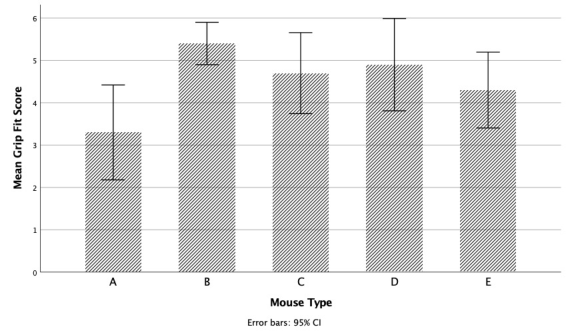
Table 3 shows the average grip fit score of different mice. There were significant differences in the mean score of subjective perceived grip fit of each mouse (p < 0.05). The model corresponding to the original scanned design (Model B) received the highest user ratings. In contrast, the model with the lowest back peak (Model A) was rated the poorest regarding grip fit.
Table 3: Mean grip fit scores (standard deviations) and one-way ANOVA results (n = 10) for five mouse models.
Table available in the original PDF paper.
Mouse Type F P A B C D E Score 3.30(1.567) 5.40(0.699) 4.70(1.337) 4.90(1.524) 4.30(1.252) 3.607 0.012
Figure 4: Average grip fit scores of five mouse models.
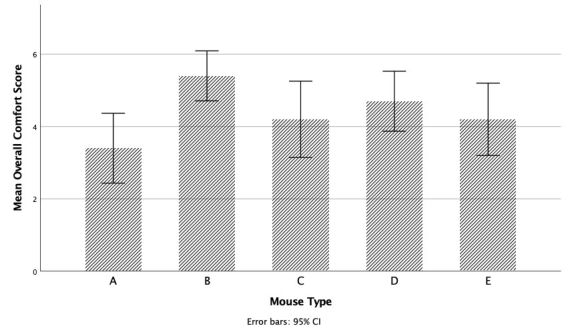
Analysis of Overall Comfort Ratings for Five Mouse Models A one-way ANOVA examined differences in overall comfort ratings across the five mouse models. The analysis revealed statistically significant differences (p < 0.05). Model B, corresponding to the baseline design, received the highest overall comfort rating (M = 5.40), whereas Model A was rated the lowest (M = 3.40).
Table 4: Mean overall comfort scores (standard deviations) and one-way ANOVA results (n = 10) for five mouse models.
Table available in the original PDF paper.
Mouse Type F P A B C D E Score 3.40(1.350) 5.40(0.966) 4.20(1.476) 4.70(1.160) 4.20(1.398) 3.291 0.019
18 Li and Wang
Figure 5: Average overall comfort scores of five mouse models.
Analysis of Electromyographic (iEMG) Data To assess muscle activation levels across different mouse designs, integrated electromyography (iEMG) values were analyzed for three muscles: the first dorsal interosseous (iEMG_1), extensor digitorum (iEMG_2), and extensor carpi radialis longus (iEMG_3). Separate analyses were conducted for left- click and right-click tasks.
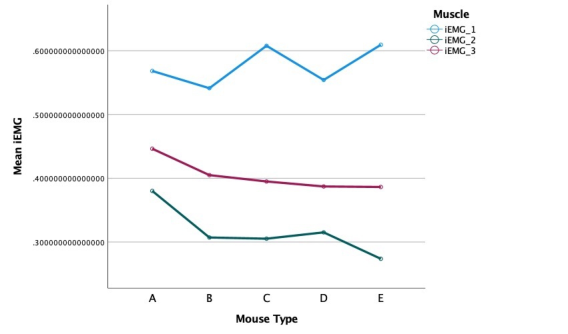
Left-Click Task Since the iEMG data did not meet the normality assumption (Shapiro-Wilk test, p < 0.05), a non-parametric Kruskal-Wallis H test was performed to compare muscle activation across the five mouse models. The Kruskal- Wallis H test results indicated no statistically significant differences in muscle activation among the five mouse models for any muscle group.
Model C exhibited the highest iEMG_1 value among the five models, suggesting higher muscle activation and potentially more significant muscle strain. Model B showed slightly lower iEMG values across all muscle groups, aligning with higher subjective comfort ratings.
Table 5: Mean iEMG value (standard deviation) of three muscles and Kruskal Wallis h test analysis results (n = 10).
Table available in the original PDF paper.
Muscles Type H P A B C D E iEMG_1 0.57(0.284) 0.54(0.349) 0.61(0.431) 0.55(0.315) 0.61(0.423) 0.093 0.999 iEMG_2 0.38(0.224) 0.31(0.186) 0.31(0.133) 0.32(0.188) 0.27(0.128) 3.431 0.489 iEMG_3 0.45(0.228) 0.40(0.214) 0.39(0.194) 0.39(0.180) 0.39(0.194) 1.083 0.897
Effects of Mouse Back Shape on Grip Comfort: An Ergonomic Study 19
Figure 6: Average iEMG value of three muscles.
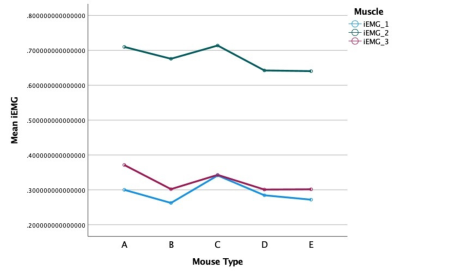
Right-Click Task Since the iEMG data did not meet the normality assumption (Shapiro-Wilk test, p < 0.05), a non-parametric Kruskal-Wallis H test was performed to compare muscle activation across the five mouse models. The Kruskal- Wallis H test results indicated no statistically significant differences in muscle activation among the five mouse models for any muscle group. Model A and C showed slightly higher iEMG_2 activation. The baseline Model B maintained relatively lower iEMG values.
Table 6: Mean iEMG value (standard deviation) of three muscles and Kruskal Wallis h test analysis results (n = 10).
Table available in the original PDF paper.
Muscles Type H P A B C D E iEMG_1 0.30(0.180) 0.26(0.137) 0.34(0.173) 0.28(0.132) 0.27(0.116) 1.469 0.832 iEMG_2 0.71(0.375) 0.68(0.424) 0.71(0.407) 0.64(0.384) 0.64(0.446) 0.722 0.949 iEMG_3 0.37(0.235) 0.30(0.234) 0.34(0.245) 0.30(0.198) 0.30(0.202) 0.986 0.912
Figure 7: Average iEMG value of three muscles.
20 Li and Wang
DISCUSSION
This study investigated the effects of changing the peak position of a mouse’s back on subjective comfort and muscle activation.
Subjective Comfort Ratings The subjective evaluations of muscle relaxation, grip fit, and overall comfort revealed significant differences among the five mouse models. The medium- profile model (B), corresponding to the baseline design, consistently received the highest ratings across all comfort dimensions, whereas the low-profile model (A) was rated the lowest. These results suggest that a moderate back height balances palm support and grip stability, enhancing user comfort. In contrast, the low-profile model (A) may induce greater hand strain due to insufficient palm support, leading to reduced muscle relaxation and overall comfort.
Electromyographic (iEMG) Analysis Despite subjective comfort differences, the iEMG results did not indicate statistically significant differences in muscle activation among the five mouse models. This aligns with prior research suggesting that short-duration tasks may not always capture substantial variations in muscle activation (Gustafsson and Hagberg, 2003). Considering that the task involves simple clicking actions rather than prolonged or complex maneuvers, the variation in muscle loading will likely be slight across designs.
Design Recommendations The results indicate that modifying the peak position of the mouse back influences subjective comfort but does not significantly affect short-term muscle activation. From an ergonomic design perspective, a moderate back height, as observed in Model B, appears optimal for balancing palm support and grip stability. While extreme height adjustments (either too low or too high) may reduce comfort, minor forward shifts (as seen in Model D) may offer additional ergonomic benefits.
Limitations and Future Research The sample size was relatively small, which may limit the generalizability of the findings. Meanwhile, the tasks performed were relatively brief, potentially underestimating the long-term impact of different designs on muscle strain. Future research could expand the sample size, introduce more complex interaction tasks, and use extended testing durations to assess fatigue effects.
Future design iterations could explore surface curvature, thumb support, or button position adjustments to complement the optimal back height and enhance ergonomic performance. Additionally, integrating long-term user testing and biomechanical analysis could provide deeper insights into how designs affect fatigue and musculoskeletal strain over extended periods of use.
Effects of Mouse Back Shape on Grip Comfort: An Ergonomic Study 21
CONCLUSION
This study investigated the effects of varying the peak position of the mouse back on subjective comfort and muscle activation during standard pointing tasks. Five mouse models, including a baseline model and four modified versions, were evaluated based on subjective ratings of muscle relaxation, grip fit, overall comfort, and objective electromyographic (iEMG) data.
The results from subjective assessments revealed significant differences among the five models, with the baseline model (Model B) consistently receiving the highest comfort ratings. Conversely, the low-profile design (Model A) was rated the lowest across all subjective dimensions, indicating that reducing the back height may compromise user comfort. In addition, the forward and backward movement of the vertex position also has an impact on comfort. The test results show that when the vertex position is appropriately moved forward, it can provide better hand support and reduce the burden on the wrist.
However, the analysis of iEMG data did not reveal statistically significant differences in muscle activation among the five models. This finding suggests that the relatively short duration of the tasks performed in this study may not have been sufficient to induce measurable variations in muscle load. Additionally, the complexity of hand biomechanics and the involvement of multiple muscle groups in mouse operation may have contributed to the observed variability in EMG signals.
Overall, these findings provide valuable insights into ergonomic mouse design by demonstrating the importance of back curvature in determining user comfort. While subjective ratings indicate a clear preference for the baseline and forward-shifted models, the lack of significant differences in muscle activation highlights the need for further studies with extended task durations and additional physiological measures. Future research could explore long-term usage effects and include a wider range of hand sizes for broader applicability, ultimately informing the development of optimized ergonomic input devices.
ACKNOWLEDGMENT
The authors would like to express sincere thanks to the helpful related staff in the Anthropometry and Wearables Design Lab at Hunan University.
REFERENCES
Chen, H.-M., Lee, C.-S., and Cheng, C.-H. (2012). The weight of computer mouse affects the wrist motion and forearm muscle activity during fast operation speed task. European Journal of Applied Physiology, Volume 112 No. 6, pp. 2205–2212. De Korte, E. M., De Kraker, H., Bongers, P. M., and Van Lingen, P. (2008). Effects of
a feedback signal in a computer mouse on movement behaviour, muscle load, productivity, comfort and user-friendliness. Ergonomics, Volume 51 No. 11, pp. 1757–1775. Dennerlein, J. T., and Johnson, P. W. (2006). Changes in upper extremity biomechanics across different mouse positions in a computer workstation. Ergonomics, Volume 49 No. 14, pp. 1456–1469.
22 Li and Wang
Fagarasanu, M., and Kumar, S. (2003). Carpal tunnel syndrome due to keyboarding and mouse tasks: A review. International Journal of Industrial Ergonomics, Volume 31 No. 2, pp. 119–136. Gustafsson, E., and Hagberg, M. (2003). Computer mouse use in two different hand
positions: Exposure, comfort, exertion and productivity. Applied Ergonomics, Volume 34 No. 2, pp. 107–113. Hasan, T. (2017). Case study on mouse geometry to enhance the human performance and comfort during online survey task. American Journal of Mechanics and Applications, Volume 5 No. 2, p. 8. Karlqvist, L., Bernmark, E., Ekenvall, L., Hagberg, M., Isaksson, A., and Rostö, T.
(1999). Computer mouse and track-ball operation: Exposure, comfort, exertion and productivity. International Journal of Industrial Ergonomics, Volume 23 No. 3, pp. 157–169. Keir, P. J., Bach, J. M., and Rempel, D. (1999). Effects of computer mouse design and task on carpal tunnel pressure. Ergonomics, Volume 42 No. 10, pp. 1350–1360. Lee, D. L., Fleisher, J., McLoone, H. E., Kotani, K., and Dennerlein, J. T. (2007).
Alternative computer mouse design and testing to reduce finger extensor muscle activity during mouse use. Human Factors: The Journal of the Human Factors and Ergonomics Society, Volume 49 No. 4, pp. 573–584. Lin, M. Y. C., Young, J. G., and Dennerlein, J. T. (2015). Evaluating the effect of four different pointing device designs on upper extremity posture and muscle activity during mousing tasks. Applied Ergonomics, Volume 47, pp. 259–264. Lourenço, M. L., Pitarma, R. A., and Coelho, D. A. (2022). A design contribution
to ergonomic PC mice development. International Journal of Environmental Research and Public Health, Volume 19 No. 13, p. 8126. Odell, D., and Johnson, P. (2015). Evaluation of flat, angled, and vertical computer mice and their effects on wrist posture, pointing performance, and preference. Work, Volume 52 No. 2, pp. 245–253.
LISTED IN THE AHFE DIGITAL BOOKSTORE CATALOGUE
Explore the complete digital volume
Ergonomics In Design and Kansai Engineering
Read this individual research paper free through the original publisher, or explore the full digital proceedings book.
ISBN 978-1-964867-46-5
Explore this ISBN in the AHFE Bookstore ↗Listed in the July 2026 bookstore catalogue; search by ISBN to confirm current availability · Digital book purchase optional