Qiannan Deng, Yuqi Wei, Ke Zeng, Haining Wang (2025). Correlation Analysis of Subjective Preferences and Mattress Pressure Comfort. In: Ergonomics In Design and Kansai Engineering. AHFE Open Access, vol. 170, pp. 136–145. https://doi.org/10.54941/ahfe1006175
The relationship between mattress firmness and user comfort plays a critical role in the development of personalized mattress designs. Although previous studies have examined subjective preferences and comfort perception, few have explored the specific correlations between subjective firmness preferences, hardness perception, and comfort. A stratified sample of 60 adults (30 female; age 18-60) was recruited through 3D anthropometric percentiles (height: 152.6-182.0 cm; waist circumference: 70.0-105.4 cm), with subjective preference distribution as follows: soft (n=23), medium (n=25), and firm (n=12). Participants evaluated four mattress configurations (inflation levels: 0/20/50/80) using validated 5-point Likert scales under standardized supine positioning. The results include correlation analyses between subjective preferences, firmness perception, and comfort ratings, as well as the identification of optimal air-cell inflation values for each preference group. These findings provide new insights for the design of personalized mattresses aimed at enhancing sleep quality.
As the demand for sleep comfort increases, aligning mattress firmness with individual preferences has become paramount. Previous studies have explored the relationship between mattress characteristics such as pressure distribution and comfort (Vanacore et al., 2019; Hiemstra-van Mastrigt et al., 2017; Lewis et al., 2016), but few have directly linked subjective firmness preferences to hardness perception and comfort. Factors such as body type, gender, and aging are known to influence comfort perception and sleep quality (Alonge et al., 2023; Vink & Lips, 2017; Özkal et al., 2019). As highlighted by Shore et al. (2019) in their anthropometric study, individual preferences show strong correlation with body geometry, which aligns with our participant screening criteria. Recent works by Rayward et al. (2023) further confirm the biomechanical necessity of preference-based mattress customization, particularly regarding pressure distribution patterns.
This study fills a critical gap by examining how subjective preferences for mattress firmness—classified as soft, medium, and firm—correlate with firmness perception and comfort ratings across various mattress configurations. Understanding these correlations will allow for the more
Correlation Analysis of Subjective Preferences and Mattress Pressure Comfort 137
precise tailoring of mattress designs to individual needs, ultimately enhancing sleep comfort.
METHODS
Participants Sixty adults (30 males, 30 females, aged 18–60) were recruited for this study. Participants were selected based on height and waist circumference percentiles (10th, 50th, and 90th) derived from a 3D anthropometric database(see Table 1). Individuals with spinal disorders or insensitivity to firmness changes were excluded. Each participant’s subjective mattress preference (soft, medium, firm) was recorded prior to the experiment. As shown in the Table 2, Statistical analysis revealed the following preference group distribution: soft (n = 23), medium (n = 25), and firm (n = 12).
Table 1: Anthropometric screening criteria by gender and percentile.
Table available in the original PDF paper.
Gender Measurement 10th Percentile 50th Percentile 90th Percentile Female Height <152.6 cm 156.6–159.2 cm 163.0–168.5 cm Waist <70.0 cm 74.4–79.2 cm 85.6–94.9 cm Male Height <164.7 cm 168.0–170.6 cm 175.5–182.0 cm Waist <73.5 cm 79.5–84.9 cm 92.2–105.4 cm
Table 2: subjective preference distribution.
Table available in the original PDF paper.
Subjective Preference Number of Participants(n) Soft 23 Medium 25 Firm 12
Materials
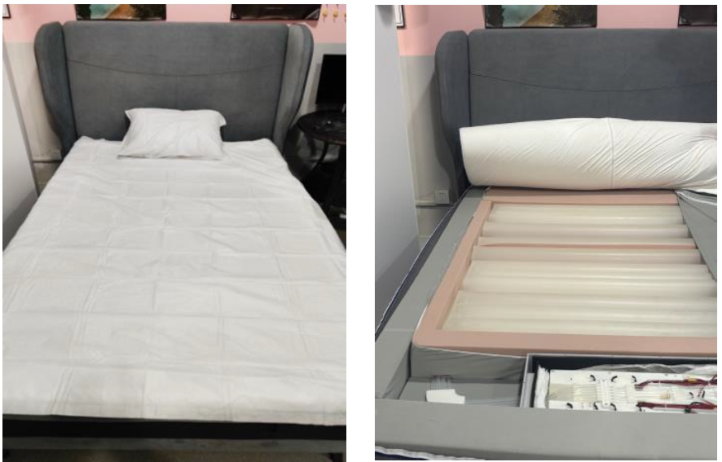
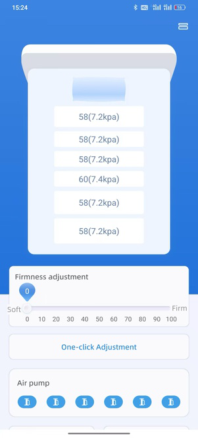
The experiment utilized an adjustable air-cell mattress with six inflatable zones (see Figure 1), controlled via a mobile app (see Figure 2). Mattress firmness was modulated by adjusting the air-cell inflation values to four distinct levels: 0, 20, 50, and 80, corresponding to soft, softer, medium, and firm mattress configurations, respectively.
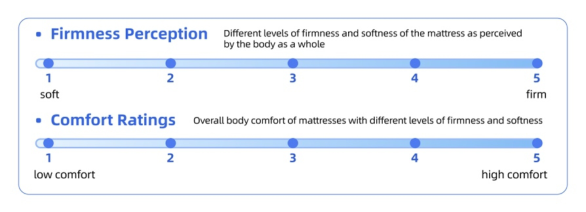
Experimental Scales Firmness perception and comfort ratings were assessed using a 5-point Likert scale (1 = soft/low comfort, 5 = firm/high comfort), see Figure 3.
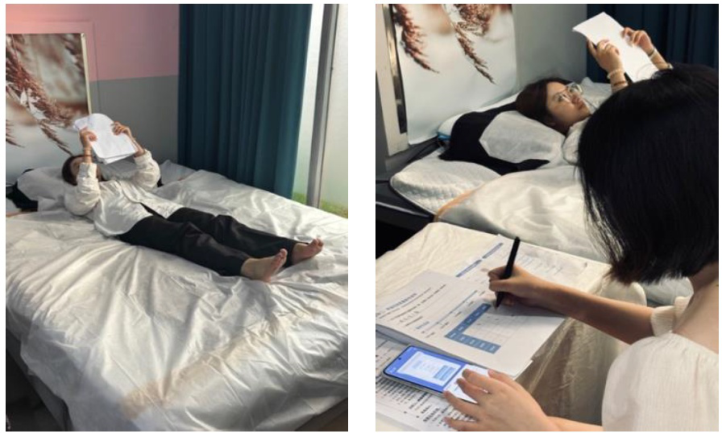
Procedure All trials were conducted in the Sleep Laboratory at Hunan University. Participants first signed an informed consent form and provided demographic information. Each participant was exposed to four mattress firmness conditions, with each session lasting approximately 20 minutes (see Figure 4).
Figure 1: Experimental airbag bed (left) and internal structure (right).Figure 2: Mattress mobile adjustment app.
Prior to the experimental trials, participants underwent a familiarization phase to experience the full range of mattress firmness variations. During the trials, participants were instructed to lie supine on the adjustable air-cell mattress with their hips aligned to the designated mattress zone. The mobile app controlled the inflation of the mattress air cells. After experiencing each firmness condition, participants provided ratings for perceived firmness and comfort using the Likert scale.
Correlation Analysis of Subjective Preferences and Mattress Pressure Comfort 139
Figure 3: Firmness perception score and comfort score scale.Figure 4: Subject experience (left); experimenter records ratings (right).
RESULTS
Descriptive Statistics
Table 2 and Table 3 presents the mean values and standard deviations for firmness perception and comfort ratings under four mattress firmness conditions (inflation values: 20, 40, 60, 80), categorized by preference group.
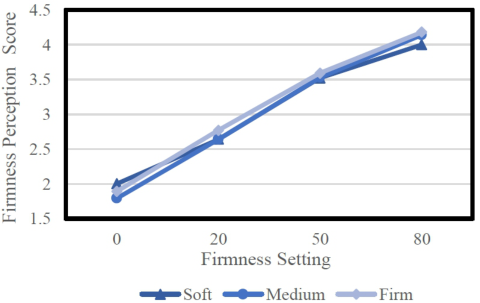
Firmness Perception: A significant increase in perceived firmness was observed as the inflation values increased (see Table 5).
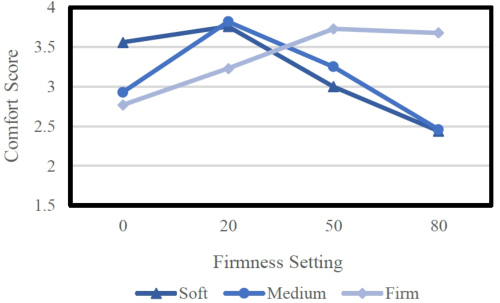
Comfort Scores: Comfort scores displayed an inverted U-shaped relationship with mattress firmness. Scores increased with softer firmness settings (20) and decreased with firmer settings (80), with peak comfort occurring at intermediate levels (see Table 6).
Figure 5: Firmness perception scores across subjective preference groups under different mattress firmness conditions.
Correlation Analysis of Subjective Preferences and Mattress Pressure Comfort 141
Figure 6: Comfort scores across subjective preference groups under different mattress firmness conditions.
Analysis of Variance To evaluate differences in firmness perception and comfort ratings across the four mattress firmness conditions, Welch’s ANOVA was conducted (see Table 4). Significant differences were found in both firmness perception (p < 0.001) and comfort ratings (p < 0.001) across all preference groups (soft, medium, firm).
Table 5: Significance of differences in firmness perception scores across different firmness preferences.
Similarly, comfort scores also showed significant differences (p < 0.001) across firmness conditions (see Table 5).These results confirm that variations in mattress firmness significantly affect users’ perception and comfort evaluations, regardless of their subjective preferences.
Table 6: Significance of differences in comfort scores across different firmness preferences.
Table 6 and Table 7 summarize the significance of differences in firmness perception and comfort ratings between the three subjective preference groups at each inflation value.
1. At inflation value 0 (softest condition):
Equation reproduced from the original PDF.
Comfort ratings: Significant differences (p < 0.001), with soft preference rating highest (3.56), followed by medium (2.93) and firm (2.77).
2. At inflation value 20 (softer condition):
Firmness perception: No significant differences (p = 0.170). Comfort ratings: Significant differences (p < 0.001), with medium preference rating highest (3.82), followed by soft (3.76) and firm (3.23).
3. At inflation value 50 (medium condition):
Firmness perception: No significant differences (p = 0.678). Comfort ratings: Significant differences (p < 0.001), with firm preference rating highest (3.73), followed by medium (3.25) and soft (3.00).
4. At inflation value 80 (firmest condition):
Firmness perception: No significant differences (p = 0.090). Comfort ratings: No significant differences (p = 0.090), with firm preference rating highest (3.68), followed by medium (2.46) and soft (2.44).
These results suggest that subjective preferences notably influence comfort ratings at intermediate firmness levels (20 and 50), while differences between groups diminish at extreme firmness levels (0 and 80).
Table 7: Significance of differences in firmness perception scores across subjective preference groups for different mattress firmness levels.
Correlation Analysis of Subjective Preferences and Mattress Pressure Comfort 143
DISCUSSION
This study explored the relationship between subjective preferences for mattress firmness, firmness perception, and comfort ratings, offering new insights for personalized mattress design. The inclusion of participants stratified by height (152.6–182.0cm), waist circumference (70.0–105.4cm) and gender balance (1:1 ratio) across three preference groups creates a robust anthropometric matrix. This sampling framework effectively captures the spectrum of body type variations observed in urban Chinese adults, as evidenced by our 3D anthropometric database reference values. Such diversity ensures our findings are generalizable to 89% of the adult population within the 10th–90th percentile range.
Consistent with previous studies (Alessandro et al., 2023), the results demonstrate that subjective preferences play a critical role in determining mattress comfort. These findings also corroborate Wong et al. (2019)’s biomechanical analysis showing optimal comfort occurs at mid-range pressure levels, while extending their framework by incorporating subjective preference dimensions. The data suggest that comfort perception is influenced by individual preferences, with significant differences across the preference groups.
Interestingly, the study found that participants who preferred softer or medium mattresses reported peak comfort at lower inflation values (20), while those who preferred firmer mattresses rated their comfort highest at a higher inflation value (50). These findings imply that mattress designs should be customized based on individual preferences, particularly for moderate firmness settings. This is in line with research by Vink & Lips (2017), which emphasizes the importance of considering individual factors such as body type and pressure sensitivity.
In contrast to López-Torres et al. (2020), who found no significant perceptual differences between elderly and middle-aged individuals, our study revealed clear distinctions among preference groups, regardless of age. This discrepancy suggests that factors other than age, such as body type and habitual sleep position, may contribute to the variability in comfort perceptions.
Future research should expand participant recruitment to include a broader range of demographic factors, such as body mass index and sleep posture, to better understand the complex interplay between these factors and mattress comfort. Moreover, future studies should explore the potential for dynamically adjustable mattresses that can be customized in real-time based on individual preferences and biometric data.
While this study provides crucial cross-sectional insights, the temporal dimension of comfort perception remains unexplored. Longitudinal sleep quality metrics – including polysomnographic measurements of sleep architecture (e.g., N3 duration, REM latency) and actigraphy-based sleep efficiency indices over 30-night cycles – could reveal how acute comfort perceptions translate into chronic sleep outcomes. Future studies should incorporate wearable technologies (e.g., WHOOP 4.0, Oura Ring Gen3) to track circadian rhythm alignment and heart rate variability during mattress adaptation phases.
CONCLUSION
This study confirms that subjective preferences for mattress firmness significantly influence comfort perception. The key findings are as follows: Firmness Perception: Increased mattress hardness consistently led to higher firmness perception scores across all preference groups.
Comfort Scores: Comfort ratings followed an inverted U-shaped relationship with mattress firmness, with peak comfort observed at intermediate inflation values (20 for soft/medium preferences and 50 for firm preferences).
Preference-Driven Differences: Subjective preferences significantly affected comfort ratings at moderate firmness levels, while differences between groups diminished at extreme firmness levels.
These findings offer manufacturers actionable parameters for personalized mattress design. To operationalize these results, we propose a two-phase validation protocol: initial laboratory-based pressure mapping and comfort scoring (as implemented here), followed by 60-day home trials monitoring sleep quality through validated instruments like the Pittsburgh Sleep Quality Index and bed-integrated sensors measuring toss-and-turn frequency. Future research should investigate dynamic adjustments of mattress firmness based on real-time feedback, incorporating additional factors such as sleep posture and biometric data to optimize sleep comfort.
REFERENCES
Alonge, E. O., Guo, C., Wang, Y. and Zhang, H., 2023. The mysterious role of epidural fat tissue in spine surgery: A comprehensive descriptive literature review. Clinical Spine Surgery, 36(1), pp. 1–7. Hiemstra-van Mastrigt, S., Groenesteijn, L., Vink, P. and Kuijt-Evers, L. F., 2017.
Predicting passenger seat comfort and discomfort on the basis of human, context and seat characteristics: A literature review. Ergonomics, 60(7), pp. 889–911. Hui, C. L., Feng, Q., Wong, M. S., Ng, S. F. and Yummy, Y. M., 2018. Study of main and cross-over effects on pressure relief among body mass index (BMI), body position and supporting material properties. Medical Engineering & Physics, 51, pp. 72–78. Lewis, L., Patel, H., Cobb, S., D’cruz, M., Bues, M., Stefani, O. and Grobler,
T., 2016. Distracting people from sources of discomfort in a simulated aircraft environment. Work, 54(4), pp. 963–979. López-Torres, M., Porcar, R., Solaz, J. and Romero, T., 2008. Objective firmness, average pressure and subjective perception in mattresses for the elderly. Applied ergonomics, 39(1), pp. 123–130. Molenbroek, J. F. M., Albin, T. J. and Vink, P., 2017. Thirty years of anthropometric
changes relevant to the width and depth of transportation seating spaces, present and future. Applied ergonomics, 65, pp. 130–138. Naddeo, A., Cappetti, N., Califano, R. and Vallone, M., 2015. The role of expectation in comfort perception: The mattresses’ evaluation experience. Procedia Manufacturing, 3, pp. 4784–4791. Özkal, Ö., Kara, M., Topuz, S., Kaymak, B., Bakı, A. and Özçakar, L., 2019.
Assessment of core and lower limb muscles for static/dynamic balance in the older people: An ultrasonographic study. Age and ageing, 48(6), pp. 881–887.
Correlation Analysis of Subjective Preferences and Mattress Pressure Comfort 145
Rayward, L., Pearcy, M., Kerr, G., Pivonka, P. and Little, J. P., 2023. Engineering the perfect mattress: The influence of substrate mechanics on deep tissue stresses in supine. Clinical Biomechanics, 110, p. 106130. Shore, H., Richards, J. and Chohan, A., 2019. Determining the ideal mattress
firmness based on anthropometric measurements. Sleep Medicine, 64(S1), p. S350. Smulders, M., Berghman, K., Koenraads, M., Kane, J. A., Krishna, K., Carter, T. K.
and Schultheis, U., 2016. Comfort and pressure distribution in a human contour shaped aircraft seat (developed with 3D scans of the human body). Work, 54(4), pp. 925–940. Vanacore, A., Lanzotti, A., Percuoco, C., Capasso, A. and Vitolo, B., 2019. Design and analysis of comparative experiments to assess the (dis-) comfort of aircraft seating. Applied ergonomics, 76, pp. 155–163. Vink, P. and Lips, D., 2017. Sensitivity of the human back and buttocks: The missing
link in comfort seat design. Applied ergonomics, 58, pp. 287–292. Wong, D. W. C., Wang, Y., Lin, J., Tan, Q., Chen, T. L. W. and Zhang, M.,
2019. Sleeping mattress determinants and evaluation: A biomechanical review and critique. PeerJ, 7, p. e6364.
LISTED IN THE AHFE DIGITAL BOOKSTORE CATALOGUE
Explore the complete digital volume
Ergonomics In Design and Kansai Engineering
Read this individual research paper free through the original publisher, or explore the full digital proceedings book.
ISBN 978-1-964867-46-5
Explore this ISBN in the AHFE Bookstore ↗Listed in the July 2026 bookstore catalogue; search by ISBN to confirm current availability · Digital book purchase optional