Shu Wang, Yujia Du, Haining Wang (2025). The Effect of Facial size on Perceived Wearing Comfort of Vision Pro. In: Ergonomics In Design and Kansai Engineering. AHFE Open Access, vol. 170, pp. 85–94. https://doi.org/10.54941/ahfe1006170
With the rapid development of virtual reality (VR) technology, VR headsets have gained widespread applications across various fields. However, wearing comfort remains one of the key issues affecting their long-term use and widespread adoption. Specifically, how individual facial characteristics, such as face width and face height, influence wearing comfort has not been sufficiently explored. This study aims to investigate the specific effects of face width and face height on the wearing comfort of VR headsets and assess the role of gender differences in comfort evaluation. Through wearing experiments with 20 participants (including 10 males and 10 females), this study systematically analyzes the effects of face width and face height on the VR headset wearing experience. The results show that face width and face height have significant effects on different dimensions, such as comfort, pressure, and sense of downward pull, and gender differences play an important role in certain comfort dimensions. In particular, the interaction between face width and face height significantly affects comfort scores, suggesting that the diversity of facial features should be considered in the design of VR headsets. This study provides theoretical support for the personalized optimization of VR hardware design and offers data support for the future widespread application and customization of VR devices.
Virtual Reality (VR) technology has made significant progress in various fields in recent years (Statista, 2016), particularly in industries such as entertainment, education, and healthcare (Xiao et al., 2018). VR headsets have become the core tool for achieving immersive experiences. However, despite the outstanding performance of VR technology in enhancing user experience, comfort remains a key barrier to its long-term use and widespread adoption. Comfort not only affects the quality of user experience but also directly relates to the usability of VR devices and the physical and mental well-being of users (Wang et al., 2020). Prolonged use of VR headsets may lead to issues such as headaches, neck fatigue, and eye discomfort (Du, 2023), which can undermine immersion and limit the sustained application of the devices. Therefore, improving wearability comfort is a critical issue in current VR hardware design.
Existing literature widely explores factors such as headset weight (Yan et al., 2019), visual dizziness (Saredakis et al., 2020), and stability (Knight
et al., 2006; Knight and Baber, 2005) in relation to comfort. However, the specific impact of individual facial features, particularly the morphometric characteristics of face width and face height, on wearability has not been fully addressed (Yan et al., 2019). Face width (the distance between the cheekbones) and face height (the vertical distance from the tip of the nose to the glabella) are important parameters that reflect an individual’s facial structure. These features may significantly influence comfort by affecting the headset’s fit, pressure distribution, and position (Du, 2023). While some studies suggest a potential relationship between facial morphology and comfort (Chi, 2020), systematic research on the specific role of face width and face height in VR headset wearability is still limited.
To fill this research gap, the present study aims to explore the impact of face width and face height on VR headset wearability comfort, particularly in terms of comfort, pressure, and sensation of drooping. By analyzing the influence of different facial types on the wearing experience, this study seeks to provide data support for the personalized design of VR devices and promote hardware optimization that better aligns with users’ facial features.
METHODS
Participants A total of 20 healthy adults participated in the experiment, with 10 males and 10 females, aged between 20 and 30 years, and an average age of 23.05. All participants had prior experience using VR products before the experiment. None of the participants had facial soft tissue or skeletal diseases. Prior to the experiment, all participants received an explanation of the study content and signed an informed consent form. Table 1 summarizes the descriptive statistical data of the participants.
Table 1: Descriptive statistics of participant information.
Table available in the original PDF paper.
Male Female Min Max Avg SD Min Max Avg SD
Age 21 29 23.231 2.455 21 29 23.05 2.06 Face Width 92.61 132.58 118.52 8.51 102.61 132.58 117.48 7.54 Face Height 43.51 62.06 52.26 5.52 43.39 62.06 51.25 5.15 Devices and Software
The main experimental equipment in this study is the mixed reality headset Vision Pro, released by Apple in 2023. The overall width of the device is 19.9 cm (6.7 inches), the height is 17.1 cm (7.8 inches), and the depth is 11.2 cm (4.4 inches). After conducting market research, the experiment adopted a dual-strap wearing method, which was found to be more comfortable for users.
The primary measurement device used in the experiment is the flexible fabric facial pressure testing device developed by the Pressurefilms brand. The device has a measurement range of 0–100 kPa and is made of flexible fabric. It is designed to conform to the facial contours, allowing it to effectively
The Effect of Facial Size on Perceived Wearing Comfort of Vision Pro 87
measure the pressure between the VR device and the face during VR usage. The pressure testing device consists of ≥2000 sensor units. When pressure is applied, the sensor units detect the pressure by calculating changes in resistance and display the pressure values along with a 2D pressure heatmap in the accompanying software, PhlexSensorPro. Additionally, a caliper was used to measure the facial distance characteristics of the participants.
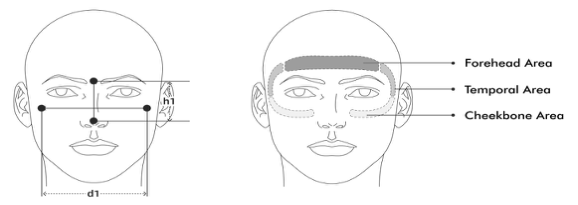
The Selected Feature Values for the Study In this study, based on facial morphological characteristics and the contact areas between the face and VR products during regular use, four feature points and two feature values were selected as the research subjects, referencing the head and face measurement points and values from the team of Haining Wang at Hunan University (Wang et al., 2022). The four feature points are: the left cheekbone point, the right cheekbone point, the glabella point, and the tip of the nose. Face width is defined as the distance between the left and right cheekbone points, and face height is defined as the distance between the glabella point and the tip of the nose.
For the determination of the VR wearability comfort dimensions, this study referenced existing research on VR wearability comfort, ultimately selecting five experimental dimensions related to facial contact comfort: discomfort, pressure, sensation of drooping, sensation of stuffiness (Rupp, 2022), and stability (Ito et al., 2021; Ito et al., 2019). The VAS 10-point scale (Crichton, 2001) was used to evaluate discomfort across three dimensions in the experiment. On the scale, a “6” is defined as the “point where the comfort of wear transitions completely to discomfort,” and a “10” is defined as “discomfort that is unbearable.” As shown in Figure 1. Additionally, to better understand the variation in discomfort across different areas of the face, the contact areas between the VR device and the face were divided into three regions: the forehead, the temple, and the cheekbone. The facial feature points and the facial region divisions are illustrated in Figure 2.
Figure 1: VAS scale schematic diagram.Figure 2: Facial feature values, facial region division diagram.
Experimental Process Before the experiment begins, participants will first be introduced to the overall process of the experiment, the meanings of the three rating dimensions, an overview of the three facial regions, and an explanation of the VAS rating scale. Participants will also complete basic information forms, including gender and age. Following this, the four feature points of each participant will be identified, and two facial feature values will be measured using a caliper. Once the formal wearing experiment begins, participants will be required to wear the Vision Pro headset for one hour. Every five minutes during the wear time, participants will rate their comfort level, and the experimenter will assist with recording the scores. Participants can adjust the VR headset during the experiment, and the wear test will end either when the time reaches one hour or when all scores reach a value of 10 before the end of the experiment. After the wearing experiment, participants will undergo facial pressure testing.
Data Processing The wearing pressure data for each participant, saved in the PhlexSensorPro software, will be exported in the form of txt data files and png pressure heatmaps. The data txt files and comfort ratings recorded in the experiment logs will be imported into an Excel file for preliminary data cleaning and outlier detection. After removing the outliers, the data will be used for further analysis.
Data Analysis The collected data will be analyzed using SPSS 26.0 (IBM, Armonk, New York, USA). All statistical significance levels will be set at 0.05. Since the rating data in this experiment was primarily obtained through supervisor assessment, a reliability test (ICC analysis) will be performed to ensure consistent understanding of the rating criteria by all participants. Descriptive statistics of the data will be calculated using SPSS. To understand gender differences, an independent sample t-test will be performed. Correlation analysis will be used to determine the relationship between face width, face height, and VR wearing comfort. Finally, based on facial type classification, one-way ANOVA will be conducted to assess the inter-group differences between different facial type categories.
RESULTS
Reliability Test The results of the reliability analysis for the VR headset wearability comfort scale, shown in Table 2, indicate that the Cronbach’s Alpha coefficient is 0.951, demonstrating a high level of internal consistency. The Cronbach’s Alpha coefficient for the standardized items is 0.952, which is close to the unstandardized Alpha coefficient, further confirming the reliability of the scale. In the item-total statistics, the Cronbach’s Alpha values after deleting
The Effect of Facial Size on Perceived Wearing Comfort of Vision Pro 89
each dimension are all higher than 0.943, indicating that the scale has stable reliability in assessing VR headset wearability comfort.
Table 2: Models reliability of dimension scores (ICC) test.
Region Sensation of Drooping - Overall 0.944 Sensation of Stuffiness 0.949 Stability 0.949 Comfort 0.943
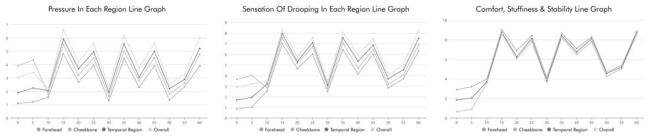
Descriptive Statistics By analyzing the descriptive statistical results of the subjective data and the line graphs of the average values at each time point (Figure 3), it can be observed that the overall pressure, sensation of drooping, and comfort show significant changes at different time points. The mean pressure increased from 1.5 to 6.1, the maximum value rose from 2 to 10, and the minimum value remained between 1 and 4. The standard deviation increased from 0.52 to 1.05, indicating a gradual increase in variability. The mean sensation of drooping increased from 1.2 to 6.8, with the maximum value consistently at 10, and the minimum value rising from 0 to 6. The standard deviation increased from 0.41 to 0.71, showing an increase in variability. The mean comfort increased from 2.7 to 9.4, with the maximum value consistently at 10 and the minimum value fluctuating between 2 and 9. The standard deviation gradually decreased from 0.82 to 0.49, indicating that the variability of comfort became more stable. Overall, the intensity and variability of pressure and sensation of drooping increased, while comfort continued to improve and stabilize.
Figure 3: Descriptive statistics of comfort scores for each dimension.
Gender Differences In the gender difference study of the Vision Pro VR headset, independent sample t-tests were conducted at time points 0 and 60, with the results presented in Table 3. At time point 0, the data showed a significant gender difference in “Sensation of Drooping - Cheekbone” (p = 0.049). At time point 60, the analysis revealed a significant gender difference in “Sensation of Stuffiness” (p = 0.042). No other significant gender differences were observed in the other dimensions.
Table 3: Independent samples t-test (grouping variable: gender; test variable: comfort scores for each dimension).
Correlation Analysis To better explore the relationship between face width and face height values and overall comfort, Pearson correlation tests were conducted at seven time points: 0, 10, 20, 30, 40, 50, and 60. The results, shown in Table 4, indicate that for face width and comfort, significant differences were observed at time points 0 and 10. For face height and comfort, a significant difference was found at time point 30. No significant differences were observed at the other time points.
Table 4: Correlation analysis of face width, face height, and comfort type.
Table available in the original PDF paper.
Time 0 10 20 30 40 50 60
p
Face Width 0.039* 0.012* 0.165 0.131 0.208 0.213 0.198 Face Height -0.08 0.155 0.163 0.019* -0.168 -0.221 -0.182
One-Way ANOVA Based on the head database data from Hunan University’s team led by Haining Wang, facial data (18–30 years, 1712 individuals) under experimental conditions were classified using the binary classification method. Nine different facial types were determined based on the values
The Effect of Facial Size on Perceived Wearing Comfort of Vision Pro 91
of face width and face height. The face width for the nine different facial morphologies was categorized into three types: large (L), medium (M), and small (S). Similarly, face height was also classified into three types: large (L), medium (M), and small (S). The classification criteria are shown in Table 5.
Table 5: Facial type classification criteria.
Table available in the original PDF paper.
S M L Face Width/mm 106.22≤x ≤115.52 115.52<x ≤124.82 124.82<x ≤134.22 Face Height/mm 43.37≤x ≤49.96 49.96<x ≤56.55 56.55<x ≤63.15
The study used a two-way ANOVA method to perform statistical analysis on the machine-readable scores (Table 6). The main effects of face width classification (p = 0.078) and face height classification (p = 0.088) were not significant in their impact on comfort scores. However, the interaction between face width type and face height type classification (p = 0.001) was significant at the 0.05 level, indicating that the interaction between face width type and face height type significantly affects comfort scores. Therefore, it can be inferred that the participants’ facial type can better explain their evaluation of VR wearability comfort.
Table 6: Between-subjects effect test (dependent variable: comfort).
Table available in the original PDF paper.
F-value Sig.
Sum of Squares (SS)
Degrees of Freedom (df)
Mean Square (MS) Corrected Model 155.362a 7 22.195 3.325 0.002 Intercept 6368.383 1 6368.383 953.980 0.000 Face Width Type 35.005 2 17.502 2.622 0.075 Face Height Type 32.724 2 16.362 2.451 0.088 Face Width Type * Face
119.596 3 39.865 5.972 0.001
Height Type Error 1682.250 252 6.676 Summary 11919.000 260 Corrected Total 1837.612 259
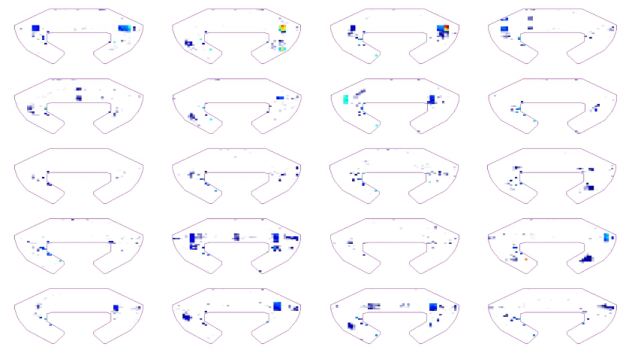
Pressure Heatmap Analysis Based on the analysis of the facial pressure heatmap, participants with S-type face width and S-type face height showed a uniform pressure distribution in the forehead and temporal regions, with the heatmap displaying distinct red and yellow areas, indicating an increased sense of tension. Participants with L-type face width and L-type face height also exhibited a similar pressure distribution across the facial regions, with the heatmap primarily showing blue and light blue transitional areas, suggesting lower local pressure and better recovery. Participants with M-type face width and M-type face height displayed a consistent and even pressure distribution, with the heatmap’s pressure color transitioning from light blue to purple, indicating moderate local pressure and overall comfort during wear.
Figure 4: Pressure heatmaps of each participant.
DISCUSSION
Data Validity The VR wearability comfort scores in this study underwent reliability testing, with a Cronbach’s Alpha of 0.951, indicating high internal consistency and the ability to reliably reflect wearers’ comfort. The standardized items had a Cronbach’s Alpha of 0.952, further confirming the scale’s efficiency and stability in evaluating VR comfort. The Alpha coefficients for each dimension, after item deletion, were all above 0.943, demonstrating consistent and effective measurements across multiple comfort dimensions, ensuring the validity and credibility of the study’s conclusions.
Continuous Wear Experimental results demonstrated that prolonged wear duration led to significant increases in mean pressure (+2.3) and drooping sensation (+3.1) scores at 60 minutes, with variability escalating over time. This trend aligns with prior findings (LeClair et al., 2018), suggesting that while participants initially tolerated discomfort, cumulative physical strain from the headset became pronounced with extended use. In contrast, comfort scores stabilized post-adaptation (initial 2.7 to final 9.4), indicating partial habituation. However, unresolved challenges in prolonged wear design persist, necessitating further optimization.
Gender Differences Gender-based analysis revealed localized perceptual disparities. Females reported significantly higher ratings for “Drooping Sensation - Cheekbone” (p = 0.049) at the experiment’s onset and “Sensation of Stuffiness” (p = 0.042) at its conclusion. These differences may stem from physiological variations, such as facial fat distribution and thermoregulatory mechanisms. No significant gender effects were observed in pressure or stability,
The Effect of Facial Size on Perceived Wearing Comfort of Vision Pro 93
underscoring the dimension-specific nature of gender impacts on comfort perception.
Impact of Face Width and Face Height and Their Interaction Effects In the analysis of the impact of face width and face height on comfort, Pearson correlation analysis revealed a significant correlation between face width and overall comfort at certain time points, especially in the early stages of wear (time points 0 and 10) and the middle stage (time point 30). This finding suggests that face width is a key factor affecting wearability comfort, with its effect being particularly noticeable in the early stages of wear. The relationship between face height and comfort, however, appears to be more complex, indicating that facial morphology’s impact on the wearing experience may be multi-dimensional. Further one-way ANOVA revealed that the interaction between face width and face height significantly affected comfort scores (p = 0.001, p < 0.05), suggesting that considering only face width or face height alone is insufficient to fully explain wearability comfort. The comprehensive characteristics of facial morphology likely play an important role in the wearing experience. Therefore, face type classification should be considered an important factor in VR headset design to improve comfort for different users.
Limitation and Suggestion The study’s limited sample size (N = 20) and demographic homogeneity constrain generalizability. Future work should expand participant diversity (e.g., age, ethnicity) and investigate adaptive mechanisms (e.g., dynamic tension adjustment, personalized padding) to enhance real-world applicability. Longitudinal studies assessing cumulative thermal effects and discomfort mitigation strategies are also warranted.
CONCLUSION
This study conducted an in-depth analysis of experimental data from 20 participants to explore the impact of face width and face height on VR headset wearability comfort. The results indicate that the interaction between face width and face height significantly affects comfort ratings, and facial features can partially explain the differences in individuals’ comfort perceptions. Additionally, gender differences exhibited significant effects in some comfort dimensions, particularly in the perception of drooping and stuffiness, where noticeable differences were found between females and males. Although the main effects of face width and face height on comfort scores were not significant, their interaction highlighted the importance of facial morphology in determining wearability comfort. Therefore, VR headset design should take into account users’ individual facial features, especially making adjustments for face type compatibility to improve comfort and user experience. Furthermore, this study provides a theoretical foundation for future VR hardware design, suggesting that when optimizing wearability comfort, factors such as facial morphology, gender differences, and wearing time should be comprehensively considered.
REFERENCES
Chi, Z., 2024. Research on the fit of virtual reality headsets. [PhD thesis] Hunan University. Crichton, N., 2001. Visual Analogue Scale (VAS). Journal of Clinical Nursing, 10(5),
p. 706. Du, Y., 2023. Research on the evaluation method of VR headset wearability comfort.
[PhD thesis] Hunan University. doi: 10.27135/dcnki.ghudu.2023.004384. Haining, W., Z, T., and Liu, K., 2022. Development of 3D reference headforms for Chinese adults. In: F. Rebelo, ed. Ergonomics in Design. AHFE (2022) International Conference. AHFE Open Access, vol. 47. USA: AHFE International. Available at: http://doi.org/10.54941/ahfe1001927 [Accessed 10 February 2025]. Ito, K., Tada, M., Ujike, H., et al., 2019. Effects of weight and balance of
head-mounted displays on physical load. In: Proceedings of the International Conference on Human-Computer Interaction. Springer, pp. 450–460. Ito, K., Tada, M., Ujike, H., et al., 2021. Effects of the weight and balance of headmounted displays on physical load. Applied Sciences, 11(15), p. 4563. Knight, J. F., and Baber, C., 2005. A tool to assess the comfort of wearable computers.
Human Factors, 47(1), pp. 77–91. Knight, J. F., Deen-Williams, D., Arvanitis, T. N., et al., 2006. Assessing the wearability of wearable computers. In: Proceedings of the 10th IEEE International Symposium on Wearable Computers. IEEE, pp. 75–82. LeClair, B., O’Connor, P., Podrucky, S., and Lievers, W. B., 2018. Measuring the mass
and center of gravity of helmet systems for underground workers. International Journal of Industrial Ergonomics, 64, pp. 23–30. Rupp, M. A., 2022. Evaluating the impact of VR headset microclimate temperature on perceptions of thermal discomfort and forehead temperature. In: Proceedings of the Human Factors and Ergonomics Society Annual Meeting. SAGE Publications, pp. 1285–1288. Saredakis, D., Szpak, A., Birckhead, B., et al., 2020. Factors associated with virtual
reality sickness in head-mounted displays: A systematic review and meta-analysis. Frontiers in Human Neuroscience, 14, p. 96. Statista, 2016. Virtual Reality Hardware Market Size Worldwide from 2016 to 2020.
[online] Available at: https://www.statista.com/statistics/550461/virtual-reality- market-size-worldwide/ [Accessed 10 February 2025]. Wang, H., Chi, Z., and He, R., 2020. Improvement of VR glasses fit using principal component analysis method. Mechanical Design, 2020(5), p. 8. doi: CNKI: SUN: JXSJ.0.2020–05-021. Xiao, L., Yi, W., Chi, H. L., Wang, X., and Chan, A. P. C., 2018. A critical review
of virtual and augmented reality (VR/AR) applications in construction safety. Automation in Construction, 86, pp. 150–162. Yan, Y., Chen, K., Xie, Y., Song, Y., Liu, Y., 2019. The effects of weight on comfort of virtual reality devices. In: F. Rebelo and M. Soares, eds. Advances in Ergonomics in Design. AHFE 2018. Advances in Intelligent Systems and Computing, vol. 777. Cham: Springer, pp. 373–384.
LISTED IN THE AHFE DIGITAL BOOKSTORE CATALOGUE
Explore the complete digital volume
Ergonomics In Design and Kansai Engineering
Read this individual research paper free through the original publisher, or explore the full digital proceedings book.
ISBN 978-1-964867-46-5
Explore this ISBN in the AHFE Bookstore ↗Listed in the July 2026 bookstore catalogue; search by ISBN to confirm current availability · Digital book purchase optional