Yan Li, Daniel A Muñoz, Shunli Yang, Xin Shu, Beibei Pan, Yunge Wang (2025). Comparative Self-Perception Empathy Study in the Design Process. In: Ergonomics In Design and Kansai Engineering. AHFE Open Access, vol. 170, pp. 124–135. https://doi.org/10.54941/ahfe1006174
Empathy, defined by Waal(2008)as the ability to understand a person from their frame of reference rather than one's own, has become relevant in the design exercise. The main objective of this paper is to report a preliminary study that looks into the correlation between designers' self-perception of empathy through self-assessments and the application of empathy on their projects through the analysis of their portfolios. Although there have been studies on the measurement of empathy in the field of psychology by Hodges & Myers (op. cit.), there is little literature on measuring how designers use empathy during the design exercise. The measurement instrument created and used in this paper may help designers and researchers understand the use of empathy in the design exercise. Two methods have been adopted in this study. The first is a quantitative approach was taken implementing Baron-Cohen and Wheelwright (2004), a validated empathy test questionnaire, which has been used widely in clinical psychology. This study uses this test because it offers a holistic view of the empathy dimensions (emotional, cognitive, and associative). The second method is a questionnaire as an instrument created by researchers of this study to evaluate the level of empathetic thinking of the designer on their projects and observe the relationship between self-perception and their empathetic thoughts in the design exercise. This study analyzed an assertive perception of how empathetic designers clinically talk and their behavior in the design exercise. It involved correlational analyses between their clinical score as the independent variable, their self-perception score as the dependent variable, and the influence of two independent variables, clinical score and different background factors like professional field and working years. In the analysis of their clinical and self-perception scores, we obtained the result R= 0.867. It is observed that these two variables have a significant correlation at the 0.01 level. The data suggests a significant and strong relationship between clinical measures and self-perception scores. Using the spline chart analysis to compare clinical scores and profession fields, the result revealed that the top three scores are interaction design, graphic design, and industrial design, and art and CA/animation are the lower ones. In terms of demographics, we found that years of experience and the type of professional background influence empathetic thinking and the results from assessments, with a positive correlation in interaction design and animation and a negative correlation in industrial and graphic design. Moreover, artistic fields often show lower empathy scores than what, potentially reflecting differing demands for empathy in varying design disciplines. The comparison with the field of designers(industrial, graphic, interaction, etc.) and empathy clinical score shows that the most artistic disciplines participants show less empathy score, which may indicate that it doesn’t require the same level of empathy for every discipline in their daily design exercise. This study implies that background factors, such as profession and experience, may significantly impact empathy use in design.
Empathy, as an essential human ability, involves understanding, sharing, and even experiencing the emotional states of others (Cambridge Dictionary, 2019). Psychologically, empathy is defined as comprehending another person’s situation from their perspective, rather than one’s own (American Psychological Association, 2018). De Waal (2008) expands this concept by categorizing empathy into three components: being affected by another’s emotional state, assessing the reasons for that state, and adopting their perspective. Empathy is often distinguished from sympathy, where the former involves deep, sustainable understanding from another’s viewpoint, while the latter reflects transient emotional reactions rooted in one’s own perceptions (Dictionary.com, 2019).
In design, empathy is increasingly recognized as a critical competency, particularly within human-centered and user-oriented design methodologies. These approaches emphasize understanding users’ experiences, identifying their pain points, and addressing their needs through empathetic thinking (Dong et al., 2018; Gibbons, 2018). Empathy enables designers to prioritize
Comparative Self-Perception Empathy Study in the Design Process 125
user needs, foster meaningful connections, and improve design outcomes (Battarbee et al., 2014). Tools such as empathy maps, user journey maps, and participatory design methods have been developed to help designers engage with users’ experiences and perspectives (Sanders & Stappers, 2014).
Empathy is typically measured using psychological tools, such as Baron- Cohen and Wheelwright’s (2004) Empathy Quotient (EQ) test, which evaluates emotional, cognitive, and associative dimensions. Shen (2010) similarly identifies these dimensions as integral to understanding empathy, with emotional empathy involving shared feelings, cognitive empathy focusing on understanding others, and associative empathy relying on personal connections to similar experiences. Self-reflective tools and surveys also provide insight into empathy, especially when tailored to specific contexts, such as the design process (Hodges & Myers, 2007).
Research Opportunity This study investigates the intersection of empathy and design, exploring the potential of design activities to cultivate empathetic thinking and examining correlations between clinical empathy scores and self-perceived empathy in designers. By analyzing preliminary data, this research seeks to expand understanding of empathy as both an innate ability and a professional tool within design practice.
Research Question What is the correlation between clinically assessed empathy (EQ scores) and self-perceived empathy in designers’ reflective design practice?
General and Specific Purposes The objective analyzes and compares the self-perception of empathy of designers in design exercises using tools to compare from psychology, but also using a designed self-perception tool, to explore the correlations, intersections, and differences between self-appearance empathy of designers in their design portfolio.
Know the level of empathy of each participant through validated empathy tests (EQ) from the psychology field.
Obtain the result of self-perception through the organized questions related to the designer’s former portfolios, which can reflect the level of empathetic thinking in the design practice.
Analyze and compare the aspect of empathy to self asses score, but also find some correlations between background factors and the score got from the subjects.
OBJECTIVE This study aims to analyze and compare the self-perception of empathy among designers engaged in design exercises. Utilizing established psychological tools, specifically the Empathy Quotient (EQ) test, alongside a newly developed self-perception instrument, the research explores
correlations, intersections, and differences in empathetic self-assessment as reflected in designers’ portfolios.
The specific objectives are as follows:
1. Assess Empathy Levels: Determine the empathy levels of participants through validated empathy tests drawn from psychological research. 2. Evaluate Self-Perception: Gather insights into designers’ self- perception of empathy through structured questions related to their previous design projects, thereby reflecting their empathetic thinking in practice. 3. Analyze Correlations: Examine and compare self-assessment scores for empathy, while identifying potential correlations between background factors—such as years of experience and design discipline—and the scores obtained by participants.
METHODS
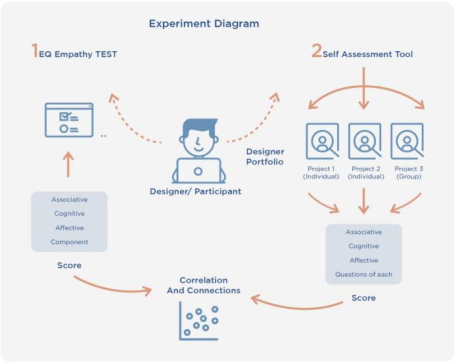
This study employs a mixed-methods approach to investigate the self- perception of empathy among designers in their design exercises. Two primary methods were utilized: a validated Empathy Questionnaire and a custom-designed self-assessment tool.
Empathy Questionnaire The first method involves a validated empathy test, the Empathy Quotient (EQ) questionnaire, developed by Baron-Cohen and Wheelwright (2004). This established tool is recognized for its comprehensive evaluation of empathy, encompassing three dimensions: emotional, cognitive, and associative. The EQ test consists of 60 questions, of which 40 directly pertain to empathy measurement. This holistic perspective makes the EQ a suitable instrument for assessing the empathetic capabilities of participants in this study.
Self-Assessment Tool The second method is a self-assessment perception tool specifically created to measure designers’ empathy during design exercises. While an academic effort was made to locate a pre-existing validated self-perception tool, the decision was made to develop a tailored instrument to better fit the specific context of this research, arising from our academic curiosity.
The self-assessment tool requires participants to select three projects from their portfolios that they believe best represent their design capabilities. A key requirement is that each selected project must involve user interaction. For each project, a series of self-reflective questions were devised to evaluate the designers’ empathetic engagement, aligned with the three dimensions of empathy previously mentioned (Shen, 2010).
Comparative Self-Perception Empathy Study in the Design Process 127
Table 1: The empathy scale suggested by Shen (2010, p. 508), is adapted to create the self-assessment tool.
Table available in the original PDF paper.
Dimensions Items Affective Empathy 1. The character’s emotions are genuine. 2. I experienced the same emotions as the character when watching this message. 3. I was in a similar emotional state as the character when watching this message. 4. I can feel the character’s emotions. Cognitive Empathy 5. I can see the character’s point of view. 6. I recognize the character’s situation. 7. I can understand what the character was going through in the message. 8. The character’s reactions to the situation are understandable. Associative
9. When watching the message, I was fully absorbed.
Empathy
10. I can relate to what the character was going through in the message. 11. I can identify with the situation described in the message. 12. I can identify with the characters in the message.
The self-assessment questions are as follows: Affective Dimension: This dimension assesses emotional connections with users. The questions include:
1. I have been experienced the same feelings that the user, through this project. 2. I have done really good in the project which reflects my design ability. 3. In this project, I reached to feel the same emotional state of the user. 4. I always think positive during group discussions. 5. I tried hard to reach the users’ needs even though they are not reasonable. 6. I felt in this project was useful to communicate with the partners holding different.
Cognitive Dimension: This dimension evaluates understanding users’ needs and reactions. The questions include:
1. When I asked the users, I didn’t listen to them because they don’t understand what they need. 2. I can recognize user suffering points in this project. 3. I can understand the reaction of the users in this project. 4. I feel proud to present my work to people. 5. I found it difficult to understand what stakeholders need in this project. 6. I was always asking questions to the users when I needed it.
Associative Dimension: This dimension assesses the ability to relate to users’ experiences. The questions include:
1. I think communication was the way to understand the problems. 2. I prefer to receive a positive evaluation from users rather than stakeholders. 3. I am always good at predicting what the users need.
Figure 1: The diagram showing the research structure and process hereof.
PILOT TEST This study initially aimed for a total sample size of over 50 participants, recognizing this as significant for robust analysis. Consequently, the pilot test was conducted with a sample of 10 participants, representing 20% of the envisioned total. These participants were designers from diverse fields, ensuring a range of perspectives on empathetic engagement in design practice. The primary objectives of the pilot were to evaluate the developed tools, refine experimental procedures, and determine whether meaningful correlations could be identified between the two applied methodologies.
Scope and Restrictions Due to academic time constraints, the current phase of research is limited to the pilot test; however, the long-term goal is to expand the study to encompass a larger sample of designers across various disciplines, including graphic and industrial design. This broader scope aims to enhance the understanding of empathy as a relevant factor in multiple design contexts. The tools and methodologies developed during this pilot will be made available within this report to facilitate further research by other academic groups interested in exploring empathy in design.
Criteria for Calculating Scores For data analysis, the criteria established by the EQ test, as described by Baron-Cohen and Wheelwright (2004), were utilized as a reference
Comparative Self-Perception Empathy Study in the Design Process 129
framework. The EQ consists of a total of 60 questions, with 40 directly related to empathy measurement, while the remaining questions serve as filler items to mitigate participant focus solely on empathy.
The same scoring criteria were applied to the self-assessment tool developed for this study. Specifically, from the 15 self-assessment questions, questions 2, 4, 6, and 10 were designated as irrelevant to distract participants and minimize the potential for overestimation of their empathetic abilities (Kim et al., 2016). Participants received zero points for these questions. The remaining questions were scored on a four-level system: a top score of two points for the best choice, one point for a middle choice, and zero points for the least favorable options (see Table 2).
Table 2: The score criteria of self-perception test.
Table available in the original PDF paper.
a b c d Strongly Agree Slightly Agree Slightly Disagree Strongly Disagree
For the first and second questions of our study, we employed both interviews and Google Forms as direct data collection tools. After identifying the 10 designers based on predetermined criteria, we instructed them to complete the empathy test and select three representative projects to evaluate their empathetic engagement. Data collection was facilitated using Microsoft Excel, where we calculated a single score based on the reference score chart (see Table 2). The average score across the three selected projects was computed, which served as the final score for our self-perception test. In this analysis, the clinical score is denoted as CS, while the self-perception score is abbreviated as SS.
Upon analyzing the results, we categorized and examined three questions corresponding to each dimension of empathy—associative, cognitive, and affective—across the three portfolio projects. The overall scores for these dimensions were as follows: affective empathy scored 103, cognitive empathy scored 102, and associative empathy scored 116. A comparative analysis of these scores indicates that associative empathy appears to be more
accessible for designers, while cognitive and affective empathy demonstrate similar levels of perception. This suggests that designers may find it easier to connect empathetic situations with users through associative empathy, whereas cognitive and affective dimensions may require a more profound empathetic engagement. It is essential to note that this analysis is based on self-perception, reflecting the designers’ assessments of their empathetic capabilities.
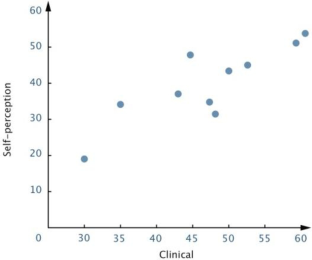
For the third question, we integrated both the clinical results and the self- perception test scores. We utilized SPSS to conduct a Pearson correlation analysis to explore the relationship between these two variables (see Table 3). The results yielded a correlation coefficient of R = 0.867, indicating a significant correlation at the 0.01 level. This finding suggests that our self- perception questions effectively represent the empathy abilities of designers in their design projects, reinforcing the validity of our self-assessment tool.
Table 3: The result of Pearson correlation test between clinical test scores and selfperception scores.
Table available in the original PDF paper.
Correlations Clinical Self_Perception
Clinical Pearson Correlation 1 .867** Sig. (2-tailed) . 001 N 10 10 Self_perception Pearson Correlation .867** 1 Sig. (2-tailed) . 001 N 10 10 **. Correlation is significent at the 0.01 level (2-tailed)
Secondly, we created a scatter plot (see Figure 2) to illustrate individual designer performance. Each participant has developed their empathy through varied experiences since childhood, all sharing a design background post- high school. In our framework, the clinical score (CS) approximates general behavioral empathy, while the self-perception score (SS) reflects perceived empathetic abilities in design. We hypothesized that these two forms of empathy influence each other, treating CS as the independent variable and SS as the dependent variable. This analysis helps elucidate how personal experiences shape empathetic engagement in design contexts.
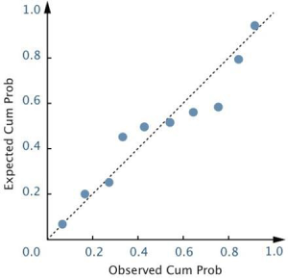
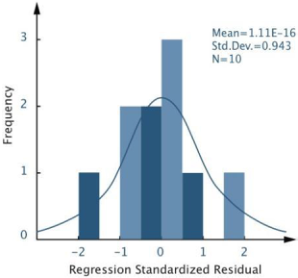
We conducted a regression analysis to generate a normal P-P plot, assessing the standard normal distribution attributes of our data. Despite the limited sample size of 10 pairs of scores, the analysis suggested a near-linear relationship. This indicates variability in designers’ empathetic performance, with some exhibiting stronger empathy while others may suppress their empathetic abilities during design activities (see Figures 3 and 4). Such insights are crucial for understanding the dynamics of empathy in design contexts.
Comparative Self-Perception Empathy Study in the Design Process 131
Figure 2: The scatter plot of two sets of scores, clinical scores (horizontal) and self-perception scores (vertical).Figure 3: The normal P-P plot of regression standardized residual.Figure 4: The histogram of regression standardized residual.
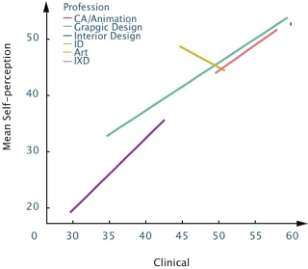
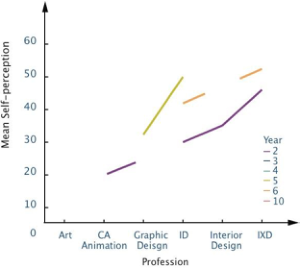
For the third question, we analyzed the influence of two independent variables, clinical score (CS) and professional field, using spline chart analysis. This approach allowed us to compare the intensity and trends of influence stemming from various backgrounds, including years of experience, design discipline, and gender. The results, illustrated in Figures 5 and 6,
indicate that interaction design, graphic design, and industrial design scored the highest, while art and computer animation (CA/animation) received the lowest scores. This analysis highlights the varying impacts of professional backgrounds on empathetic engagement in design.
Figure 5: Comparison with self-perception scores.Figure 6: Comparison with self-perception scores and clinical test scores, differentiated by professions. and professions, differentiated by working years.
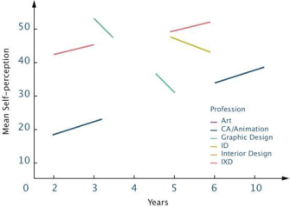
Figure 7 illustrates that designers with extensive experience in interaction design and computer animation (CA/animation) exhibit higher self- perception scores (SS). Conversely, those with fewer years in industrial design and graphic design show elevated SS. This comparison reveals correlations among professional background, years of experience, gender, country, and empathy ability, highlighting the complex interplay of these factors in shaping empathetic engagement in design practice.
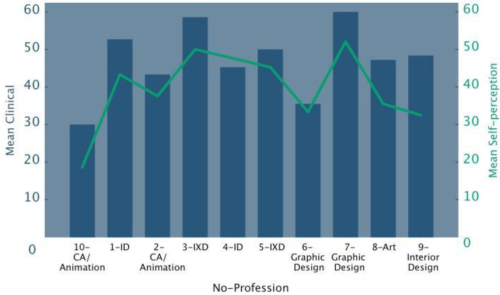
To assess whether designers underestimate or overestimate their empathetic abilities in design activities, we utilized Figure 8, which illustrates the disparity between clinical scores (CS) and self-perception scores (SS) for individual designers. The difference between the column and the polygonal line in the figure represents the gap in empathy perspectives for each designer. CS serves as an objective measure of general empathetic behavior, while SS
Comparative Self-Perception Empathy Study in the Design Process 133
reflects personal perceptions of empathy. If a designer’s SS is lower than their CS, it indicates untapped potential for enhancing empathetic engagement in their design work.
Figure 7: Comparison with self-perception scores and working years, differentiated by professions.Figure 8: Comparison with self-perception scores and clinical test scores in dual axes.
The analysis revealed that all nine designers, with the exception of Designer No. 4, possess significant potential to improve their empathetic performance in the design workspace. This suggests that they may not be fully utilizing their empathetic capacities based on their work experiences.
Furthermore, we compared the average clinical scores of our designer group with a random group. The average score for the random group was 42.1, as referenced by Baron-Cohen and Wheelwright (2004), while our pilot test yielded an average score of 46.9. This comparison indicates that designers, on average, exhibit superior empathetic abilities compared to the general population, suggesting a physiological advantage in empathy among design professionals.
DISCUSSION
The pilot study reveals that background factors and years of experience in design significantly influence empathy abilities among designers. Notably,
an inverse relationship was observed between clinical test scores and years of experience in design, suggesting that increased tenure may correlate with reduced empathy scores. This trend warrants further investigation to understand the underlying reasons for this phenomenon and whether it persists with a larger participant pool. Additionally, the comparison of empathy scores across various design fields—such as industrial, graphic, and interaction design—indicates that participants from more artistic disciplines tend to exhibit lower empathy scores. This finding may reflect the individualistic nature of these fields, which could limit exposure to user- centered empathy training. Consequently, it is essential to explore how different design contexts impact empathetic engagement and whether specific disciplines require distinct empathy training approaches.
The results of the Emotional Quotient (EQ) test suggest that designers, on average, possess higher empathy levels than the general population, as indicated by Baron-Cohen and Wheelwright (2004). Participants demonstrated a strong correlation between clinically assessed empathy (EQ scores) and self-perceived empathy in designers’ reflective design practice, implying a conscious awareness of their empathetic capabilities in design activities. Future research should focus on how these abilities influence design perception and whether altruistic motivations drive empathetic behavior among designers, as proposed by Batson et al. (2002). This study serves as a foundational step in exploring the relationship between design practice and empathy.
Limitations and Future Research While this pilot study offers preliminary insights into empathy dynamics among designers, its findings are limited by the small sample size (N = 10) and the homogeneity of participant backgrounds (e.g., geographic/cultural representation, disciplinary distribution). Future research should involve larger, more diverse cohorts to validate the observed inverse relationship between years of professional experience and empathy scores. Longitudinal studies could further clarify whether this trend reflects a causal effect of design practice or broader socio-professional factors (e.g., workplace demands and burnout). Additionally, cross-disciplinary comparisons— particularly between artistic (e.g., graphic design) and user-centered fields (e.g., interaction design)—could elucidate how disciplinary norms and training influence empathetic capacity.
REFERENCES
American Psychological Association. 2018. Empathy [Online]. Available: https:// dictionary.apa.org/empathy [Accessed 2 Dec 2019]. Baron-Cohen, S. & Wheelwright, S. 2004. The empathy quotient: An investigation
of adults with Asperger syndrome or high functioning autism, and normal sex differences. J Autism Dev Disord, 34, pp. 163–175. Batson, D., Ahmad, N., Lishner, D. & Tsang, J.-A. 2002. Empathy and altruism.
The Oxford Handbook of Positive Psychology, pp. 485–498.
Comparative Self-Perception Empathy Study in the Design Process 135
Battarbee, K., Suri, J. F. & Howard, S. G. 2014. Empathy on the Edge [Online].
IDEO. Available: https://new-ideo-com.s3.amazonaws.com/assets/files/pdfs/news/ Empathy_on_the_Edge.pdf [Accessed 3 Dec 2019]. Cuff, B., Brown, S., Taylor, L. & Howat, D. 2016. Empathy: A Review of the Concept. Emotion Review, 8, pp. 144–153. Dictionary.com. 2019. Empathy vs. Sympathy: Which Word To Use And When [Online]. Available: https://www.dictionary.com/e/empathy-vs-sympathy/ [Accessed 3 Dec 2019]. Dong, Y., Donglong, H. & Yuan, S. 2018. Empathy in Design: A Historical and
Cross-Disciplinary Perspective. Advances in Intelligent Systems and Computing, pp. 295–304. Gibbons, S. 2018. Empathy Mapping: The First Step in Design Thinking [Online].
Available: https://www.nngroup.com/articles/empathy-mapping/ [Accessed 4 Dec 2019]. Hodges, S. & Myers, M. 2007. Empathy. Encyclopedia of Social Psychology.
Thousand Oaks, California: SAGE Publications, Inc. Howard, T. 2014. Journey mapping: a brief overview. Commun. Des. Q. Rev, 2, pp. 10–13. Kim, Y.-H., Kwon, H., Lee, J. & Chiu, C.-Y. 2016. Why Do People Overestimate
or Underestimate Their Abilities? A Cross-Culturally Valid Model of Cognitive and Motivational Processes in Self-Assessment Biases. Journal of Cross-Cultural Psychology, 47, pp. 1201–1216. Kouprie, M. & Sleeswijk Visser, F. 2009. A framework for empathy in design: Stepping into and out of the user’s life. Journal of Engineering Design, 20, pp. 437–448. Lawrence, E. J., Shaw, P., Baker, D., Baron-Cohen, S. & David, A. S. 2004. Measuring
empathy: Reliability and validity of the Empathy Quotient. Psychol Med, 34, pp. 911–9. Sanders, E. B. N. & Stappers, P. J. 2008. Co-creation and the new landscapes of design. CoDesign, 4, pp. 5–18. Sanders, E. B. N. & Stappers, P. J. 2014. Probes, toolkits and prototypes: Three
approaches to making in codesigning. CoDesign, 10, pp. 5–14. Sanders, L. 2009. Exploring co-design on a large scale. Designing for, with and from user experiences. Symposium conducted at the Faculty of Industrial Design Engineering, TU/Delft, Delft, The Netherlands. Shen, L. 2010. On a Scale of State Empathy During Message Processing. Western
Journal of Communication, 74, pp. 504–524. Waal, F. B. M. d. 2008. Putting the Altruism Back into Altruism: The Evolution of Empathy. Annual Review of Psychology, 59, pp. 279–300.
LISTED IN THE AHFE DIGITAL BOOKSTORE CATALOGUE
Explore the complete digital volume
Ergonomics In Design and Kansai Engineering
Read this individual research paper free through the original publisher, or explore the full digital proceedings book.
ISBN 978-1-964867-46-5
Explore this ISBN in the AHFE Bookstore ↗Listed in the July 2026 bookstore catalogue; search by ISBN to confirm current availability · Digital book purchase optional