Yang Cai, Tomas Vancura, Haocheng Zheng, Lenny Weiss (2022). Real-Time Breath Pattern Detection from Helmet. In: Human Factors and Wearable Technologies. AHFE Open Access, vol. 29, pp. 1–9. https://doi.org/10.54941/ahfe1001468
In this paper, we developed a remote breath pattern from a helmet-mounted thermal sensor while providing real-time feedback from the head-up display on the helmet. We use Lucas-Kanade Tracking and the Fast Fourier Transform to estimate and display a subject’s breaths per minute and breathing waveform in an embedded systems environment. In addition to respiration rate (RR), our visualization shows the waveform of the subject’s breathing pattern, which provides real-time diagnostic information. Our system was able to predict respiration rate with high accuracy and stability in all trials of subjects wearing face masks, due to the heat-trapping effect of facial coverings. In the unmasked cases, the error rates are higher than the masked cases, due to the higher signal-to-noise ratio and other causes. In future work, we would like to focus on unmasked RR detection to improve accuracy and robustness with better color mapping from the raw data to pixel colors, improve the tracking accuracy, improve the thermal resolution, apply signal filters, and reduce the sampling region of interest that is more sensitively tracked and centered around the nostrils.
The ability to measure a person’s respiratory rate (RR) or breathing rate easily and reliably is extremely important for attending to patients in emergency response situations. Current methods for measuring breathing rate include visual counting and the use of respiratory belts. However, these methods prove to be impractical in the context of on-the-ground emergency response by firefighters and EMS due to human error and equipment size. Conta- ctless methods for measuring respiratory rate have been developed, but many are also unsuitable for emergency response situations. For example, remote photoplethysmography has been used to estimate respiratory rate, but the sensors involved capture information from light reflected by the human body, making the method unsuitable for the dark environments in which emergency responders may attend to victims. On the other hand, infrared cameras can be used to capture temperature information emitted naturally by the human
body, making respiratory measurement via thermal imaging a possibly sim- ple and robust approach in low-light conditions. This approach has been explored by other researchers in controlled environments, but to the best of our knowledge, it has not been applied to the specific context of emergency response situations (e.g. live sensing and analyzing from the first responder’s helmet).
LITERATURE REVIEW
Remote respiration analysis and estimation through thermography have been a topic of great interest in recent years. In much of the literature, the problem is decomposed into several subproblems in similar ways: first, there is the problem of identifying some region of interest (ROI) on the body (e.g. the area around the nose and mouth) whose temperature fluctuates as the sub- ject breathes; second, there is the problem of tracking this region in space, as the subject moves; and third, there is the problem of extracting and pro- cessing information from this region to accurately and robustly predict the respiration rate of the subject.
Identifying the ROI can be done manually, by selecting a pixel range in the first frame of consideration (Cho et al. 2017). Identification can also be done automatically. For example, automatic identification of the nostril region has been accomplished by segmenting the face using Otsu’s method, considering human anatomy, and applying Canny edge detection (Pereira et al. 2015). Automatic ROI identification can however be difficult in situations where the precise orientation of the face is not known apriori. Furthermore, classical approaches to face detection, such as the Viola-Jones algorithm (Viola and Jones, 2001), often operate under the assumption that the input video is in the visible light spectrum; as has been noted, the low resolution of thermal images and lower facial texture in them can hinder such algorithms (Tran et al. 2021).
Tracking the ROI involves predicting its new position in subsequent fra- mes of the video after it has been initialized. As the subject moves their head, the ROI must cover the same nostril region or be reset in the case that it is completely lost. As seen in the literature, there are a number of ways to go about this. It has been suggested to analyze a number of previous frames to determine the location of the greatest thermal range and update the ROI to this position (Procházka et al. 2017). Cho, et. al. propose a new algorithm called Thermal Gradient Flow, which uses the Median Flow algorithm to track chosen points in the nostril region of the ROI.
Estimating the RR typically amounts to extracting a predominant fre- quency from the sampled time-domain data. Procházka et al. sample the average temperature value in the ROI at each frame of the video, pass the data through a bandpass filter, and extract the BPM from its Discrete Fourier Transform power spectrum. Pereira et al. used similar sampling and filtering techniques but extracted BPM through Bruser et al.’s beat-to-beat detection algorithm.
Real-Time Breath Pattern Detection from a Helmet 3
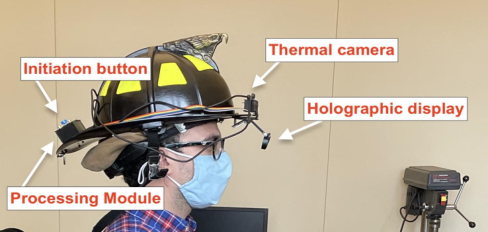
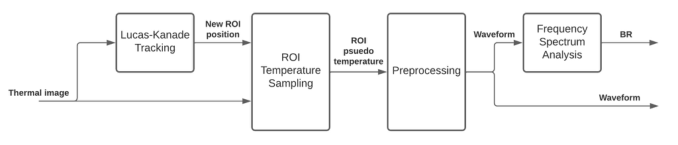
Figure 1: Prototype of the AR Helmet.Figure 2: The respiratory rate detection process.
ARCHITECTURE OF SYSTEM AND PROCESS In designing an approach to these three problems, we considered the com- putational constraints of a real-time, mobile analysis solution. A thermal, grayscale color-mapped video stream is captured by the camera and tran- smitted to the processing board at a frame rate no greater than 9 Hz. Each successive frame is read by the software, which extracts an RR estimate and preprocessed waveform every 1 second. The RR estimate and waveform are overlaid on the thermal video, updated at the same rate, and transmitted to the display. Figure 1 depicts the AR helmet prototype, and Figure 2 illustrates the signal analysis process.
The analysis software keeps track of the approximate position of the face via tracking points and uses this information to update the position of the ROI around the nostrils. The tracking points are initialized using Shi-Tomasi corner detection (Shi, 1994) and updated using the Lucas-Kanade Tracking algorithm (Lucas and Kanade, 1981). With each frame, a new thermographic value is sampled from the thermal image by averaging the color-mapped gray- scale values within the current ROI. The software maintains the time-domain waveform of the last 12.5 seconds of values and discards the oldest sample with each new frame. The waveform is then preprocessed via mean-centering and linear regression. The result is zero-padded for the purpose of sinc inter- polation and the Fast Fourier Transform is taken. The zero padding is chosen to ensure a 0.25 BPM frequency-bin resolution in the interpolated Fsform. Finally, the RR is estimated by choosing the frequency component with the highest energy below the upper limit of human respiratory rate, according to Eq. 1. The analysis software is implemented in C++ and uses the OpenCV library for image processing.
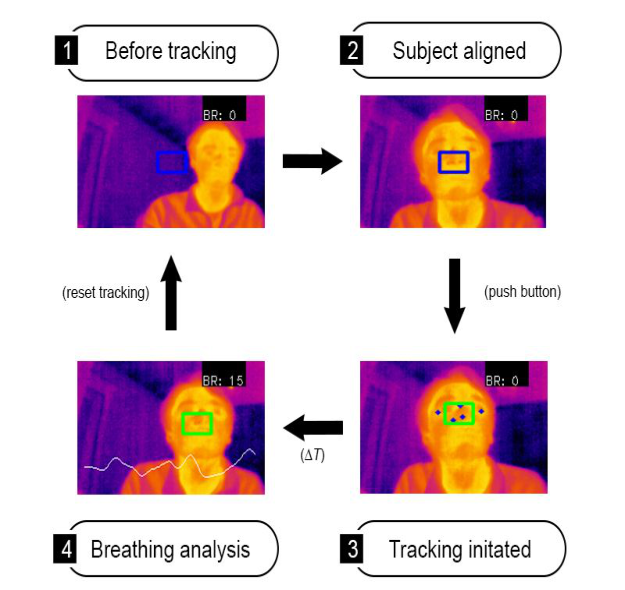
Figure 3: State transition diagram of the tracking and analysis procedure and associa- ted visualizations projected to the display.
NOSIL TRACKING AND EXCEPTION HANDLING Tracking Algorithm
Breathing data are collected as the fluctuating temperature value around the subject’s nostril region. Identification of the nostril region is done manually: the user passes button input to the program when the ROI covers the nose. The moment that tracking is initiated, a larger region that we call the Region of Tracking (ROT) is initialized over an area above the ROI, which inclu- des the subject’s eyes, forehead, and bridge of the nose (see Figure 3). In this way, the ROT encompasses a wider area of the face with more distinct featu- res visible in the thermography. We identify up to 10 of these features using the Shi-Tomasi corner detection algorithm (OpenCV, 2022). Then between each frame, we update the position of these feature-tracking points using the Lucas-Kanade optical flow tracking algorithm (OpenCV, 2022), and we update the position of the ROI by the average displacement of the tracking points.
Exception Handling It is critical to consider the case in which the subject’s nostril region leaves the ROI or the tracking of the ROI is lost. In the case that the subject being
Real-Time Breath Pattern Detection from a Helmet 5
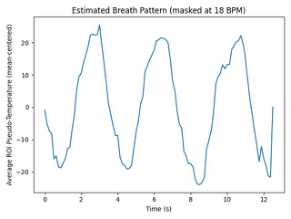
Figure 4: An example sampled waveform with its corresponding frequency decomposition.
tracked leaves the frame of the video, the tracking program automatically resets the ROI position and stops detecting the respiration rate (RR). If the ROI becomes misaligned but is still within the frame, the user can manually reset the tracking process.
SIGNAL PROCESSING FOR BREATHING RATE ESTIMATION For every 12.5-second window of collected data, the data is preproces- sed and analyzed to estimate the breathing rate and generate a breathing pattern waveform. First, the data is detrended using linear regression and mean-centering. Next, the data is zero-padded to interpolate the subsequ- ent periodogram power spectral density estimate to a frequency resolution of 0.25 BPM using the relation between signal length and frequency bin resolution in the DFT (Eq. 1).
ωbin = fs / N (1) The maximum-energy frequency component below 51 BPM is reported as the breathing rate estimate, according to Eq. 2 and as seen in Figure 4.
RR = argmax0<ω<ωc|X(ejω)|2, where ωc = 51 BPM (2) We do not consider preprocessing the sampled signal through a band- pass filter, because doing so can mistake noisy frequency components in the passband region for the respiratory rate in the case that the subject is not bre- athing at all. We must not assume the person being monitored has a normal respiratory rate.
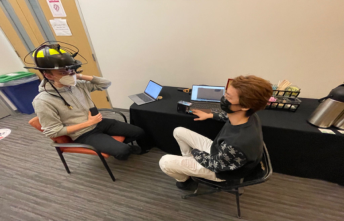
EXPERIMENTAL DESIGN The accuracy of the real-time RR prediction system was evaluated on 6 volun- teer subjects from the Carnegie Mellon University community. Each volunteer was the subject of 6 tests. All tests were performed with a tester who wore and operated the AR helmet sitting across from the subject, as depicted in Figure 5. The subjects were instructed to breathe normally while sitting at distances of 1m, 0.5m, and 0.3m apart from the tester. The subjects were
Figure 5: The lab test environment (left) and the thermographic display on HUD (right).Table 1. Parameters tested for each subject.
Table available in the original PDF paper.
Subject Facial Condition Subject Breathing Rate / Distance Masked Normal / 1m Fast / 1m Slow / 1m Unmasked Normal / 1m Normal / 0.5m Normal / 0.3m
then also instructed to breathe quickly, normally, and slowly while wearing a face mask. The tested parameters for each trial are summarized in Table 1.
We used two measurement methods for estimating a ground truth RR that can be used when access to equipment found in a lab is restricted: pulse oxi- metry that has a Respiratory Rate reading (RR) and manual counting. The subjects wore a pulse oximeter on their finger capable of detecting respira- tory rate, whose readings were sampled every 5 seconds. A second tester also observed the subject and manually counted their breaths during each trial period. Each trial period lasted 75 seconds, with the first 15 seconds rese- rved for calibration of the pulse oximeter and the next 60 seconds for data collection.
TEST RESULTS In exploring the effectiveness of the proposed RR prediction system, we con- sider an accurate prediction to have a low error as compared to the ground truth. It is important to mention that the pulse oximeter used did not report a respiratory rate for one of the six subjects across all 6 trials for that subject, resulting in a total of 30 trials.
Overall, the predicted RR for masked subjects appeared to be more accu- rate than the predicted RR for unmasked subjects. Compared to the real-time pulse oximeter reading, the masked trials showed an average Root Mean Squared Error (RMSE) of 6.01 BPM, while the unmasked trials showed an average RMSE of 11.26 BPM. When compared to the ground truth esti- mate from manual counting, the respective average RMSEs were 1.96 BPM and 11.41 BPM. The average standard deviations of the predicted RR were 1.68 BPM in the masked trials and 9.69 BPM in the unmasked trials. These results are summarized in Table 2. Tables 3 and 4 summarize the results for the masked and unmasked trials when split on instructed respiration rate and distance from the tester, respectively.
Real-Time Breath Pattern Detection from a Helmet 7
Table 2. Average error rate and standard deviation of RR predictions (in BPM) with subject masked and unmasked.
Table available in the original PDF paper.
Unmasked, 45
Unmasked, 0
Equation reproduced from the original PDF.
tilt (N = 15) Avg. MAE (pulse oximeter) 5.36 N/A 8.99 Avg. MAE (manual counting) 1.50 2.78 9.15 MAE SD (manual counting) 0.95 2.40 2.80
Table 3. Average error and standard deviation of RR predictions (in BPM) with subject masked and breathing at different rates.
Table available in the original PDF paper.
Metric Respiration Rate (masked) Normal (N=5) Fast (N=5) Slow (N=5) Avg. MAE (pulse oximeter) 3.12 8.29 4.66 Avg. MAE (manual counting) 1.37 1.40 1.74 MAE SD (manual counting) 0.82 0.67 1.25
Table 4. Average error and standard deviation of RR predictions (in BPM) with subject unmasked and sitting at different distances from the tester.
Table available in the original PDF paper.
Metric Distance (unmasked, 0
tilt) 1m (N=5) 0.5m (N=5) 0.3m (N=5) Avg. MAE (pulse oximeter) 9.75 9.28 7.93 Avg. MAE (manual counting) 9.60 9.54 8.31 MAE SD (manual counting) 2.68 2.30 3.18
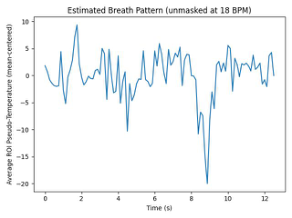
Figure 6 compares two trials, in which the same subject breathed at a manually counted RR of 18 BPM while wearing and not wearing a mask. The waveform from the masked trial shows very clear peaks, almost as though the signal was passed through a low-pass filter. Its associated interpolated Power Spectral Density plot also shows a clear peak at 15.52 BPM, near the ground truth of 18 BPM. The corresponding waveform from the unmasked trial appears to be contaminated by high-frequency noise, as evidenced by its own frequency decomposition.
We found the Signal to Noise Ratios (SNR) in the sampled thermographic signals, which is a colormap of the raw temperature data, is rather noisy, which might contribute to the errors in estimating the breathing rate. It was observed throughout these trials that when a subject wore a face mask, the temperature fluctuations due to their breathing were far more pronounced in the thermography versus when their nostrils were exposed to air, and the heat expelled from the nose dissipated quickly. It appears that a face mask effectively acts as an insulator of the hot air expelled during breathing, and inherently filters and amplifies the temperature signal generated around the nostrils by the subject breathing. This resulted in more accurate and more stable RR estimates within the masked trials compared to the unmasked trials.
Figure 6: Masked trials produced signals with higher SNR, and provided a more confident RR estimate.
Interestingly, we did not observe any difference in the accuracy or stability of the RR estimate when varying distances in the unmasked trials. We expe- cted that the accuracy would increase as the subject was closer to the thermal camera. We assume that the signal is inherently too weak in this situation.
CONCLUSION
In this paper, we developed a remote breath pattern from a helmet-mounted thermal sensor while providing real-time feedback from the head-up display on the helmet. We use Lucas-Kanade Tracking and the Fast Fourier Tran- sform to estimate and display a subject’s breaths per minute and breathing waveform in an embedded systems environment. Our system was able to pre- dict RR with high accuracy and stability in all trials of subjects wearing face masks, due to the heat-trapping effect of facial coverings. In the unmasked cases, the error rates are higher than the masked cases, due to the higher signal-to-noise ratio and other causes. In future work, we would like to focus on unmasked RR detection to improve accuracy and robustness with bet- ter color mapping from the raw data to pixel colors, improve the tracking accuracy, and improve the thermal resolution.
ACKNOWLEDGMENT
This study is in part sponsored by the NIST PSIAP and PSCR program. The authors would like to thank the Program Manager Scott Ledgewood for his support and discussions.
Real-Time Breath Pattern Detection from a Helmet 9
REFERENCES
Brüser, C., Winter, S. and Leonhardt, S. (2013). Robust inter-beat interval estimation in cardiac vibration signals. Physiological Measurement, 34(2), pp. 123–138. Cho, Y., Julier, S.J., Marquardt, N. and Bianchi-Berthouze, N. (2017). Robust
tracking of respiratory rate in high-dynamic range scenes using mobile thermal imaging. Biomedical Optics Express, 8(10), p. 4480. Jianbo Shi and Tomasi (1994). Good features to track. IEEE Xplore. Lucas, B. D. and Kanade, T. An iterative image registration technique with an application to stereo vision. In Proceedings of the 7th International Joint Conference on Artificial Intelligence - Volume 2, IJCAI’81, pp. 674–679, 1981. OpenCV, (2022). The OpenCV library website: https://opencv.org Pereira, C.B., Yu, X., Czaplik, M., Rossaint, R., Blazek, V. and Leonhardt, S.
(2015). Remote monitoring of breathing dynamics using infrared thermography. Biomedical Optics Express, [online] 6(11), pp. 4378–4394. Procházka, A., Charvátová, H., Vyšata, O., Kopal, J. and Chambers, J. (2017). Breathing Analysis Using Thermal and Depth Imaging Camera Video Records. Sensors, 17(6), p.1408. Tran, H., Dong, C., Naghedolfeizi, M. and Zeng, X. (2021). Using cross-examples in
Viola-Jones algorithm for thermal face detection. Proceedings of the 2021 ACM Southeast Conference. Viola, P. and Jones, M. (n.d.). Rapid object detection using a boosted cascade of simple features. Proceedings of the 2001 IEEE Computer Society Conference on Computer Vision and Pattern Recognition. CVPR 2001.
LISTED IN THE AHFE DIGITAL BOOKSTORE CATALOGUE
Explore the complete digital volume
Human Factors and Wearable Technologies
Read this individual research paper free through the original publisher, or explore the full digital proceedings book.
ISBN 978-1-958651-05-6
Explore this ISBN in the AHFE Bookstore ↗Listed in the July 2026 bookstore catalogue; search by ISBN to confirm current availability · Digital book purchase optional