Yang Cai (2024). Episodic Memory with Interactive 3D Sequential Graph. In: Artificial Intelligence and Social Computing. AHFE Open Access, vol. 122, pp. 75–81. https://doi.org/10.54941/ahfe1004643
Episodic memory can be viewed as a learning process, not from existing knowledge, but from massive streams of news and episodic events. Sequences of episodic events can be used to predict future events. In this study, we assume that long-term memory can be simulated with a spatial and temporal database. We explore the 3D sequential graphs that offer a selection of methods to visualize episodic memory in the 3D space, a network of sequences of values, or a statistical summary of information about groups or subsets such as frequencies, ranges, and distributions. The graph can be accessed through a tablet, laptop, and AR/VR headsets. Users can navigate the graph with hand gestures, a game controller, or a mouse. The semantic graph is also connected to multimedia content such as video footage and spatial soundtracks because our episodic memory is multimedia. Finally, the applications of episodic memories are presented, including disastrous scenarios of laparoscopic cholecystectomy and malware distribution networks.
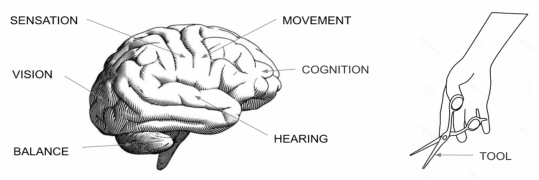
Episodic memory provides access to an event that is experienced personally. This kind of memory is not about regularity, but rather reconstructing par- ticularities about when and where, like in a movie. Episodic memory implies a mental reconstruction of some earlier event, including hunger, hurt, escap- ing from danger, or an emotional reaction. Based on previous experience, we can anticipate specific events in the future. Mental time travel into the future might include the planning of a specific event, such as a food gathering. Many bad dreams experienced today are similar to those of our ancestors. They are indelible rehearsals for survival. In a dynamic world, the capability to predict future situations can provide a selective advantage. Episodic memory can be viewed as a learning process, not from existing knowledge, but from mas- sive streams of news and episodic events. See Figure 1 for a diagram of the learning elements.
Prevailing medical diagnoses are still based on episodic memory. For exam- ple, chest pain often indicates heart disease. Heartburn is usually caused by astrological diseases. Sequences of episodic events can be used to predict
future events. For example, Jail-breaking refers to using the “backdoor,” or working around the software that allows access to the intimate functions of applications that were intended for use by the manufacturers. Jail-breaking emerged from the world of smartphones, video games, and appliances such as Kinect and Roomba (Cai, 2016).
Figure 1: Episodic memory with perception, cognition, and tools.
These episodic events could have served as a form of mental time travel for improving the security of the new electrical car, e.g. the Tesla Model S. How episodic memory is stored and processed in our brain is still a mystery. Here, we assume that long-term memory can be simulated with a spatial and temporal database. At the insect level, long-term memory can be projected to the external “pheromone” map on the ground. Assume those pheromones don’t decay over time. Then the accumulation of the pheromone deposition is straightforward, just add them up like a heat map (Cai, 2016).
In this paper, the author explores the 3D Sequential Graphs that offer a selection of methods to visualize in a 3D space, a network of sequences of values, or a statistical summary of information about groups or subsets (fre- quencies, ranges, distributions). The graph can be accessed through a tablet, laptop, and AR/VR headsets. Users can navigate the graph with hand ges- tures, head-tracking, a game controller, or a mouse. The semantic graph is also connected to multimedia contents such as video footage and spatial soundtracks because our episodic memory is multimedia. Finally, the applica- tions of the episodic memories are presented, including disastrous scenarios of laparoscopic cholecystectomy.
SYSTEM ARCHITECTURE We represent episodic memory as a dynamic directed graph, i.e. a set of objects called vertices or nodes that are connected where all the edges are directed from one node to another. A Force-Directed Graph, or Force-Based Graph, is a visualization layout for a large network, knowledge representa- tion, system management, or complex interactive system (Tucan, 2024). It is a combination of aesthetics and physics. In a visual space, either 2D or 3D, the Force-Directed Graph spreads the nodes evenly to avoid overlapped nodes or “run-away” nodes. The advantage of the Force-Directed Graph is that the layout is based solely on the abstract graph structure rather than domain-specific knowledge. We have used the model for cyber malware infec- tion network analysis and surgical procedure representation. We have gained
Episodic Memory With Interactive 3D Sequential Graph 77
a positive experience from using this representation in the two applications that are vastly different in fields.
To achieve the aesthetic visual layout, a physical model is applied, i.e. the mass-string model. The algorithm moves the nodes around iteratively to come as close as possible to an equilibrium where the position of the nodes remains stable. The algorithm is derived from Hooke’s law, an empirical law that the force (F) needed to expand or compress a spring by some distance (x) scales linearly concerning that distance, F = kx, where k is a constant factor characteristic of the spring or its stiffness. Unfortunately, the computation for the mass-spring model is an NP problem. It works best for graphs where the number of connections between the nodes is similar to the number of the nodes. Denser graphs with many connections or unstructured graphs are computationally expensive. If the directions of the connections are too large, then it would make the problem worse. Algorithmic wise, we use spring forces proportional to the shortest path between the nodes. For extremely large graphs, we would use advanced algorithms such as Simulated Annealing, or divide-and-conquer models.
Another aesthetic feature of our design is to use arcs to represent bi- directional connections between nodes. This makes directions more obvious, compared to two parallel lines between the nodes. The arcs also contain mul- tidimensional information, such as the data type, data flow direction, and resident time.
Our Force-Directed Graph is dynamic that contains a timestamp for each data entry. This enables users to explore the dynamics of the networked data in an animation. In our previous study of the cyber malware infection network, based on 8-month captured data from Google Safe Browser, our visualization algorithm animated the 8-month data in 15 minutes. Through visual exploration, we discovered the longest life span of the malware is about two weeks, which is coincidentally similar to the COVID-19 viral life span in the host’s body.
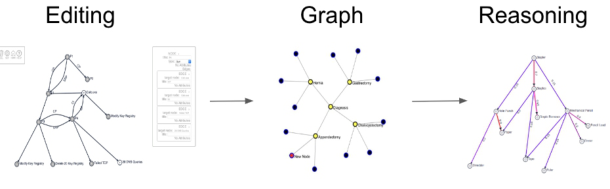
The system is designed to include editing, graphical layout, 3D navigation, and computational reasoning models. The editing module enables users to manually place the nodes on the screen and select the connections to other nodes. It is not efficient for massive data inquiry but it could be useful for some particular cases, such as highlighting some critical spots, moving some nodes around, or deleting some nodes. In general, the sequential data is formatted in a spreadsheet with timestamps, node names, connections, and attributes.
The computational reasoning models are included in the system to enable machine learning or the so-called AI approach. A typical machine learn- ing system ignores data visualization for humans. In this study, we do the opposite: let humans explore the data first and then interact with simple but explainable machine learning algorithms, such as Decision Tree and Associate Rule Learning. Decision Tree model has been widely used in classification, clustering, and pattern recognition. It’s a graph-based learning algorithm (Amor, 2004) that works well with the Force-Directed Graph. Associated Rule Learning is also a graph-based learning model that is classic and explain- able. Amazon uses this model to discover rules about consumer behaviours,
78 Cai
for example, if a customer buys a left shoe, then the customer surely would buy the right shoe. Figure 2 shows the basic architecture of the three modules: editing, graph, and reasoning.
Figure 2: Interactive sequential graph.
INTERACTION DESIGN Visual data exploration is an interaction process. In many cases, users don’t explore the medical procedures alone. They work with colleagues on pre- surgery planning, real-time decision-making, and post-mortal reviews, even though remote terminals sometimes. In light of this, we design the user experience in a data-sharing and interactive environment.
To avoid congestion of the graph on a small laptop screen, we developed a 3D representation of the Force-Directed Graph model. To navigate through the 3D space, we designed multiple user interfaces, including keyboard “hot keys” and a mouse for navigation. We mapped the basic navigation functions to popular game controllers, for example, the joystick for controlling the rotation, and the directional buttons for translation. A regular keyboard is still necessary for typing keywords in the search function. Users prefer to use the physical keyboard rather than a virtual one.
Visual data exploration is also an innovation process. After we consulted with surgeons, we developed new interfaces for improving user experience. For example, we add the “elevator” keys to move the 3D model up or down rapidly to save the user’s time to navigate to the interested spot. We also developed a text rotation algorithm to enable the text in the 3D model to always face the user, not backward. The text also needs to be shortened and has an opaque background to avoid visual congestion or confusion.
Multimodal interaction is necessary for medical episodic memory repre- sentation. For example, connecting the procedure step to a related video clip, or vice versa. The two-way connection would speed up the learning process between the user who would use both sides of the brain. Ideally, we would integrate more simulation modules into the training systems so that the users can fully take advantage of their perceptual capacities.
Animation is another wonderful visualization tool for learning because episodic memory is dynamic. At the individual case level, the durations of a single step vary from one to another. Animation of each case would help the user to observe the procedure time. At the global scale, the average dura- tions of the procedure steps would give users a rough guidance about timing,
Episodic Memory With Interactive 3D Sequential Graph 79
which is normal, and which is abnormal. In a historical sense, animation can show the dynamics of the changing procedures, which ones stayed briefly and then disappeared; which ones stayed for a long time; and which ones are newcomers.
Headsets are tested in two types: Google Cardboard-like headset and the VR game headset. Both provide an immersive visualization experience. How- ever, the face-to-face interaction is missing. Furthermore, they need additional design for the navigation interface, e.g. hand tracking, or a virtual keyboard.
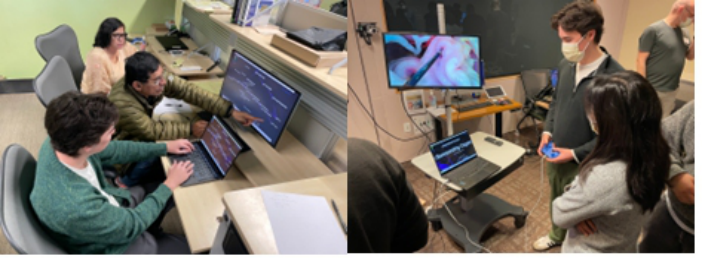
EXPERIMENTAL RESULTS Our current system contains 150 nodes in the laparoscopic surgery proce- dures in cholecystectomy. It takes a few seconds to load the data to the graph. We tested the prototype at Stanford University’s Goodman Surgical Educa- tion. The hands-on demo was set up on a laptop with a monitor and a game controller. About 20–25 medical students and residents attended the event. Over eight participants returned the survey. Most of them gave a score of 5 out of 5 for the demo. They liked the game controller for navigation because that reminded them of their video game experience. Medical students often prefer interactive learning tools and they want to learn realistic and disastrous scenarios.
Two laparoscopic surgeons reviewed the system and provided detailed suggestions. For example, adding the starting point for navigation, explain- ing the medical terms on demand, improving the navigation interfaces, and adding more procedures for pre-operative, interoperative, and post-operative steps so that the users can see a whole picture of the surgical scenarios. According to the surgeons, episodic memory-based training should start with disastrous scenarios.
Figure 3: The two laparoscopic surgeons walked through the cholecystectomy scenar- ios at the author’s lab (left) and the interactive demo event at Stanford’s Goodman Surgical Education Centre with medical students and residents (right).
CONCLUSION
In this study, we explore episodic memory in a 3D interactive sequential graph. The prototype is implemented in a dynamic Force-Directed Graph and 3D navigation and video media interfaces. Visual data exploration is an
80 Cai
interaction process. In many cases, users don’t explore the medical proce- dures alone. They do pre-surgery planning, real-time decision-making, and post-mortem reviews with colleagues, sometimes, even with remote termi- nals. In light of this, we design the user experience in a data-sharing and interactive environment. To avoid congestion of the graph on a small lap- top screen, we developed a 3D representation of the Force-Directed Graph model.
The preliminary experiment results show that the medical students like the game controller for exploring the 3D representation of medical procedures and related video media. They also want to explore more disastrous scenarios realistically and productively.
ACKNOWLEDGMENT
The author would like to thank the support of the Northrop Grumman Cor- poration, AFRL, Rolls-and-Royce, Wellcome Leap SAVE Program, and the NIST PSCR Program. The author would like to thank the laparoscopic sur- geons Dr. Jose Luis Mosso Vazquez and Dr. Veronica Lara Vaca for their on-site visit and clinical knowledge. The author acknowledges the significant contributions of the Research Assistants from Carnegie Mellon University and UC San Diego for the implementation of the prototypes, including Jack- son Loughney from UCSD. Thanks to Alexandra Poltorak for her review and editing.
REFERENCES
Amor, N. B., Benferhat, S., and Elouedi, Z. (2004). Naive Bayes vs decision trees in intrusion detection systems. In Proc. 2004 ACM Symp. on Applied Computing. pp. 420–424, 2004. Beattie, K. L., Hill, A., Horswill, M. S. et al. (2021). Laparoscopic skills training: the
effects of viewing mode (2D vs. 3D) on skill acquisition and transfer. Surg Endosc 35, 4332–4344 (2021). https://doi.org/10.1007/s00464-020-07923-8. Cai, Y. (2016). Instinctive Computing, Springer-London, 2016. Clegg, J. Dawson, J. Porter, S. Barley, M. (2005). The Use of a Genetic Algorithm to Optimize the Functional Form of a Multi-dimensional Polynomial Fit to Experi mental Data. 2005 IEEE Congress on Evolutionary Computation, IEEE CEC 2005. Proceedings. 1. 928–934 Vol. 1. 10.1109/CEC.2005.1554782. Chung, J. Y. and Sackier, J. M. (1998) A method of objectively evaluating improve-
ments in laparoscopic skills,” Surgical Endoscopy, vol. 12, no. 9, pp. 1111–1116, 1998. Du, C., Li, J., Zhang, B. et al. (2022) Intraoperative navigation system with a multimodality fusion of 3D virtual model and laparoscopic real-time images in laparoscopic pancreatic surgery: a preclinical study. BMC Surg 22, 139 (2022). https://doi.org/10.1186/s12893-022-01585-0 Jijo, B. and Abdulazeez, M. A. (2021). Classification Based on Decision Tree Algo-
rithm for Machine Learning. Journal of Applied Science and Technology Trends. 2. 20–28. Kohavi, R., and John, G. (1998). The wrapper approach. In Motoda, H., and Liu, H.
(eds.), Feature Extraction, Construction and Selection: A Data Mining Perspective. Kluwer Academic Publishers, July 1998.
Episodic Memory With Interactive 3D Sequential Graph 81
Kohavi, Ron & John, George. (1995). Automatic Parameter Selection by Minimizing Estimated Error. In Proc. Machine Learning (ICML-95), 1995. 304–312. LeFlohic, J. (1999). Genetic Algorithms Tutorial, https://www-cs-students. stanford.edu/∼jl/Essays/ga.html, 1999 Lin, C. J. Chen, H. J. (2013). The Investigation of Laparoscopic Instrument Move-
ment Control and Learning Effect, BioMed Research International, vol. 2013, Article ID 349825, 16 pages, 2013. https://doi.org/10.1155/2013/349825 Matern, U. Koneczny, S. Tedeus, M. Dietz, K. and Buess, G. (2005) Ergonomic testing of two different types of handles via virtual reality simulation, Surgical Endoscopy and Other Interventional Techniques, vol. 19, no. 8, pp. 1147–1150, 2005. Morales, J. A. (2021). Code-Injection Techniques. June. 2021, Word Document. Quinlan, J. (1986). Induction of Decision Trees. Machine Learning 1, Kluwer
Academic Press, 1986. Toucan (2024). Force Directed Graph - What is it? https://www.toucantoco.com/e n/glossary/force-directed-graph.html#:~:text=A%20Force%2DDirected%20Gra ph%2C%20or,between%20objects%20in%20a%20network. Wickens, C. D. (1999). Frames of reference for navigation, in Attention and Per-
formance XVII: Cognitive Regulation of Performance, Interaction of Theory and Application, D. Gopher and A. Koriat, Eds., pp. 113–144, The MIT Press, Cambridge, Mass, USA, 1999.
LISTED IN THE AHFE DIGITAL BOOKSTORE CATALOGUE
Explore the complete digital volume
Artificial Intelligence and Social Computing
Read this individual research paper free through the original publisher, or explore the full digital proceedings book.
ISBN 978-1-958651-98-8
Explore this ISBN in the AHFE Bookstore ↗Listed in the July 2026 bookstore catalogue; search by ISBN to confirm current availability · Digital book purchase optional