Konur Tholl, Mariam El Mezouar, Ranwa Al Mallah (2026). CybORGView: An Interactive Interface for Visualizing Reinforcement Learning Agent Performance in Autonomous Cyber Operations. In: Human Interaction and Emerging Technologies (IHIET-AI 2026): Artificial Intelligence and Future Applications. AHFE Open Access, vol. 201, pp. 251–260. https://doi.org/10.54941/ahfe1007178
Autonomous Cyber Operations (ACO) increasingly leverage Reinforcement Learning (RL) to train agents capable of making effective decisions, where success is measured through a scalar reward signal. However, reliance on rewards alone obscure agent behavior, which directly hinders development efficiency and reduces confidence in operational deployment. In this paper, we present CybORGView, the first visualization tool for ACO to our knowledge that provides full visibility to an agent's performance beyond abstract reward signals. CybORGView allows ACO practitioners to analyze action distributions, red activity, and policy convergence across entire training iterations in a concise, graphical format. Through our intuitive interface, developers can easily tune ACO agents, lowering the barrier of technical expertise required. This visibility facilitates more reliable agent development and evaluation, advancing the path toward practical ACO deployment.
The extent to which offensive cyber operations have increased in recent years is substantial, making manual defence strategies infeasible (Chakraborty, 2013). This growth has driven the development of automated tools to assist in intrusion detection and response. Traditional machine learning approaches have shown promise by enabling models to identify patterns in malicious behaviour without relying on predefined signatures; however, these methods require continuously updated datasets to remain effective and relevant in the rapidly evolving cyber threat landscape.
To address these issues, researchers have turned to Reinforcement Learning (RL) for Autonomous Cyber Operations (ACO). RL enables agents to learn through direct interaction with an environment, removing the dependency
on datasets that have to be manually maintained (Sutton & Barto, 2014). For RL to be feasible in ACO, an environment must exist that mimics cybersecurity operations and produces the necessary signals to train agents. The CybORG environment does exactly this, modelling a realistic enterprise network while generating the training signals required for an agent to learn an effective defence strategy (Baillie et al., 2020).
Despite the potential of incorporating RL into ACO, the effectiveness of the RL agents’ training is abstracted away by a scalar reward signal. While useful for optimization, this signal provides little insight into the agent’s underlying behaviour. This lack of transparency slows debugging, hinders development, and limits stakeholder confidence – factors that impede the deployment of RL in operational cybersecurity settings. Moreover, effective development and testing of these agents currently require extensive expertise in both the RL algorithms and the underlying environment, restricting accessibility to domain experts.
To address these challenges, we present CybORGView, a web-based visualization interface for analysing RL agent training behaviour in ACO environments. CybORGView bridges the gap between reward-based evaluation and understanding by providing interactive, cyber-specific visualizations that improve the explainability and transparency of RL training. In particular, the key contributions of this work are:
Multi-Level Analysis: A tiered framework that supports inspection at three granularities: entire training runs, episodic-level behaviour, and per-timestep decisions.
Accessible Interface: An intuitive web platform that enables users (including those without RL expertise) to configure training runs, deploy agents and analyse results in ACO environments.
Behaviour-Focused Visualizations: Tailored visualizations that reveal agent actions, state transitions, and decision patterns, allowing users to interpret and debug RL behaviour directly.
By providing insights into an agent’s underlying behaviour, CybORGView supports more effective development, debugging and evaluation of RL integration in the ACO field. This is a key step towards adopting RL as a viable means of achieving ACO in operational settings.
To support reproducibility and further research, the full implementation of CybORGView is available at: https://github.com/Poly-AIvsAI/CybORGView.
BACKGROUND AND RELATED WORK Autonomous Cyber Operations and Reinforcement Learning
ACO is an emerging field where agents are trained to autonomously defend IT systems with minimal supervision (Baillie et al., 2020). The purpose of ACO is not to replace human operators, but to work alongside them to enhance the effectiveness and scalability of cybersecurity. Current ACO applications use RL, an ML paradigm where agents learn through direct interaction with an environment (Sutton & Barto, 2014). This requires an environment that
CybORGView: An Interactive Interface for Visualizing Reinforcement Learning Agent 253 mimics realistic cybersecurity conditions and generates the necessary signals for agents to learn effective defence strategies. The Technical Cooperation Program (TTCP) has created such an environment, CybORG’s Cage Challenge 2, which is an RL environment designed to train agents to defend a realistic, simulated network (Baillie et al., 2020; Mitchell et al., 2022).
The training signals provided by CybORG are scalar rewards that indicate how favorable an action was for a particular state. Prior work in ACO focuses on algorithmic optimization against these reward signals, but typically does not emphasize visibility into the training process (Mcdonald et al., 2024; Li et al., 2023; Palmer et al., 2024; Wiebe et al., 2023). To obtain more meaningful metrics, technical familiarity of CybORG’s codebase is required to extract the necessary information – a task not feasible for the majority of users.
Explainability and Visualization in Reinforcement Learning Implementing visualizations into RL is not novel in itself, and there are many tools to support this (Biewald, 2020). These tools show metrics such as rewards over time; however, these metrics lack semantic meaning – they do not demonstrate why the agent chose a particular action. Furthermore, these tools are generic and not tailored to a specific domain such as cybersecurity.
A separate line of work focuses on enhancing the overall explainability and interpretability of AI systems. Methods such as Local Interpretable Model-agnostic Explanations (LIME) allow researchers to assess which features contribute most to an agent’s decision, but these approaches typically require considerable technical familiarity with the configuration of both the environment and the agent (Ribeiro et al., 2016).
Recent research explores how Large Language Models (LLMs) can be used in the cybersecurity domain to generate textual explanations for the RL agent behaviour (Loevenich et al., 2024; Tarek & Kostakos, 2023). Although a promising direction, an LLM’s explanation is inherently inferential; it provides an interpretation of the agent’s behaviour rather than ground- truth evidence of what occurred during training. These methods also lack statistical insight, as the outputs of LLMs are textual and do not reveal training patterns such as action distributions, policy convergence, or learning dynamics between agents.
Motivation for CybORGView Most work in the ACO field focuses on algorithmic optimizations aimed at maximizing an abstract reward signal, yet provides little visibility into the agent’s actual behaviour. Existing RL visualization tools are used primarily to graph generic metrics and are not tailored to cybersecurity environments. LLMs have been employed to help users understand why RL agents select certain actions; however, this reasoning is inferred by the LLM and does not necessarily reflect ground truth.
CybORGView addresses this gap between reward-based learning and operational understanding by providing a visualization platform tailored
to ACO environments. It offers an interface to easily train agents, generate interactive analysis plots, and perform per-timestep inspection. This allows users to examine agent behaviour directly, improving the development, debugging, and deployment of RL agents in ACO.
SYSTEM ARCHITECTURE Overview
This section describes the implementation details of CybORGView, a Django- based web application (Django Software Foundation, 2024). It is designed to provide a comprehensive, intuitive visualization of the entire training cycle for RL agents in ACO. Specifically, CybORGView uses a train-store-visualize process, where:
1. The user selects parameters and initiates an agent’s training through an intuitive interface; and 2. The Django backend runs a training run using the selected parameters; and 3. The results from the training run are stored in a SQL database; and 4. The stored results can be retrieved for visualization and analysis.
Training Interface CybORGView provides a configurable training interface, where parameters can be directly set in a GUI, enabling users to initiate training directly from the application without modifying any underlying code. These parameters are sent to the Django backend, where they are validated and used to initiate a CybORG training script. This script executes the entire training sequence for the selected RL agent and returns data relevant to analysis, including:
The episodic and per-timestep rewards; and
The blue and red agent actions at each timestep; and
The blue agent’s perceived state of the network at each timestep; and
The true state of the network at each timestep.
The interface is intentionally designed to expose only high-level parameters (number of episodes, timesteps, and batch size). The optimal values for low-level hyperparameters such as learning rate and policy clips are non- trivial and can easily degrade training. As such, these remain fixed within the implementation to ensure training stability and prevent configuration choices that negatively impact training.
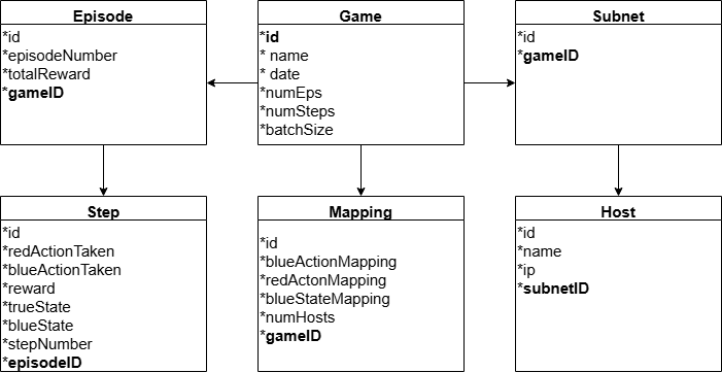
Data Storage Once the training is complete and all data has been returned, it is stored in a SQLite3 database for subsequent visualization and analysis (Python Software Foundation, 2024). The database schema consists of six interlinked tables, which include:
Game: Contains high-level data associated with each run; and
Episode: Contains the episodes and links them to a particular game; and
Step: Contains all data associated with individual timesteps and links them to an episode; and
Subnet: Stores the network’s subnets and links them to a game; and
Host: Contains the hosts within a subnet – each entry is linked to a subnet; and
Mapping: Maps the textual states and actions to their respective numerical representations for each game. This could also be achieved by having a separate action and state table.
Figure 1: Database schema for CybORGView.
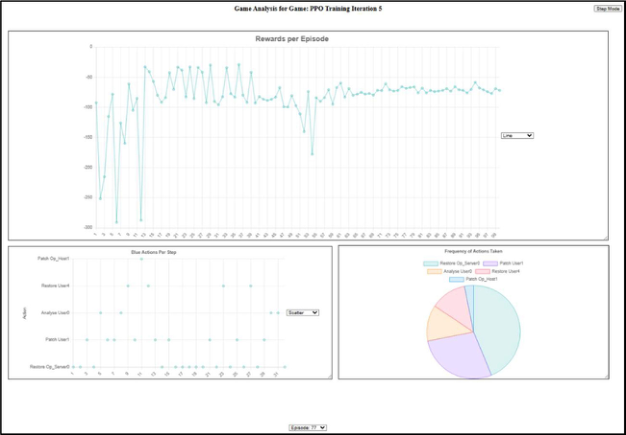
Visualization Interface CybORGView includes a visualization component that retrieves information for a particular game to be analysed. All information is serialized using Pickle and passed to the Django template, allowing pages to be dynamically generated based on the selected game. There are two primary analysis components within the visualization interface: a high-level overview and a per-timestep analysis. The high-level component includes three plots generated using Chart.js (Downie, 2024):
Episodic reward plot. Using the total rewards received in a run, different visualization types can be created (line, bar, radar, doughnut, polar area, bubble, scatter, and pie charts). These options are dynamically chosen by the user, while the backend sends the data associated with the selected training run. This view is primarily to identify instability or convergence issues.
Action-sequence plot. The sequential actions taken by the blue agent throughout an episode are plotted, where the user has the same choice of visualization types as above. The plotted actions are dynamically generated based on the episode number chosen by the user. This view
supports detection of repetitive behaviours that are not visible through rewards alone.
Action-frequency plot. A pie chart is used exclusively for visualizing the frequency of blue actions in an episode as it provides the clearest representation of this distribution. Similar to the above, this chart is dynamically generated with the data sent by the backend depending on the episode the user selected. This view is effective for detecting action imbalance and collapsed policies.
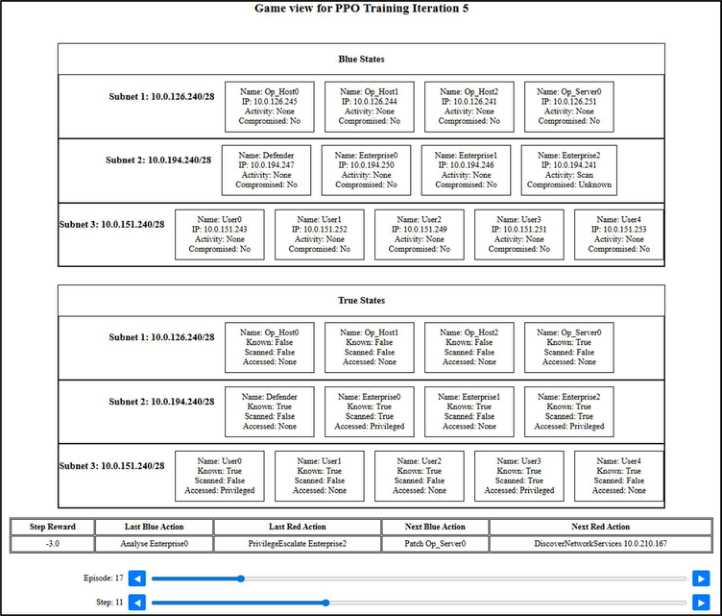
For more fine-grained analysis, CybORGView supports per-timestep analysis. For this, the backend sends various streams of data for the selected timestep, including: the red agent’s previous and next actions, the blue agent’s previous and next actions, the reward for the step, the blue agent’s observation space, and the red agent’s observation space. The frontend dynamically transforms this information into clear, host-based diagrams, enabling users to inspect any timestep within any episode.
SYSTEM USAGE Unlike the previous section, which focused on how CybORGView was implemented, this section discusses how users interact with the application to improve interpretability and explainability in RL training for ACO.
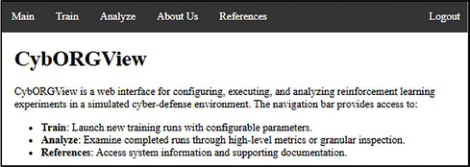
Overview Upon opening CybORGView, users are presented with a minimal interface that supports two primary capabilities: launching new training runs with configurable parameters and analysing previously completed runs. Figure 2 presents the main landing page, where users have direct access to training, analysis and documentation through the top navigation bar.
Figure 2: Landing page for CybORGView.
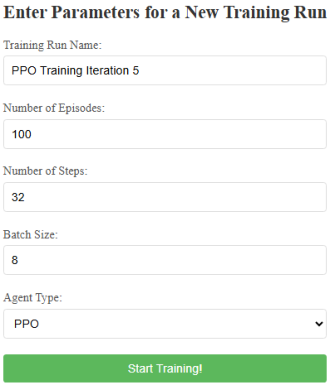
Training Interface Users can initiate new training runs using the training interface. They are presented with an intuitive GUI where they can select the training name, the number of episodes, the number of steps, batch size, and the type of agent they wish to train. Figure 3 shows the GUI that allows users to launch a new training run.
Figure 3: Training interface for CybORGView.
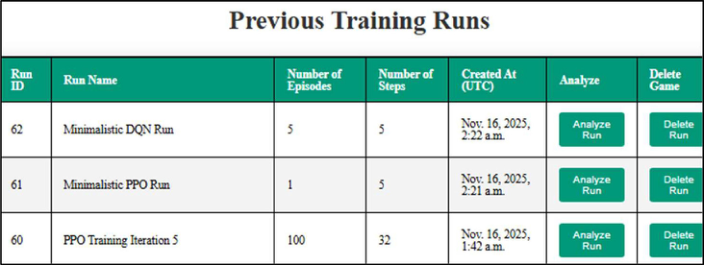
Visualization Interface Once training is complete, users can visualize the results of previously completed runs that have been stored in the database by opening the “View Past Games” page, which presents all previously completed training runs along with key parameters, as shown in Figure 4.
Figure 4: Selecting previously completed training runs.
After a user has selected a run, they are presented with three plots that depict a high-level analysis as shown in Figure 5:
A plot showing the rewards per episode, where the type of graph can be configured; and
A plot showing the blue agent’s actions per timestep for an episode, where both the graph type and episode to analyse can be configured; and
A pie chart showing the frequency of actions taken by the blue agent, where the episode to analyse can be configured.
Figure 5: High-level analysis of a training run. While individual text is small, this figure demonstrates the three plots that compose the high-level analysis.Figure 6: Per time-step analysis of a training run.
CybORGView: An Interactive Interface for Visualizing Reinforcement Learning Agent 259 Users can also perform a deeper inspection at a per-timestep level, where the blue agent’s perceived state of the network, the true state of the network, the red agent’s actions, and the blue agent’s actions can all be observed. Upon selecting Step Mode, two diagrams are dynamically generated, showing each host’s state for the blue agent’s perceived observation space and the true state of the network, respectively. Users can adjust parameters and inspect the details for any timestep in any episode (see Figure 6).
CONCLUSION
Previous applications of RL in ACO have focused on optimizing agents against a reward signal that abstracts away the underlying behaviour. This lack of visibility hinders development efficiency and reduces stakeholders’ confidence in deploying these agents in operational settings.
Contributions CybORGView addresses the inherent issues with current RL applications in ACO by providing a visualization platform where agents’ training can be analysed from start to finish, beyond an opaque reward signal. This visibility enables developers to quickly diagnose inefficiencies, improving the development pipeline and significantly enhancing transparency into the agent’s underlying training behaviour, thereby increasing confidence in operational settings. Additionally, by exposing training through an intuitive GUI, CybORGView lowers the technical requirements needed to deploy and analyse RL agents in ACO.
Limitations and Future Work While CybORGView contributes to the ACO field, there are several limitations to consider:
It currently supports only post-training analysis – users must train an agent entirely before analysing its behaviour.
Only the CybORG environment is used for testing. Given the modular architecture of CybORGView, it can be easily integrated with any environment that uses standard RL metrics; however, this was not done in this study.
Currently, CybORGView only supports two RL algorithms: PPO and DQN.
CybORGView’s focus is on non-experts – there is no capability for technical users to deeply inspect the agent’s internal policy behaviour (e.g., analysing the loss function).
Future extensions of CybORGView should introduce live analysis of training, out-of-the-box multi-environment and multi-agent support, and a separate view for more technical users, enabling them to analyse internal
policy behaviour. Overall, CybORGView transforms abstract scalar reward signals used in previous work into an intuitive end-to-end visualization pipeline, marking a key step towards the development of transparent, deployable RL agents in ACO.
REFERENCES
Ali, T., Kostakos, P. (2023). “HuntGPT: Integrating Machine Learning-Based Anomaly Detection and Explainable AI with Large Language Models (LLMs).” arXiv preprint arXiv:2309.16021. Baillie, C., Standen, M., Schwartz, J., Docking, M., Bowman, D., Kim, J. (2020).
“CybORG: An Autonomous Cyber Operations Research Gym.” arXiv preprint arXiv:2002.10667. Biewald, L. (2020). “Experiment Tracking with Weights and Biases.” Website: https:// www.wandb.com/. Chakraborty, N. (2013). “Intrusion Detection System and Intrusion Prevention
System: A Comparative Study.” International Journal of Computing and Business Research, Volume 4 No. 2. Django Software Foundation. (2024). “Django.” Website: https://www.djangoproject.
com/. Downie, N. (2024). “Chart.js.” Website: https://www.chartjs.org/. Kiely, M., Bowman, D., Standen, M., Moir, C. (n.d.). “Cage Challenge 2.” Website: https://github.com/cage-challenge/cage-challenge-2. Li, L., El Rami, J.-P.S., Kerr, R., Taylor, A., Vandenberghe, G. (2023). “Towards
Autonomous Cyber Operation Agents: Exploring the Red Case.” arXiv preprint arXiv:2309.02247. Loevenich, J.F., Adler, E., Mercier, R., Velazquez, A., Lopes, R.R.F. (2024). “Design of an Autonomous Cyber Defence Agent using Hybrid AI Models.” In 2024 International Conference on Military Communication and Information Systems (ICMCIS), pp. 1–10. McDonald, G., Li, L., Al Mallah, R. (2024). “Finding the Optimal Security Policies
for Autonomous Cyber Operations With Competitive Reinforcement Learning.” IEEE Access, Volume 12, pp. 120292–120305. Palmer, G., Parry, C., Harrold, D.J.B., Willis, C. (2024). “Deep Reinforcement Learning for Autonomous Cyber Operations: A Survey.” arXiv preprint arXiv:2310.07745. Python Software Foundation. (n.d.). “sqlite3 — DB-API 2.0 Interface for SQLite
Databases.” Website: https://docs.python.org/3/library/sqlite3.html. Ribeiro, M.T., Singh, S., Guestrin, C. (2016). “Why Should I Trust You?: Explaining the Predictions of Any Classifier.” arXiv preprint arXiv:1602.04938. Sutton, R.S., Barto, A.G. (2014). Reinforcement Learning: An Introduction (2nd
ed.). Cambridge, MA: MIT Press. Wiebe, J., Al Mallah, R., Li, L. (2023). “Learning Cyber Defence Tactics from Scratch with Multi-Agent Reinforcement Learning.” arXiv preprint arXiv:2310.05939.
LISTED IN THE AHFE DIGITAL BOOKSTORE CATALOGUE
Explore the complete digital volume
Human Interaction and Emerging Technologies (IHIET-AI 2026): Artificial Intelligence and Future Applications
Read this individual research paper free through the original publisher, or explore the full digital proceedings book.
ISBN 978-1-964867-77-9
Explore this ISBN in the AHFE Bookstore ↗Listed in the July 2026 bookstore catalogue; search by ISBN to confirm current availability · Digital book purchase optional