Ephina Thendral Surendranath (2024). Explainable Hybrid Machine Learning Technique for Healthcare Service Utilization. In: Healthcare and Medical Devices. AHFE Open Access, vol. 130, pp. 55–64. https://doi.org/10.54941/ahfe1004837
In the era of data, predictive and prescriptive analytics in healthcare is enabled by machine learning (ML) algorithms. The varied healthcare entities pose challenges in the inclusion of ML predictive models in the rule-based claims processing system. The hybrid ML algorithm proposed in this research article is for handling huge volumes of data in predicting a member’s utilization of Medicaid home healthcare service. The member’s demographic features, health details and enrolment details are generally considered for building the utilization model though health details may not be available for new members. It is also a widely accepted fact that health outcomes are driven also by social and environmental features, furthermore, the analysis of Medicaid home healthcare service data proved the same. Hence various social temporal features such as their living place, federal poverty level, etc., are also considered for predicting the member expenditure in Medicaid home healthcare services. The home healthcare service utilization model predicts the member expenditure in home healthcare services in the subsequent years with the ability to peer group members in a home healthcare service considering the member demographics, their morbidities, and the socio-temporal features. In the home healthcare services utilization prediction modelling, the methodology of segmenting the input features using a clustering algorithm provides labels for the classification algorithm contributing to the accuracy of predicting the member expenditure. The clique clustering algorithm used in the model training phase discovers the similarities in member characteristics and provides labels for the extreme gradient boosting tree classifier. The best curve fitting function for each class is chosen either as linear or logarithmic or exponential or Gaussian in the training phase. The proposed hybridization of Clique clustering, Extreme Gradient Boost Tree classification, and Curve fitting algorithms address the lean availability of member information during enrolment for determining the member utilization of home healthcare services by their expenditure. The proposed hybrid home healthcare service utilization model, ‘Auto-labelled Boosted Regressor’ (ALBR), achieved an AUROC of 0.98 and an AUPRC of 0.90. The complexity of the hybrid ML model, ALBR, necessitated that the decisions and actions of the ML model is explainable to healthcare decision/policy makers. Post-hoc explainable ML methods approximate the behaviour of the complex ML technique using ALBR model as a black box by extracting relationships between sub-spaces of the feature values and the predictions. The home healthcare services utilization model is explained across frequent as well as the infrequent sub-spaces of the feature values using the extrapolated Medicaid home healthcare services data. The comparison of the relationship of the sub-spaces in the categorical features such as living facility, disability, and gender with the utilization for the training data and validation data shows similarity. Conclusively, the main contributions of this work are listed as follows:i.Formulate ML technique for increasing the effectiveness and robustness against data uncertainties in the prediction of home healthcare services utilization by a member.ii.Build explainable ML solutions and exhibit the use of visualizations for the post-hoc explainability of the ML models that would benefit the stakeholders
Machine learning (ML) is emerging in healthcare, and researchers are find- ing plausible scenarios where ML algorithms could be used effectively. The availability of a large volume of digital healthcare claims and electronic health records opened the possibility of using ML algorithms for program and pro- cess management, and health outcomes prediction (Doupe et al., 2019). The healthcare program and process management are facilitated by technology for providing informatics to the program managers, executives, and organi- zations in making informed process, management, and policy decisions for the efficient delivery of healthcare services (Harber and Miller, 1994). Predic- tive algorithms are estimators that map inputs to outcomes and they are used for predicting the health outcomes of healthcare services such as the cost and utilization of healthcare services.
The prediction of the utilization of healthcare resources enables efficient planning of the healthcare resources with fair and equitable budget allocation to healthcare programs. The utilization of healthcare resources varies signif- icantly across the types of healthcare services. The Centre of Medicare and Medicaid Services (CMS) categorizes the types of healthcare services as – hos- pital care, physician and clinical services, other professional services, dental services, home healthcare, residential and personal care, nursing care services, prescription drugs, durable medical products, and other non-durable medical products. The utilization of healthcare resources is measurable by the expen- diture incurred during a time span (Andrew et al., 2006). Home healthcare expenditure is increasing year after year which is contributed by the number of beneficiaries enrolled in the program as the member population tends to recuperate from home and the elderly age at home. Medicaid benefit plans designed for the preference for home healthcare services by the stakehold- ers have an increasing member enrolment trend. Hence it is inevitable to build a prediction model for the utilization of home healthcare services by the members (Ephina Thendral, 2022).
LITERATURE SURVEY ML regression model framework is proposed for accurately predicting health insurance premiums (Kaushik et al., 2022) and the research also insists on the selection of correct attributes for prediction accuracy. The extreme gradient boosted tree algorithm proved efficient in the prediction of clinical outcomes such as 30-day mortality, and re-hospitalization after hospital admission for Medicare Fee for Service beneficiaries (MacKay et al., 2021). A study of predicting mortality and hospitalization was performed with claims and elec- tronic medical records (EMR) using various classification algorithms such as logistic regression, random forest, and extreme gradient boosted tree algo- rithm showed that augmenting the claims data with other related data such as the EMR improved the prediction (Desai et al., 2020). Frailty measures in the Medicare senior population are an area of interest for program managers to address elderly health issues and care (Kim et al., 2018). The frailty index and comorbidity index are used in the prediction of mortality and adverse event prediction in the Medicare elderly population. The research on Medi- care claims shows the plausible scenarios of using ML algorithms in program
Explainable Hybrid Machine Learning Technique for Healthcare Service Utilization 57
and claim management, however, the use of one specific algorithm is not effective in predicting the outcome.
A hybrid ML model deployed as a combination of cluster method and singular value decomposition proceeded by optimization algorithm was pro- posed for big data modelling (Khayyam et al., 2020). Hybridization of the random forest algorithm and extreme gradient boosting tree algorithm proved effective in comparison with the prediction using one specific algo- rithm in demand forecasting for inventory management (Mitra et al., 2022). A hybrid classification model based upon the genetic algorithm and k near- est neighbour algorithm was proposed for the accurate diagnosis of breast cancer (Abed Baraa et al., 2016).
The continual advances and the growing complexity of ML algorithm implementation in healthcare solutions demand that the decisions and actions of the machine learning models are explainable to human users. Explain- able ML in healthcare solutions increases the perception and trust in the emerging artificial intelligent platform. Machine learning systems with the ability to explain their rationale, characterize their strengths and weaknesses, and convey an understanding of how they will behave in the future enable adaptability and sustainability (Fisher et al., 2019).
The explainability of the ML model promotes transparency in the ML algorithm implementation and is guided by the properties such as fidelity, interpretability, unambiguity, and interactivity. The fidelity of the explainable ML model is defined as the truthfulness of the outcome for the given inputs and interpretability of the explainable ML model is the representation of the outcome of the ML model such as it is comprehensible by a human. While the unambiguity property of the explainable ML model renders a determin- istic explanation for every instance in the data, the interactivity property is defined as the capability to express the decision outcome of the ML model for the subspaces of the feature values (Aniek et al., 2021).
UTILIZATION PREDICTION The member’s demographic features, diagnosis, and enrolment details are considered for building the utilization model. However, it is widely accepted that health outcomes are driven also by social and environmental features, furthermore, analysis of the Medicaid home healthcare service data proved the same. Hence various social temporal features such as their living place, federal poverty level, etc., are also considered for predicting the member expenditure in home healthcare services. The home healthcare service uti- lization model predicts the member expenditure in the subsequent years with the ability to peer group members in home healthcare service considering the member demographics, their morbidities, and the socio-temporal features.
The methodology of segmenting the input features using a clustering algo- rithm provides labels for the subsequent classification algorithm in the home healthcare services utilization prediction contributing to the accuracy of pre- dicting the member expenditure. The clique clustering algorithm used in the model training phase discovers the similarities in member characteristics and provides labels for the extreme gradient boosting tree classifier. The best curve
58 Surendranath
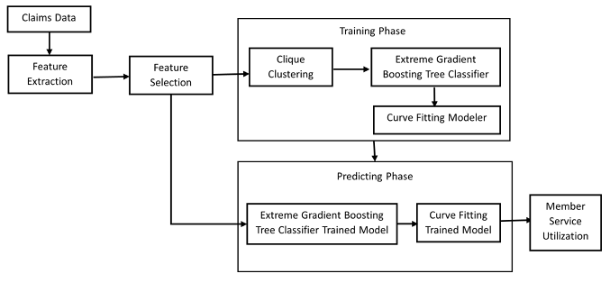
fitting function for each class is chosen either as linear or logarithmic or expo- nential or Gaussian in the training phase. In the prediction phase, the trained extreme gradient boosting tree classifier model finds the member class and applies the curve fitting algorithm determined for that class in the training phase to predict a member’s expenditure. The ML technique using Auto- labelled Boosted Regressor (ALBR) model for prediction of home healthcare service utilization by a member is demonstrated by the schematic diagram in Figure 1.
Figure 1: Schematic illustration of ML technique using ALBR model for a member utilization of home healthcare service.
Utilization Prediction Results In this research project, 4,964,334 Medicaid home healthcare services paid claims for the years 2017–2019 are used as input data to the ALBR model. The claims in the years 2017 and 2018 are used for training the ALBR model and claims in the year 2019 are used for validating the ALBR model. There were 14,432 members enrolled in home healthcare services for the years 2017–2019, among them year 2019 enrolment included 912 new members. The service details such as the service units, member details such as the age, gender, and ethnicity, enrolment details such as enrolment category, and social determinants such as member disability, living facility, poverty, illiteracy, family problems are the input features to the hybrid model. The silhouette coefficient for the clique clustering in the training phase is 0.921, which is the goodness measure of the clustering model.
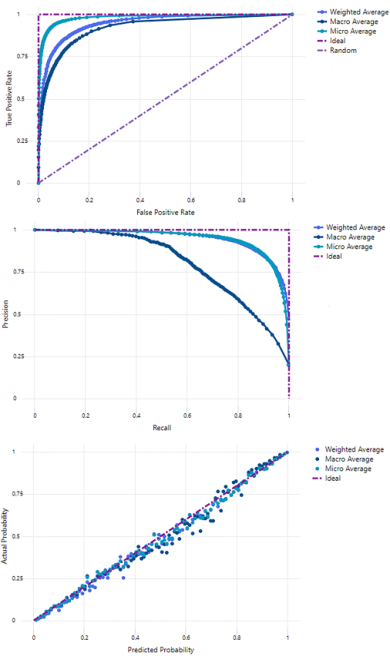
The “Area under the ROC Curve” (AUROC) measures the probabilis- tic output of the extreme gradient tree boosting classifier. The AUROC metric of the classifier in ALBR model is shown in Figure 2(a) with AUROC (macro) = 0.9682, AUROC (weighted) = 0.9778 and AUR OC (micro) = 0.9881. The AUROC measures the relationship between the true positive rate and the false positive rate which may not be a reliable perfor- mance metric when there exists imbalanced class The “Area under the ROC Curve” (AUROC) measures the probabilistic output of the extreme gradi- ent tree boosting classification model. The AUROC metric of the classifier in ALBR model is shown in Figure 2(a) with AUROC (macro) = 0.9682, AUROC (weighted) = 0.9778 and AUROC (micro) = 0.9881. The AUROC
Explainable Hybrid Machine Learning Technique for Healthcare Service Utilization 59
measures the relationship between the true positive rate and the false posi- tive rate which may not be a reliable performance metric when there exists imbalanced class distribution. The “Area under the Precision-Recall Curve” (AUPRC) is a reliable performance metric since they measure the relationship between the fraction of true positives among the predicted positives and the fraction of true positives among the actual positives. The AUPRC of the clas- sifier in ALBR model is shown in Figure 2(b) with PRAUC (macro) = 0.7998, AUPRC (weighted) = 0.8978 and AUPRC (micro) = 0.9021. The imbalances in the home healthcare service utilization classes contribute to the differ- ence in the AUPRC (macro) and AUPRC (micro). However, since the AUPRC (micro) value is significantly greater than the AUPRC (macro), it could be inferred that only misclassification in a few of the classes contributes to the lower value of AUPRC (micro). Figure 2(c) demonstrates the calibration of the classifier, a comparison between the average predicted probability and actual probability. The micro and weighted calibration averages lie close to the ideal while a few instances of macro calibration average lies more distant from the ideal which further confirms the misclassification in a few of the classes.
Figure 2: Performance metrics of ALBR for a member utilization of home healthcare service.
60 Surendranath
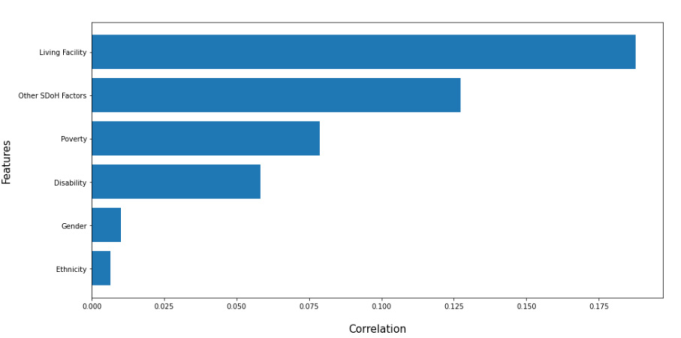
Figure 3: Member feature correlation with utilization of home healthcare service.
DISCUSSION
The covariates contribute to prediction model accuracy and the explainable properties such as the fidelity, ambiguity, interpretability, and interactivity which formally prove the correctness of the ALBR model. The explainable utilization prediction model of home healthcare service are achieved post- hoc using visualizations of the actual and predicted characteristics. Feature importance explanations are helpful to learn which features are most influ- ential in machine learning model outcomes. The features ‘service days’, ‘age group’, and ‘type of service’ in home healthcare claims influence the reim- bursement of the claim. The dollar amount is directly proportional to the time span of the service and the dollar amount varies with the type of service. Home healthcare services are prevalent in the ‘adult’ population when com- pared to the ‘pediatric’ and ‘senior’ populations. The Social Determinant of Health (SDoH) factors of members influence the utilization of home health- care services. The members with similar SDoH factors in history used home healthcare services more compared with their peer group. The feature cor- relation with ALBR model outcome is shown in Figure 3. Considering the ALBR model as a black box, the explainability identifies the probabilities of the feature space in producing outcomes using the prior instances of the features to prove that the ALBR model tunes the hyper-parameters in the training phase for determining the relationship of the input with the output. The truthfulness of the ALBR hybrid model is explained by visualizing the ML outcomes of the training data.
The home healthcare service claims from 2017 to 2019 used for building and validating the utilization model are extrapolated for the successive year (2020) with only the claim input details for an unambiguous explanation of ALBR model as a black box model. The home healthcare services utiliza- tion model is run for the extrapolated claim data for predicting expenditure.
Explainable Hybrid Machine Learning Technique for Healthcare Service Utilization 61
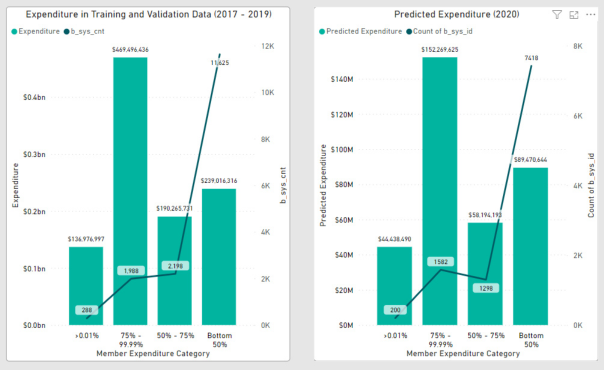
The truthfulness of the ALBR model is explained with the model’s deter- ministic outcome for the given inputs and subspaces of the feature values. The most expenditure in home healthcare services is the member expenditure category 75%–99.99%, followed by the bottom-50% member expenditure category, followed by the 50%–75% member expenditure category, and finally the >0.01% member expenditure category in both the training data and the prediction data is shown in Figure 4. The proportion of predicted expenditure among the member expenditure category is very similar to the proportion of expenditure among the member expenditure category in 3 years of training data. The ratio of >0.01% member expenditure category to 75%–99.99% member expenditure category per member per year in the training data is 21:10 while for the predicted data is 23:10. Similarly, the ratio of 75%–99.99% member expenditure category to 50%–75% mem- ber expenditure category for training data and predicted data is are 25:10 and 23:10 respectively, and the ratio of 50%–75% member expenditure cat- egory to bottom–50% member expenditure category for training data and predicted data is are 42:10 and 38:10 respectively.
Figure 4: Explanation of ALBR model with member expenditure category.
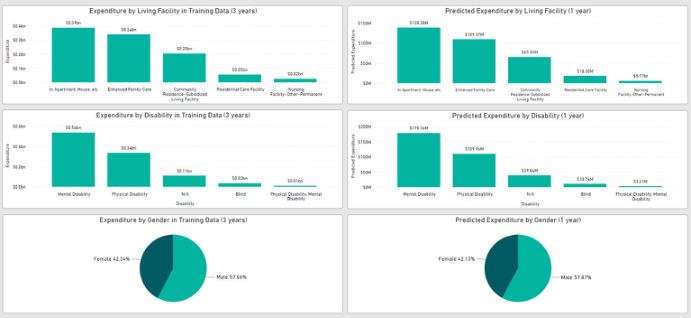
Post-hoc explainable ML methods approximate the behaviour of a black box by extracting relationships between sub-spaces of the feature values and the predictions. The ALBR model is explained across frequent as well as the infrequent sub-spaces of the feature values using the extrapolated real- world home healthcare services data. The relationship of the sub-spaces for the categorical features such as living facility, disability, and gender with the utilization is compared for the training data and predicting data. The sub- spaces in member categorical features and their outcomes are illustrated in Figure 5. The utilization of members living in Top-5 living facilities and with Top-5 disabilities are the same as well as proportional for the training data
62 Surendranath
and prediction data in home healthcare services. The ratio of expenditure among members living in apartments to the members living in enhanced fam- ily care for training data and predicted data are 11:10 and 12:10 respectively. The ratio of expenditure among those living in enhanced family care to the members living in for training data and predicted data is 17:10. The ratio of expenditure among members living in a community residence to the mem- bers living in a residential care facility for training data and predicted data are 40:10 and 36:10 respectively. The ratio of expenditure among members living in a residential care facility to the members living in a nursing facil- ity for training data and predicted data are 40:10 and 36:10 respectively. The ratio of expenditure among members with mental disabilities to the members with physical disabilities for training data and predicted data is 16:10. The ratio of expenditure among members with physical disabilities to the mem- bers with no disabilities for training data and predicted data are 30:10 and 28:10 respectively. The ratio of expenditure among members with no dis- abilities to the members who are blind for training data and predicted data is 36:10. The ratio of expenditure among members who are blind to the mem- bers with physical and mental disabilities for training data and predicted data are 30:10 and 32:10 respectively.
Domain knowledge plays a major role in deriving features for building the ALBR model and statistical analysis of the derived features contributes to the precision and accuracy of ALBR model. Hence domain relevant expla- nations are required and indispensable for evaluating the ALBR model for the scenarios in which it is implemented, particularly in healthcare systems. The domain insight on the relevance of feature relation with the ALBR model outcome helps in understanding the performance of the ALBR model in the healthcare application. In practice, the ML models are designed, optimized, and implemented specifically to the operating domain and application. The increased complexity of the ALBR model in a given application is for increas- ing the predictability of the ML technique in real time. Hence domain relevant explanations of the complex ML techniques contribute to the adaptability of ML techniques by the business in plausible healthcare scenarios.
Figure 5: Explanation of ALBR model in the categorical feature sub-spaces.
Explainable Hybrid Machine Learning Technique for Healthcare Service Utilization 63
CONCLUSION
This manuscript elaborates on the research and implementation outcome of Auto-labelled Boosted Regressor (ALBR) model in the prediction of home healthcare service utilization by a member. The proposed ALBR model used in home healthcare services utilization prediction confirm the grow- ing complexity of ML techniques in medical claim management systems. The effectiveness of hybridization in the performance of ALBR model in home healthcare service utilization prediction is demonstrated. Furthermore, the explanation for the ALBR model is guided by the properties of fidelity, interpretability, unambiguity, interactivity, and relevance to the healthcare domain is strategized in this research. For future work, we plan to implement hybrid ML model for intelligent claim edits in Medicaid claim processing and develop explanations for these complex ML technique with relevance to the healthcare domain.
ACKNOWLEDGMENT
This research was supported by Conduent Inc, USA. I thank Government Healthcare Solutions (GHS) management initiative for this research study and pilot project.
REFERENCES
Abed Baraa M. Shaker Khalid. Jalab Hamid A. Shaker Hothefa, Mansoor. Ali Mohammed. Alwan Ahmad F and Al-Gburi Ihsan Salman. (2016). A Hybrid Clas- sification Algorithm Approach for Breast Cancer Diagnosis, 2016 IEEE Industrial Electronics and Applications Conference (IEACon), Kota Kinabalu, Malaysia, pp. 269–274, doi: 10.1109/IEACON.2016.8067390. Aniek F. Markus. Jan A. Kors. Peter R. and Rijnbeek. (2021). The Role of Explain-
ability in Creating Trustworthy Artificial Intelligence for Healthcare: A Compre- hensive Survey of the Terminology, Design Choices, and Evaluation Strategies, Journal of Biomedical Informatics, Volume 113, 103655, ISSN 1532-0464, https: //doi.org/10.1016/j.jbi.2020.103655. Briggs Andrew. Mark Sculpher. and Karl Claxton. (2006). Decision modelling for health economic evaluation. Oxford university Press. Desai RJ. Wang SV. Vaduganathan M. Evers T. and Schneeweiss S. (2020). Com-
parison of Machine Learning Methods With Traditional Models for Use of Administrative Claims With Electronic Medical Records to Predict Heart Failure Outcomes. JAMA Netw Open. 2020 Jan 3;3(1): e1918962. doi: 10.1001/jamanet- workopen.2019.18962. PMID: 31922560; PMCID: PMC6991258. Ephina Thendral, S. (2022) The Effect of Socio-Temporal Factors in the Prediction of Home Healthcare Service Utilization. Proceedings of the International Conference on Ubiquitous Computing & Ambient Intelligence. Lecture Notes in Networks and Systems, vol 594. Springer, Cham. https://doi.org/10.1007/978-3- 031-21333-5-10 Fisher A. Rudin C and Dominici F. (2019). All Models are Wrong, but Many are
Useful: Learning a Variable’s Importance by Studying an Entire Class of Prediction Models Simultaneously. J Mach Learn Res. 20:177. PMID: 34335110.
64 Surendranath
Hamid Khayyam. Ali Jamali. Alireza Bab-Hadiashar. Thomas Esch. Seeram Ramakrishna. Mahdi Jalili and Minoo Naebe. (2020). A Novel Hybrid Machine Learning Algorithm for Limited and Big Data Modeling With Application in Industry 4.0, in IEEE Access, vol. 8, pp. 111381–111393, 2020, doi: 10.1109/AC- CESS.2020.2999898. Harber BW and Miller S. (1994). Program Management and Health Care Infor-
matics: Defining Relationships. Healthcare Management Forum. 7(4): 28–35. doi:10.1016/S0840-4704(10)61075-7. Kaushik K. Bhardwaj A. Dwivedi AD. Singh R. (2022). Machine Learning-Based Regression Framework to Predict Health Insurance Premiums. Int J Environ Res Public Health. 19(13):7898. doi: 10.3390/ijerph19137898. PMID: 35805557; PMCID: PMC9265373. Kim DH. Schneeweiss S. Glynn RJ. Lipsitz LA. Rockwood K. and Avorn J. (2018).
Measuring Frailty in Medicare Data: Development and Validation of a Claims- Based Frailty Index. J Gerontol A Biol Sci Med Sci. 73(7): 980–987. doi: 10.1093/gerona/glx229. PMID: 29244057; PMCID: PMC6001883. MacKay EJ. Stubna MD. Chivers C. Draugelis ME. Hanson WJ. et al. (2021). Application of machine learning approaches to administrative claims data to predict clinical outcomes in medical and surgical patient populations. PLOS ONE 16(6): e0252585. https://doi.org/10.1371/journal.pone.0252585. Mitra A. Jain A. Kishore A and Kumar P. (2022). A Comparative Study of Demand
Forecasting Models for a Multi-Channel Retail Company: A Novel Hybrid Machine Learning Approach. Oper. Res. Forum. 3(4):58. doi: 10.1007/s43069- 022-00166-4. Epub 2022 Sep 27. PMCID: PMC9514716. Patrick Doupe. James Faghmous and Sanjay Basu. (2019). Machine Learning for Health Services Researchers, Value in Health, Volume 22, Issue 7, Pages 808-815, ISSN 1098-3015, https://doi.org/10.1016/j.jval.2019.02.012.
LISTED IN THE AHFE DIGITAL BOOKSTORE CATALOGUE
Explore the complete digital volume
Healthcare and Medical Devices
Read this individual research paper free through the original publisher, or explore the full digital proceedings book.
ISBN 978-1-964867-06-9
Explore this ISBN in the AHFE Bookstore ↗Listed in the July 2026 bookstore catalogue; search by ISBN to confirm current availability · Digital book purchase optional