Alec Zhixiao Lin, Isaac Chen Fu (2026). Safety Predictive Model with Machine Learning and Its Application in DART Analysis in Utility. In: Human Factors in Simulation, Software and Systems Engineering. AHFE Open Access, vol. 220, pp. 67–75. https://doi.org/10.54941/ahfe1007695
Workplace safety is critical for utilities and field operations, where complex work orders pose significant risks to employees and operations. Safety Predictive Model (SPM) is a data-driven solution that proactively identifies high-risk work orders and supports mitigation strategies. SPM uses enterprise data such as material group codes, work order types, location attributes, seasonal factors, and circuit details. Injury and Serious Injury/Fatality (SIF) records are linked to work orders to strengthen model accuracy. Historical data informs modelling, while new data validates performance. Over 90 variables are engineered for machine learning, with predictive strength assessed via Information Value. Algorithms tested include logistic regression, decision trees, SVM, and gradient boosting, with ensemble methods selected using ROC AUC and KS statistics. A composite risk score flags top deciles as high risk, applying district-specific thresholds. Beyond assessing upcoming work orders, SPM reveals key risk drivers, enabling utilities to anticipate and mitigate safety challenges effectively.
The operational value of predictive risk models for field work safety in electricity utilities lies in their capacity to orchestrate a fundamental shift from a reactive posture—correcting problems after they occur—to a proactive one, focused on preventing them before they happen (Field1st). Traditional safety management systems often rely on lagging indicators, such as injury reports and post-incident investigations, which provide valuable insights but only after harm has already been done. This approach, while necessary for understanding past failures, is inherently limited in its ability to prevent future ones. A study in the construction industry found that conventional safety management is often inadequate because static plans and procedures become obsolete as work conditions evolve, leaving organizations vulnerable to new and unforeseen risks.
Predictive analytics directly addresses the above limitations by transforming vast streams of historical operational data into actionable intelligence, enabling managers to intervene before a high-risk situation escalates into an incident. This transition is not merely about adopting new software; it
68 Lin and Fu represents a philosophical evolution toward a resilient safety culture defined as an organization’s capability to anticipate, monitor, respond, and learn to manage safety risks effectively (Minh et al).
Safety Predictive Model (SPM) is a data-driven solution that proactively identifies high-risk work orders and supports mitigation strategies. Integrated with Days Away, Restricted, or Transferred (DART) analysis, SPM predicts risk level by work order and can be aggregated to circuit, substation and district levels for proactive measures for risk mitigation.
In this paper, we introduce a framework that integrates in-house and third-party data with machine learning to build a predictive model for ranking the risk levels of work orders scheduled by Southern California Edison (SCE). The model assigns a risk score to each work order, supporting two primary objectives:
- Advance Risk Alerts: Scores indicate the relative risk of upcoming work orders, enabling crews to receive early warnings and prepare for potential hazards. - Strategic Risk Assessment: Aggregated scores provide insight into the overall risk profile of forthcoming work, allowing utilities to plan targeted safety training and allocate resources where higher risk is anticipated.
BUILDING SAFETY PREDICTIVE MODEL (SFM)
DATA SOURCES The SPM draws on a comprehensive set of enterprise data, including:
- Material group codes associated with the equipment used; different equipment combinations correspond to different material group codes. - Work order types that identify the assets involved. - Location attributes such as latitude, longitude, and elevation. - Socio-demographic indicators including population density, residential versus non-residential customer ratios, home price levels, and local economic stability. - Seasonal and environmental factors such as temperature, irradiance, and other weather-related variables. - Structure and circuit characteristics. Because approximately 80% of work orders involve repair, replacement, or maintenance of distribution transformers, we extract transformer-level attributes such as product type, overhead versus underground configuration, material type, asset age (based on installation date), pole height, and transformer oil level for modelling purposes. - Structure-level electricity usage aggregated from customer-level consumption data.
For the dependent variable, historical records of injuries, serious injuries, and serious-injury-and-fatality (SIF) events are all treated as occurrences of a safety incident. Because serious injuries and fatalities are relatively rare, more common injury types—such as ankle sprains, back injuries from improper
Safety Predictive Model With Machine Learning and Its Application 69 lifting or handling heavy loads, and cuts resulting from contact with sharp tools or wires—are also included. This practice has two benefits: it increases the number of observable events for model training and provides a more comprehensive view of safety-related risks.
Most data can be linked with work order numbers. Location data can be appended by using circuit number. Socio-demographic data were aggregated to the structure or circuit level for merging.
Because model scores must be generated at least 21 days before a work order is executed, it is not feasible to incorporate certain dynamic human-factor variables, such as crew fatigue indicated by vacation history, consecutive workdays, or overtime hours. Even for weather-related information, we can only rely on aggregated historical measures—such as temperature and humidity—since we were informed that weather forecasts beyond seven days become highly unreliable.
SAMPLING Sampling is carefully structured: rather than randomly divide the sample into a modelling sample and validation sample, we choose the first 15 quarters for modelling and the data from year 2022 for validation. Emergent or unplanned work orders—those requiring immediate response—are excluded because they have limited available data and allow little to no preparation time for district crews.
Table 1: Counts of work orders and safety incidents by quarter.
modeling (2018/04-2021/12) validation (2022/01-2022/10) Total 122,422 556 44 0.454% 0.036%
70 Lin and Fu VARIABLE ENGINEERING AND EVALUATION The data includes more than 300 MAT codes and roughly 300 material groups. These fields contain text descriptions of the equipment needed and the types of assets involved, as illustrated below at the work-order level1.
Table 3: Examples of MAT codes and material groups.
Table available in the original PDF paper.
Material Group
MAT Code
MAT Code Description MateriallD Material Material GroupID
411215 CHEMICAL. ADHESIVES 205 Apparatus OH NB REPL
10071949 WASHER,FLAT,11/16” ID X2’’ LGX2” WD
314105 WASHERS (FASTENERS) 207 Apparatus UG ELECT REPL
10068617 COVER, BOLT, BOLT KIND, POLY 713104 HARDWARE, POLE LINE 209 Apparatus UG INSP REPL
10118162 CONNECTOR,ELECTRICAL,BUS KIND
713201 CONNECTORS & SPLICES To prepare the data for machine learning, these text fields are transformed into numerical representations. We illustrate this process using MAT codes as an example:
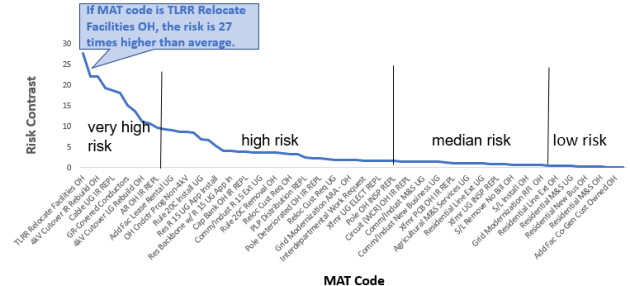
Step 1: Calculate risk contrast of each MAT code by applying the following:
Equations and mathematical formulas are available in the original paper PDF.
1 Risk Contrast 0
( ) ( )
= = = where P(x = 1): % incident rate when a MAT code is present for a work order P(x = 0): % incident rate when a MAT code is not present for a work order Step 2: Set up a dummy variable for each of the frequently used MAT code. Step 3: For remaining MAT codes, rank the risk contrast of each MAT code from highest to lowest.
Step 4: Bundle adjacent MAT codes together to create risk levels as the following:
Figure 1: Risk separation and bundling for MAT codes.
1One work order usually has multiple MAT codes and multiple material groups.
Safety Predictive Model With Machine Learning and Its Application 71 Step 5: Assign numerical values of 1, 2, 3, and 4 to each respective level of risk.
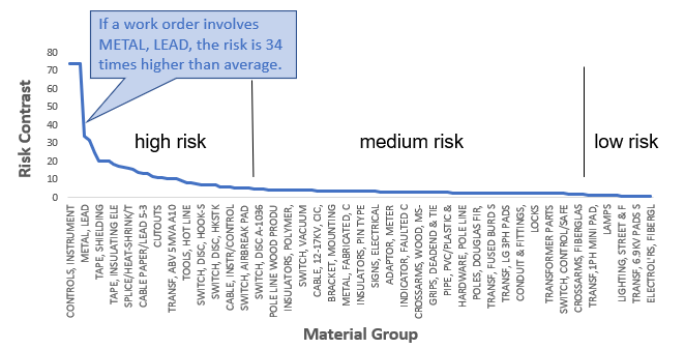
The risk tiers shown above are defined using the modelling sample, and the same cutoffs are applied to the validation sample. A similar approach was used for material groups, yielding the following bundling results:
Figure 2: Risk separation and bundling for material groups.
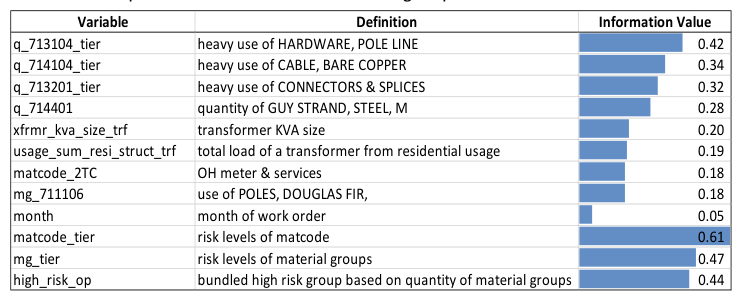
We arrived at 90 attributes after merging data from all sources and Predictive power is assessed using Information Value (IV). To calculate IV, each numerical variable is divided into multiple – usually 10 - bins, with approximately equal number of records in each bin. Within each bin, IV compares the difference in percentage of work orders with faults and percentage of incidents without incidents. The following is the formula for the IV calculation (Lin):
n i i i i
Incidents Incidents notIncidents In notIncidents i
%Incidents: percentage of work orders with incidents %notIncidents: percentage of work orders without incidents Intuitively, if bins show drastically different probabilities for occurrence and non-occurrence, such a variable will yield a high IV and is considered as a strong predictor. Also, IV does not discriminate against non-linearity or non-monotonicity. That is, a variable does not need to show monotonicity to the target outcome in order to be considered as a good predictor. This is very suitable for multiple machine learning algorithms.
Correlation analysis ensures variables contribute unique perspectives on risk, avoiding redundancy and overfitting. For example, high quantities of certain hardware or cables can increase risk by several times, while residential usage patterns may lower risk.
The following features were selected for entering the final model:
Table 4: Examples of MAT codes and material groups.
MODELLING Multiple machine learning algorithms are tested, including logistic regression, decision trees, naïve Bayes, and gradient boosting. Ensemble methods combine the strengths of individual models, with ROC AUC scores guiding algorithm selection.
Table 5: Modelling summary.
Table available in the original PDF paper.
Machine Learning Algorithm ROC AUC Used by Composite Score Logistic Regression 0.771 Yes
Decision Tree 0.634 Yes Naïve Bayes 0.787 Yes
Stochastic Gradient Descent 0.536 No KNN 0.555 No
Light Gradient Boosting Machine 0.755 Yes Random Forest 0.524 No
Only models with ROC AUC score > 0.6 will be selected to enter the following formula for generating a composite risk score.
Model Score ROC AUC CompositeRiskScore
ROC AUC
where ModelScore: Probability estimate from individual model i ROC_AUC: used as the weight for the model score i Kolmogorov-Smirnov (KS) statistics is used to evaluate the overall predictive power of the composite risk score. Our model shows a KS statistics of 0.40 for the modelling sample and 0.42 for the validation sample (see Table 2), which is well above the common used threshold of 0.25 for a usable predictive model.
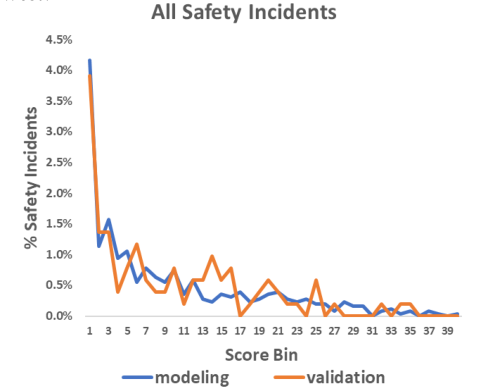
Safety Predictive Model With Machine Learning and Its Application 73 If we divide the composite risk score into 40 evenly distributed bins, the following is how the risk separation looks like if we rank the risk score from highest to lowest:
Figure 3: Risk separation of all safety incidents by the composite risk score.
Because safety incidents are rare and must be distributed across 40 bins, the curves in the lower-risk bins appear irregular. However, this does not affect the model’s practical use, as work orders in the highest-risk bins are the ones that prompt crews to allocate additional attention and preparation.
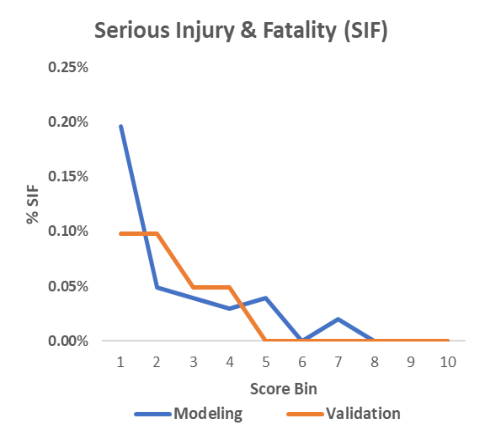
Serious injuries and fatalities are far rarer events, but the model’s scores are still effective in predicting them.
Figure 4: Risk separation of SIF by the composite risk score.
OPERATIONALIZING RISK MITIGATION Districts use SPM outputs to proactively manage risk:
Flagging high-risk work orders: Enables focused safety reviews and resource allocation.
Performance evaluation: Quarterly data is used to assess the effectiveness of mitigation measures.
Continuous improvement: Feedback from districts informs model refinement, and additional data, e.g., weather, equipment, crew familiarity, is considered for future model versions.
SCE has 34 districts that collectively oversee around 600 substations and approximately 4,000 circuits. Because operational environments differ, some districts inherently face higher levels of risk than others. If we flag high-risk work orders uniformly across the entire service area, districts with naturally higher-risk work will eventually become desensitized, since their work orders would be flagged more frequently. Conversely, districts with lower inherent risk may also become less attentive, as their work orders would rarely be flagged.
To address this challenge, we identify and highlight the top five highest-risk work orders per district per month. This ensures a consistent and meaningful focus on risk across all districts, regardless of their baseline risk levels.
Finally, we want to point out that Safety Predictive Model do not seek to replace foundational safety protocols but rather to enhance their effectiveness. They act as an analytical engine that makes sense of the enormous volume of data generated by existing processes.
APPLYING THE MODEL IN DART ANALYSIS DART rates reflect the frequency of incidents resulting in days away from work, restricted duties, or transfers. Analysis of recent trends 2023 reveals several key drivers of increased DART rates:
High-risk districts carrying more work orders: Districts like Huntington Beach and Covina have seen a rise in work order volume, correlating with higher incident rates.
Higher frequency of high-risk work orders: Certain MAT codes are associated with elevated risk, and their execution has increased compared to previous years.
Increase in emergent work orders: Urgent, unplanned work orders pose greater risks due to limited preparation time, and their frequency has risen by over 15%.
DART Rate and Potential Risk
4.2%
4.1%
4.02%
4.0%
3.88% 3.91%
3.86% 3.89%
3.9%
3.81%
DART Rate
Potential Risk
3.8%
DART Rate
3.7%
Overall weighted potential risk
3.6%
2018 2019 2020 2021 2022 2023
Figure 4: Correlation between overall risk score and safety incidents.
Figure available in the original PDF paper.
RECOMMENDATIONS AND NEXT STEPS To further enhance safety outcomes, the following steps are recommended:
Expand data collection: More comprehensive incident and work order data, especially for emergent tasks, will improve model accuracy.
Refine variable engineering: Incorporate new predictors such as weather, equipment, and crew experience.
Strategic resource allocation: Use model insights to guide training, personnel deployment, and operational planning.
Incorporate GIS-based features—such as terrain and slope characteristics— to enhance model performance (Xu et al).
Feedback loop: Regularly review flagged work orders and DART outcomes with districts to validate and improve the model.
CONCLUSION
Safety Predictive Model represents a significant advancement in enterprise safety analytics, enabling organizations to anticipate and mitigate risks before incidents occur. Its integration with DART analysis provides actionable insights for reducing workplace injuries and improving operational resilience. By continuously refining the model and expanding data inputs, organizations can foster a proactive safety culture and achieve measurable improvements in employee well-being and productivity.
REFERENCES
Field1st, How Predictive Analytics Prevents Workplace Incidents Before They Happen (2025), https://field1st.com/safety-management/predictive-safety-analytics/ Lin, Z., SAS Global Forum (2013), https://support.sas.com/resources/papers/
proceedings13/095-2013.pdf Minh, T., Feng, Y. (2022), A Maturity Model for Resilient Safety Culture Development ... https://www.mdpi.com/2075-5309/12/6/733 Xu, R., Kim, B. W., Moe, S. J., Khan, A. N., Kim, K., Kim, D. H., Heliyon, Volume 9,
Issue 9 (2023). Predictive worker safety assessment through on-site correspondence using multi-layer fuzzy logic in outdoor construction environments, https://www. sciencedirect.com/science/article/pii/S2405844023066161
LISTED IN THE AHFE DIGITAL BOOKSTORE CATALOGUE
Explore the complete digital volume
Human Factors in Simulation, Software and Systems Engineering
Read this individual research paper free through the original publisher, or explore the full digital proceedings book.
ISBN 978-1-964867-96-0
Explore this ISBN in the AHFE Bookstore ↗Listed in the July 2026 bookstore catalogue; search by ISBN to confirm current availability · Digital book purchase optional