Ellen Bass, Tauseef Mamun, Benson Zhang, Junkai Ge, Meghan Lane-Fall (2026). Supporting Inspection of Structured Qualitative Team Task Analytic Data. In: Human Factors in Simulation, Software and Systems Engineering. AHFE Open Access, vol. 220, pp. 8–14. https://doi.org/10.54941/ahfe1007689
One barrier to translating an effective team-based care process between clinical sites is that there are no comprehensive software systems to support process specification and comparison. As an incremental step to fill this gap, this work describes software requirements and design concepts to support the inspection and comparison of qualitative team process data across sites. The analysis can define labels for process attributes and valid values for them. The analyst can then encode data for one or more sites. Our custom macro-enabled Microsoft® Excel workbook presents reports with the values for each attribute as well as values by site. The reports support the analyst in fixing any differences created by how the data are encoded, as well as identifying true differences.
Sharing best practices means documenting, distributing, and implementing effective ways of working. However, when trying to implement a process that works well in one setting, site-specific factors may require adaptations. Having methods and tools to support identifying the need for adaptations would help. One step along the way is identifying apparent and actual process differences between current practices at multiple sites. This is especially true for team processes where people pursue different goals over time, work independently and together across locations and care phases, take on roles that shift between care phases, need different information along the way, and rely on many tools and technologies in their tasks.
As part of a larger study focusing on implementing an evidence-based operating room (OR) to intensive care unit (ICU) handoff process at multiple sites (Lane-Fall et al., 2021), researchers developed knowledge elicitation guides, visual and Microsoft® Excel spreadsheet representations of team processes, and qualitative data analysis methods to facilitate interviewing and analyzing team process data from multiple roles (Hose, Conn Busch, Lane-Fall, and Bass, 2022). However, no computational tools could be found to help analysts to review and to cross-check team process data.
This work describes software requirements and design concepts to support the inspection of team process data. The work builds upon prior Received February 5, 2026; Revised April 4, 2026; Accepted April 18, 2026; Available online July 20, 2026
Supporting Inspection of Structured Qualitative Team Task Analytic Data 9 work to compare team-based care processes performed at two sites to inform redesign opportunities (Hose et al., 2022) and to identify opportunities for member checking based on conflicts between Subject Matter Experts (SMEs) who are classified as providing strong evidence for a particular task and based on the need for confirming information when all of the interviewed SMEs are classified as providing weak evidence for a particular task (Bass, Wu, and Barnett, 2024). In the prior work, team processes were defined with qualitative attributes including goals, strategies, tasks, performing roles, disseminated information, and associated tools and technology.
APPROACH In order to compare team processes, analysts may be tempted to check the steps completed at one site with those at another. However, steps at one site may not match another’s, even when both are achieving similar goals. Also, some steps may not be necessary at a site due to contextual differences. More specifically, while procedures are generally described at the task level, it is important to document the process goal(s) and strategies to achieve them. Documenting such data is helpful because differences across sites in staffing, technology, and other contextual factors may change the tasks and even the strategies used to achieve goals. In other cases, the goals themselves may change, requiring new strategies and tasks to achieve them. For example, a goal in a hospital setting may be to safely move a patient from the OR to the ICU. The strategy at one site may be to employ a team with three roles (one to move the patient bed, one to monitor the patient and administer medications if necessary, and a third to address the environment, such as pressing elevator buttons and holding doors) (see Table 1). A different hospital may have self-driving robotic gurney technology that may eliminate the need for a transport technician.
Table 1: Goals, strategies, tasks, roles, and information example.
Table available in the original PDF paper.
Phase Goals Strategy Tasks Roles Information Medications administered Patient trans- port Safely move patient from OR to ICU Ensure continuation of patient care Transport technician Surgery represen- tative Anesthesia represent- tative
Use a mobile patient bed with monitoring equipment and a 3 person team to address the transport of the patient and patient needs
Move patient bed Address the hospital environment Monitor patient and administer medications as needed
In some cases, comparing team processes may be complicated by the different forms in which attributes are encoded. For example, one analyst may call a role a “surgery representative” while another may use the term “surgeon” and a third “surgery rep.” Such differences would make team processes appear to need adaptations when the process roles already align. With a small data set, finding such discrepancies would be trivial, but with a more complex process or across processes, more effort would be required, even when codebooks are employed. Because the study described in Lane-Fall
et al. (2021) originally involved more than 10 sites with dozens of process steps per site, analysis support was identified to be helpful.
ANALYSIS SUPPORT REQUIREMENTS The following requirements address the collection and summary of team process data for the purpose of comparing processes.
Req. 1 The analysis support system shall support the identification of labels for the categories of team process data. For example, Hose, Conn Busch, Lane- Fall, and Bass (2022) identified the following categories of team process data:
Site: The work setting
Phase: A distinct, goal-oriented collection of related activities within a process that breaks down complex work into manageable, staged components. For the OR to ICU handoff, example phases include patient transport, patient stabilization, and a huddle of clinicians.
Goal: future or desired result, such as the patient being delivered to the OR safely and in a stable condition
Strategy: A method to achieve a goal. For example, a communication goal may be achieved by many strategies, such as two-way synchronous verbal communication where the communicators can be collocated, one- way asynchronous communication via a retrievable message, or one-way synchronous communication via a broadcast verbal announcement.
Task: specific, actionable, and measurable unit of work within a larger, structured process designed to achieve a particular, narrow outcome.
Role: A specific, assigned function that a team member adopts to contribute to team goals. Typically, to fulfill a role, one must have a certain level of training, knowledge, and skills.
Professional Title: A title that can fulfill a role. For example, an anesthesiology attending, anesthesiology resident, or certified registered nurse anesthetist (CRNA) can serve as the anesthesiology representative.
Information: data or knowledge that is part of a task. Information can come into play in processes including acquisition, recording, retrieval, utilization, and dissemination.
Technology and Tools: Artefacts that support task execution by transforming environments, changing workflows, and automating steps. They can help an individual with respect to efficiency as well as support team processes such as communication and collaboration.
Later analyses identified a need to refine the categories, such as having required and optional roles. Thus, the analyst should be able to provide a set of labels for the analysis support system to use for each team process. If there are multiple roles for tasks, the analyst may want to have labels for required roles, such as “Role 1” and “Role 2 “as well as a second set of labels, such as “Optional Role 1” and “Optional Role 2”.
Req. 2 The analysis support system shall support the entry of qualitative structured data with values for the labelled categories. For team processes, the analyst may want to develop sets and subsets of data values based on attributes described above. A particular site’s process may include one or more phases.
Supporting Inspection of Structured Qualitative Team Task Analytic Data 11 Each phase may achieve one or more goals. Each goal may be achieved by one or more strategies. Each strategy may be achieved by one or more tasks. Each task may be achieved by one or more role representatives. One or more professional titles may serve as a role representative. Each task may require one or more elements of information. Each task may generate one or more elements of information. Each task may disseminate one or more elements of information. Each task may be associated with one or more tools or technologies.
Req. 3 The system shall report the unique categorical data values for each label used in an analysis. The analyst can then review what values are used for each label and consider whether one or more concepts are being expressed using multiple label values.
Req. 4 The analysis support system shall support the analyst in storing values for each label that can be used for data validation. The analyst can optionally identify valid values for each label. Once an initial set of values for a label is defined, the system should allow the analyst to extend or narrow the list. In this way, the analyst can document the preferred terms in a codebook used by the analysis support system.
Req. 5 The analysis support system shall support comparing the values for each label across sites. In this way, the system can support the analyst in determining whether team processes at different sites match with respect to labelled attributes.
Req. 6 The analysis support system shall support clustering sites when tasks utilize similar roles. In this way, the system can support the analyst in determining whether team processes at different sites match with respect to the task description but only differ by role.
Req. 7 The analysis support system shall support clustering sites when tasks utilize similar tools. In this way, the system can support the analyst in determining whether team processes at different sites match with respect to the task description, but only differ by supporting tools.
ANALYSIS SUPPORT SYSTEM DESIGN CONCEPT The design philosophy is that the analysis support system should guide the analyst through the analysis process, scaffolding what information it can, and otherwise prompting the analyst for input when needed. The design concept is to use a macro-enabled Microsoft® Excel workbook. In this way, an analyst can use familiar spreadsheet structures and functions. Custom functions are defined via macros using Visual Basic for Applications (VBA).
To address Req 1, initial values for labels for the categories and their valid values can be stored in a template worksheet. Each label appearing in the first row in the template worksheet can have valid values entered in the rows below. If no values appear in the rows below a label, then the label values are not restricted. Built-in data validation capability can then be employed to address Req 4.
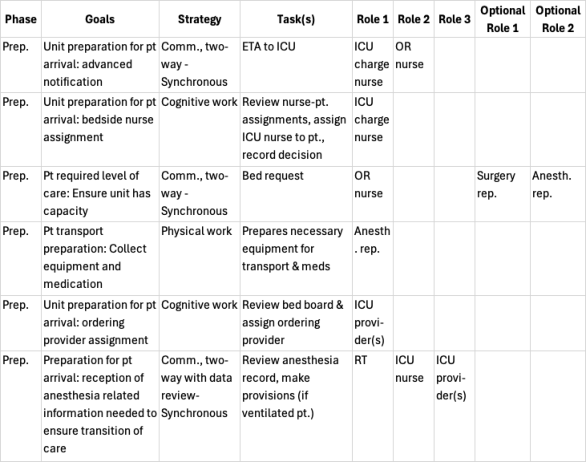
To address Req 2, either each site’s data can be entered in a separate worksheet, or the first column in the workbook can identify the site. The first strategy (i.e., separate worksheets) eliminates the need to report the site name multiple times. The analyst can add the labels needed for the particular site in the first row. Subsequent rows can then be used for process tasks. See Figure 1 for an example
where the analyst decided to use one label (and column) for phase, goal, strategy, and task data, and five for role data.
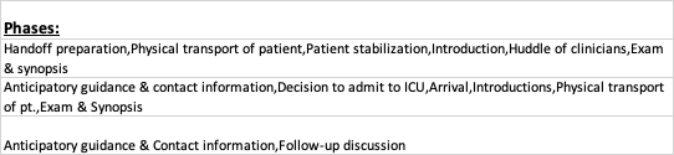
Req 3 means that the system will present the label values for each attribute. Such a presentation will allow the analyst to find cases where the codebook needs more specificity. See Figure 2 as an example of the data for the label “Phase”. Here, the analyst can see that for one site, an analyst entered “Physical transport of patient” but for another “Physical transport of patient (pt.)” Similarly, one site includes “Introduction” but another “Introductions”. Also, the analyst can see that one site includes the phase “Anticipatory guidance & contact information”, but for another, the words are encoded with different capitalization: “Anticipatory guidance & Contact information”. See also “Exam & synopsis” as opposed to “Exam & Synopsis.”
Req 5 means that the system will present the label values for each attribute by site. Such a presentation can help the analyst find actual differences as well as those determined by encoding differences. For example, note that the analyst could have entered the data for a site such that no compound tasks appeared. For example, the row with “review nurse-pt. assignments, assign ICU nurse to pt., record decision) could have been repeated for a different site three times: with the task attribute first containing “review nurse-pt. assignments”, then containing “assign ICU nurse to pt.” and then “record decision.” The analyst could then inspect the output and notice three separate values for one site and the longer composite value for the other.
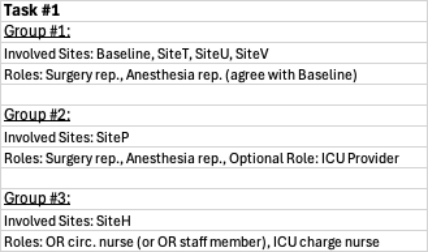
Req 6 and Req 7 are interesting cases for site comparison. Here, the sites achieve the same goal but use either different roles or tools or both. Figure 3 shows an example where the same task is achieved by one set of roles in four sites, a different set of roles at the fifth site, and another set of roles at a sixth.
Figure 1: Goals, strategies, task, roles example for a single phase for a single site (Comm. = communication; ETA = estimated time of arrival; meds = medications; Prep.=preparation; pt=patient; rep. = representative; RT = respiratory therapist).Figure 2: Phase report supporting identification of encoding differences.Figure 3: Task report where sites are grouped by use of common roles.
DISCUSSION
We have created a prototype macro-enabled Microsoft® Excel workbook to support an analyst in specifying and comparing team process data. The tool scaffolds the analysis, guiding the analyst through the process. Data for different sites can be stored in separate worksheets. Buttons allow the analyst to easily execute macros that automate the generation of reports. The reports support comparing processes from different sites and investigating potential discrepant data from typographical errors and similar features being given different labels.
While the analysis support system is designed to support analyzing operating room to intensive care unit handoff processes, all of the task analytic data labels are processed at run-time. The hope is that other analysts interested in characterizing and validating structured team process data may also benefit from the tool’s use.
ACKNOWLEDGMENT
The National Heart, Lung, and Blood Institute of the United States National Institutes of Health funded a portion of this work through an investigator- initiated research grant (1R01HL153735; PI: Lane-Fall). The funder had no role in the design of the study and will have no role in data collection, analysis, interpretation, or manuscript writing.
REFERENCES
Bass, E.J., Wu, Y. X., & Barnett, N. (2024). Approach to member checking support for characterizing team processes with discrepant information about team roles. 15th International Conference on Applied Human Factors and Ergonomics (AHFE 2024) and the Affiliated Conferences, July 24–27, 2024, 46–52. Hose, B-Z, Conn Busch, J., Lane-Fall, M.L.,& Bass, E. J. (2022). Systematic approach
for comparing team-based care processes. The 66th International Annual Meeting of the Human Factors and Ergonomics Society, Atlanta, GA, October 10–14, 2022, 580–584. Lane-Fall, M. B., Christakos, A., Russell, G.C., Hose, B-Z, Dauer, E. D., Greilich, P. E., Mershon, B. H., Potestio, C. P., Pukenas, E. W., Kimberly, J. R., Stephens-Shields, A. J., Trotta, R. L., Beidas, R. S. & Bass, E.J. (2021). Handoffs and Transitions in Critical Care – Understanding Scalability: study protocol for a multicenter stepped wedge Type 2 hybrid effectiveness-implementation trial. Implementation Science, 6(1), 63.
LISTED IN THE AHFE DIGITAL BOOKSTORE CATALOGUE
Explore the complete digital volume
Human Factors in Simulation, Software and Systems Engineering
Read this individual research paper free through the original publisher, or explore the full digital proceedings book.
ISBN 978-1-964867-96-0
Explore this ISBN in the AHFE Bookstore ↗Listed in the July 2026 bookstore catalogue; search by ISBN to confirm current availability · Digital book purchase optional