Alec Zhixiao Lin, Isaac Chen Fu (2025). Empowering Transportation Electrification and Grid Planning: A Bottom-Up Predictive Modeling Framework. In: Human Factors in Software and Systems Engineering. AHFE Open Access, vol. 181, pp. 89–98. https://doi.org/10.54941/ahfe1006398
Transportation electrification plays a crucial role in the transition to green energy. As households, businesses, and public entities increasingly shift from gas vehicles to electric vehicles (EVs), the demand for charging infrastructure leads to a significant rise in energy consumption. To effectively plan grid buildout, utilities need to rely on granular geographic data to pinpoint when and where EVs will start to emerge or grow in number on the grid. This process involves utilizing multiple models, including detection models to identify existing EVs that are currently unknown to utilities; propensity models to predict which customers are more likely to adopt electric vehicles in the near future; and forecasting models to anticipate which service areas will experience a greater rise in energy demand due to increasing EV adoption, thus requiring more immediate attention. While there is overlap in data sources and preliminary work on this topic, this paper outlines a blueprint for a bottom-up approach that leverages diverse data to create multiple predictive models tailored to different business needs.
Current estimates suggest that the world’s proven oil reserves can sustain consumption for about 50 years (Osborne, 2024). Transitioning to alternative energy sources is crucial. A significant trend is the shift from gasoline to electric vehicles (EVs), which reduces dependence on petroleum and supports development post-depletion. Clean energy sources like solar, wind, and hydrogen help slow climate change. In 2016, transportation surpassed electric power as the leading source of carbon emissions, accounting for 28% of total emissions. Widespread adoption of electric vehicles and renewable energy could reduce global transportation emissions by 80% to 90% by 2050, requiring significant infrastructure and policy changes (PBS Science, 2022). Additionally, driverless cars represent a new direction in development, and it is believed that electric vehicles can operate
more efficiently than traditional internal combustion engine (ICE) vehicles (Westbrook, 2022).
EVs can be charged at public chargers, onsite, and at home. Simultaneous charging by multiple EVs may overload the power grid (Osaka, 2022). About 80% of residential EV charging occurs at night. As more households, businesses, and public entities switch to EVs, the demand for charging infrastructure and energy consumption rises. This increased EV load impacts key power grid components, potentially overwhelming the system and requiring utilities to supply more power (Brown, 2022).
Most utilities’ current grid infrastructure was not designed to accommodate the widespread adoption of electric vehicles and cannot handle the increased load. This necessitates costly measures such as peak plants and unplanned upgrades, which address immediate issues but do not support long-term planning, potentially wasting resources and causing customer dissatisfaction. For instance, without understanding the increased EV demand, a crew might replace a failed transformer with one of the same specifications, leading to a similar failure in the near future. Timely and appropriate upgrades can mitigate issues like power outages, voltage fluctuations, and compromised system stability. To achieve this, utilities need to know where and when EV adoption has occurred, will occur and at what pace and scale. This paper introduces a bottom-up approach for building multiple predictive models to address this need.
BOTTOM-UP APPROACH VS TOP-DOWN APPROACH Effective long-term grid planning necessitates a precise understanding of historical, current, and future events. The top-down approach has been widely used in predicting or forecasting the future. It usually starts with a broad overview and then breaks it down into smaller, more detailed components. In grid planning associated with transportation electrification, it typically proceeds as the following:
Identify the main goal for the number of EVs in the service area by a certain year.
Identify key drivers that influence this overall goal. These drivers could include economic indicators, demographic trends, etc.
Create a predictive model using the aggregated data and key drivers. These models provide a broad forecast or prediction based on overall trends and patterns.
Break down the high-level predictions into smaller, more specific components. For EV adoption, this involves disaggregating the overall forecast to the level of substations or even circuits.
While the top-down approach offers multiple benefits such as simplified implementation, rapid decision-making, and a clear overview, it also has disadvantages, including a lack of detail and rigidity, making it less adaptable to changes or new information that emerges from the ground level.
For EV adoption, leveraging customer data such as load patterns and demographics can enhance predictions. A bottom-up approach utilizes
Empowering Transportation Electrification and Grid Planning 91
customer-level predictions to help utilities geographically identify when and where electric vehicles (EVs) will begin to appear or increase in number on the grid. These predictions can then be aggregated to the levels of transformers, circuits, and substations. This approach provides detailed analysis and is more adaptable and updatable with new data. However, developing such models requires the collection and processing of very granular - and therefore much larger - data. Consequently, it is more time-consuming, complex, and resource-intensive.
RESIDENTIAL CUSTOMERS VS NON-RESIDENTIAL CUSTOMERS Modeling for residential customers can differ significantly from modeling for non-residential customers, due to the following reasons:
1) Data are different. Data of electricity load are important predictors for utilities. Residential customers typically have peak electricity usage in the morning and early evenings when people are at home, using appliances, heating/cooling systems and lighting. In contrast, non-residential customers such as businesses, industrial facilities and government entities, usually have more consistent and predictable electricity patterns, often peaking during standard business hours. 2) The consumption patterns of residential customers often show significant seasonal variations, with higher usage in summer and winter due to heating and cooling needs. Consumption by non-residential customers is less affected by seasonal changes. 3) Residential load profiles are generally more variable and less predictable compared to non-residential customers. Non-residential customers tend to have higher base load due to much more space in facilities, continuous operations of equipment, lighting, and HVAC systems. 4) Many utilities leverage socio-demographic data such as age, income and education level to help with enhancing customer services and to improve overall customer satisfaction. Such data do not apply to non-residential customers. Due to differences in data availability and purposes, we lay out the frameworks for multiple models as follows:
- Detection models for residential customers and non-residential - Propensity models for residential customers and non-residential customers - Forecasting models for residential and non-residential customers.
While there is overlap in data sources, this paper outlines a blueprint for leveraging diverse data to create multiple predictive models tailored to different business needs.
MODLES EV Detection Models
An EV detection model can be highly beneficial for utilities in multiple ways. By identifying when and where EVs are charging, utilities can better
92 Lin and Fu
understand the impact on the grid and plan for immediate infrastructure upgrades to pre-empt some overloads. Utilities can also design targeted load- shifting programs to encourage off-peak charging, reducing strain on the grid during peak hours. With accurate data on EV usage, utilities can personalize communication and offer incentives for EV owners to participate in demand response programs.
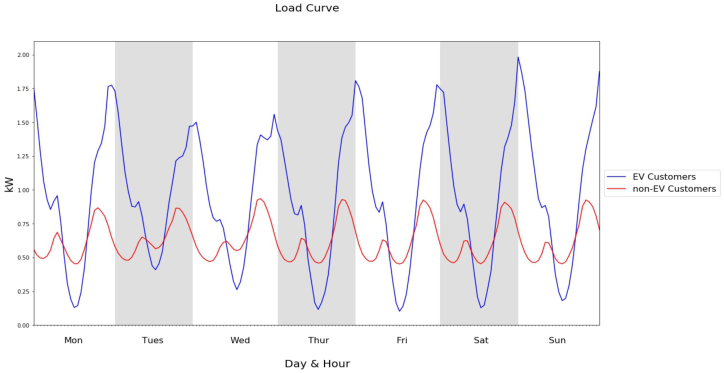
Most people charge their vehicles after work and try to stay away from peak hours to mitigate cost. Charging of an EV at home will cause a surge in the load as illustrated below. There are strong differences in the load curves between customers with EVs and those without.
Figure 1: Compare load curves of residential customers with EVs and without EVs.
Due to the strong difference in load patterns, features can be generated based on the differences in load, which can then serve as predictors for a detection model. This model can provide a rough estimate of where current residential customers with EVs are located and identify which parts of the circuit require attention or upgrades. Southern California Edison (SCE) has launched several programs to encourage customers to install electric chargers at home and offers rebates to those who have purchased or rented an electric vehicle. Additionally, a point-of-sale coupon was issued to customers purchasing an electric vehicle. These customers who applied for rebates constitute the target variable for our model. We can employ machine learning and deep learning methods to build the detection model. The model will generate a softmax score, resembling a probability score, for us to identify customers with higher scores as likely having EVs that are not yet detected by utilities (Lin et al., 2022).
Detection model for non-residential customers could be more challenging as load patterns between non-residential customers are much more diverse, due to differences in business types, operation hours, etc. Also, EV charging in a residential home usually causes a surge in the load, the same pattern might not be observed among non-residential customers as the base load
Empowering Transportation Electrification and Grid Planning 93
from normal business operation is usually quite high already. One feasible approach might be the following: As light-duty, medium-duty and heavy-duty vehicles are generally in use in daytime and being charged at night, we can expect the load patterns will experience significant changes at night. If a non-residential customer shows a significant difference between daily and nightly load, evening EV charging might lead to an increase in usage. We can compare loads from two timeframes: the current period and a period from the same season five or six years ago. If the nightly load in the current period consistently exceeds the load from the same time five or six years ago by a noticeable margin for at least a few hours, the non-residential customer can be suspected to have electric vehicles being charged on the premises.
For validating the detection models to identify existing EVs that are currently unknown to utilities, we can leverage data from local Department of Motor Vehicles (DMV), which includes all registered vehicles and identifies electric vehicles. Although we have received aggregated data at the zip code level, we can still perform validation by aggregating customer-level predictions to the zip code level and conducting a correlation analysis with the DMV’s aggregated data. Additionally, we can randomly select customers identified as having EVs and examine their load patterns to determine if they align with our expectations.
EV Propensity Models A propensity model predicts which customers are more likely to adopt electric vehicles in the near future. An immediate application of this model is to expand Time-of-Use (TOU) rates for managed charging, to decide optimal locations for installing public charging stations and to provide other infrastructure development in the near future.
We can use known and detected residential EVs as the target variable for building a propensity model. For residential customers, demographic data can be quite useful in predicting which segments are more likely to transition to electric vehicles. Research has found that younger generations, such as Gen Z and Millennials, show higher interest in EVs compared to older generations. Men are twice as likely to buy EVs as women. Since EVs are still more expensive than gas cars, households with higher incomes are more likely to consider this purchase (US Department of Energy, 2024). Apart from household-level data, aggregated data such as school quality and crime rate can be added to enhance the power of the model.
Agent-based theory can be creatively used to develop additional features for the propensity model and subsequent forecasting model. Agent-based theory is a framework that examines how individual actors, or agents, influence social, political, and economic systems. It emphasizes the importance of understanding the behavior of individual actors, who impact each other in significant decisions, such as purchasing an EV or installing solar panels on rooftops. Customers living in or passing through areas with EVs are more likely to be influenced to make similar purchases.
94 Lin and Fu
However, generating quantifiable features by using agent-based theory can be challenging. We suggest doing the following:
Demographic data, such as those provided by Acxiom, offer multiple composite clusters, including economic stability, income level and home price. A consumer passing through neighboring areas with more EVs is more likely to be influenced to buy an EV. By using the same set of demographic features, we can calculate the demographic similarity of one area to its neighboring areas. The influence of neighboring areas can be weighted by their population size, distance to the area in interest, etc.
The more homogeneous the customers in an area are, the more likely they will exhibit similar consumption behavior. We can refer to this as inner agent-based behavior, treating an area as containing multiple sub-areas where each sub-area indicates customers share similar socio- demographics and, consequently, similar consumption behavior. We can derive multiple features by using the standard deviations of various cluster variables as additional features for modeling.
Modeling commercial EV adoption requires distinct methods due to the different types of data available. Southern California Edison (SCE) has proactively engaged with non-residential customers, particularly those operating medium-duty and heavy-duty fleets. Through these efforts, the following data have been collected:
Those non-residential customers who have their charging ports energized for use.
Those non-residential customers who have their charging ports in design in collaboration with SCE.
Those non-residential customers who have made inquiries to SCE about electrification need.
The customers mentioned above have expressed varying levels of need and urgency for electrification. Their different stages of activity can be treated as ordinal target variables. SCE has a database that classifies almost all non-residential customers according to NAICS codes. The North American Industry Classification System (NAICS) is a standardized system used to classify businesses by industry for the purpose of collecting, analyzing, and publishing statistical data. From companies known to have shown interest in electrification, we can identify similar companies within the service territory and make projections accordingly. This approach enables us to identify the key drivers of commercial EV adoption and evaluate the pace and scale of EV diffusion across different sectors.
Although propensity model is still a classification model and the prediction is made at the customer level, we can aggregate customer-level prediction to circuit level or substation level for grid planning.
EV Forecasting Models Both detection models and propensity models generate customer-level predictions. Forecasting models are conducted at an aggregated level such
Empowering Transportation Electrification and Grid Planning 95
as circuits or substations. It differs from propensity model that a forecasting model usually contains a projection into the future with a clear time frame such as next five years, next ten years and beyond. Forecasting model anticipate which service areas will experience a greater rise in energy demand, thus requiring more attention.
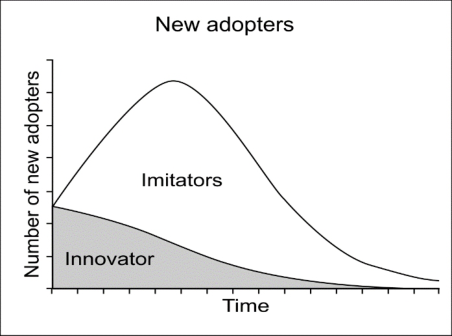
There are multiple ways to build a forecasting model. The challenge we have encountered is that there are very limited historical data we have. Therefore, the conventional forecasting such as based on time series data will not work well. Bass diffusion model is a good option to apply. This model offers a powerful way to understand and forecast how innovations spread over time (Bass, 1969).
Figure 2: Bass diffusion model.
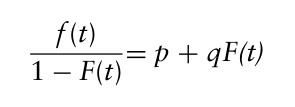
The Bass diffusion model has been extensively utilized across various industries to forecast product adoption, aiding in predicting trends and informing crucial business decisions. It has been applied to generate forecasting models for solar photovoltaic rooftop penetration and the electric vehicle market in Morocco, among others (Pratiwi et al., 2022; Avyyadi et al., 2018). In the realm of transportation electrification, the Bass diffusion model distinguishes between adopters and imitators. Adopters are those who readily embrace electric vehicles early on, often leading the market in electrification. Imitators, on the other hand, are influenced by the actions of innovators and their peers to transition to electric vehicles. The mathematical equation of the Bass Diffusion Model is as follows:
Equation reproduced from the original PDF.
where F(t): cumulative adoption function f(t): rate of adoption p: coefficient of innovators
96 Lin and Fu
q: coefficient of imitators When considered a s function of continuous density over time, the Bass diffusion equation can be written as follows:
n(t) = (p + qN(t)
m ) × (m −N (t))
where n(t): number of EVs in year or month N(t): cumulative number of EVs in year or month p: coefficient of innovators q: coefficient of imitators m: number of potential customers in the market The above equation will provide a framework for estimating EV adoption on a yearly or monthly basis. Given the limited historical data on EV adoption in our study, it is essential to combine optimal forecasting methods to achieve accurate results. Southern California Edison has obtained data from the California Department of Motor Vehicles on the number of electric vehicles registered across around 700 zip codes within its service area. These zip codes do not map well to around 600 substations in the service area, but we can apply data massage to run the allocation to aggregated EV ownerships to each substation. Doing this allows us to infer N(t) and n(t) over time. Additionally, by utilizing NAICS codes, we can identify which non-residential customers are likely to own fleets and determine their fleet sizes. Consequently, the number of potential consumers in the market, m, is known. Therefore, estimating the parameters p and q becomes crucial for successfully building a forecasting model.
We will apply Monte Carlo simulation to help to understand the trend of EV adoption among residential and non-residential customers. Monte Carlo simulation is a computational technique that uses repeated random sampling to model the probability of different outcomes in a process that involves uncertainty. The output shows the spectrum of probable outcomes for an uncertain scenario. This technique assigns multiple values to uncertain variables, obtains multiple results, and then takes the average of these results to arrive at an estimate. We can also use estimates in different positioning in a confidence interval as different scenarios generated by the simulation.
Government incentives often assist commercial customers in transitioning to electric vehicles by reducing the financial burden and supporting the development of necessary infrastructure. These programs significantly influence the speed and pace of EV adoption. However, the availability and stability of these incentives can fluctuate with changes in the political climate. Therefore, it is crucial to incorporate these considerations into the forecasting model by evaluating different scenarios.
Even though the forecasting model is not built at the customer level, the process can be quite complex. If grid planning is to be done at the substation level, the forecasting needs to be provided at the same level to meet the specific needs of each substation. Given that Southern California Edison operates over 600 substations, it is necessary to develop individual local models for each one.
Empowering Transportation Electrification and Grid Planning 97
CONCLUSION
This paper lays out a blueprint for a bottom-up approach to build detection models, propensity models and forecasting models of EV adoption among both residential customers and non-residential customers. Even though models for residential customers and non-residential customers are to be built separately, the prediction will be combined and aggregated to the levels of circuits or substations for grid planning. This integrated approach ensures that the unique characteristics and adoption patterns of each customer segment are accurately captured. By aggregating these predictions, utility companies can optimize grid infrastructure investments, enhance load management strategies, and support the seamless integration of electric vehicles into the power grid.
ACKNOWLEDGMENT
We would like to express our gratitude to the Digital & Process Transformation team at Southern California Edison for their inspiration and continuous support throughout this work. Special thanks to Weijue Wang of Wells Long LLC for offering valuable suggestions to enhance this paper.
REFERENCES
Ayyadi, S., Maaroufi, M. (2018), Diffusion Models For Predicting Electric Vehicles Market in Morocco2018 International Conference and Exposition on Electrical And Power Engineering (EPE), https://ieeexplore.ieee.org/ stamp/stamp.jsp?tp=&arnumber=8559858. Bass, F. (1969). “A new product growth for model consumer durables”. Management Science. 15 (5): 215–227. doi: 10.1287/mnsc.15.5.215. Brown, A., Electric Cars Will Challenge State Power Grids. The Pew Charitable Trusts (2020). Retrieved November 17, 2022, from https://www. pewtrusts.org/en/research-and-analysis/blogs/stateline/2020/01/09/electric-cars- will-challenge-state-power-grids. Lin, A. Z., James, A. (2022), Using Smart Meter Data and Machine Learning to Identify Residential Light-duty Electric Vehicles, 2022 IEEE Conference on Technologies for Sustainability (Sustech), https://ieeexplore. ieee.org/document/9794221. Osaka, S. (2022), It’s Common to Charge Electric Vehicles at Night That Will Be a
Problem. The Washington Post, https://www.washingtonpost.com/climate-envir onment/2022/09/22/its-common-charge-electric-vehicles-night-that-will-be-pro blem/. Osborne, H. (2024), How Much Oil is Left and Will We Ever Run Out?
LifeScience, https://www.livescience.com/planet-earth/how-much-oil-is-left-and- will-we-ever-run-out. PBS Science (2022), How electric vehicles and other transportation innovations could slow global warming, according to IPCC, Science, https://www.pbs.org/newshour/science/how-electric-vehicles-and-other- transportation-innovations-could-slow-global-warming-according-to-ipcc.
98 Lin and Fu
Pratiwi, A., Sasmono, S., Hariyanto, N. (2022), Solar Photovoltaic Rooftop Penetration Forecasting Through Bass Diffusion Model„ 2022 5th International Conference on Power Engineering and Renewable Energy (ICPERE), https://ieeexplore.ieee.org/stamp/stamp.jsp?tp=&arnumber=10037332. U. S. Department of Energy, Office of Electricity (2024), Impact of Electric Vehicles
on the Grid: Report to Congress, https://www.energy.gov/sites/default/files/2024- 10/Congressional%20Report%20EV%20Grid%20Impacts.pdf. Westbrook, J. (2022), Electric Vehicles Are Way, Way More Energy-Efficient Than Internal Combustion Vehicles, Ask MotorTrend, https://www.motortrend.com/n ews/evs-more-efficient-than-internal-combustion-engines/.
LISTED IN THE AHFE DIGITAL BOOKSTORE CATALOGUE
Explore the complete digital volume
Human Factors in Software and Systems Engineering
Read this individual research paper free through the original publisher, or explore the full digital proceedings book.
ISBN 978-1-964867-57-1
Explore this ISBN in the AHFE Bookstore ↗Listed in the July 2026 bookstore catalogue; search by ISBN to confirm current availability · Digital book purchase optional