Ruchi Kukde, Jaymeen Shah, Aindrila Chakraborty (2025). Data-Driven Insights into Diabetes-Related Hospital Readmissions in the United States: Trends and Predictors. In: Artificial Intelligence and Social Computing. AHFE Open Access, vol. 163, pp. 1–12. https://doi.org/10.54941/ahfe1006030
Hospital readmissions is a key metric of evaluating healthcare quality, efficiency of care coordination, discharge planning, and follow-up care. Readmissions, defined as a patient's re-hospitalization within a specified period, such as 30 days, are frequently associated with incomplete treatments, medication errors, or inadequate follow-up care. Diabetes-related hospitalizations which account for a significant percentage of these readmissions in the United States is a critical and rising concern to healthcare authorities and the number is increasing year by year. From 2016 to 2019, diabetes-related 30-day readmission rates consistently surpassed all-cause readmissions (readmissions due to any medical condition), averaging approximately 19.5% compared to 13.9%. Diabetes-related readmissions incurred substantial financial and emotional costs, with aggregate re-hospitalization costs rising from $11.23 billion in 2016 to $14.03 billion in 2019. These financial and emotional burdens on patients and healthcare systems highlight the importance of targeted interventions to mitigate risks associated with readmissions. With the growing availability of large-scale healthcare data repositories and computing resources, it is possible to address critical challenges involved in hospital readmissions using predictive analytics.This study utilizes the Healthcare Cost and Utilization Project (HCUP) Nationwide Readmissions Database (NRD) from 2016 to 2019 to develop machine learning (ML) models for predicting 30-day readmissions for diabetic patients. Using diverse attributes/factors such as patient demographics, hospital characteristics, payer type, and discharge disposition, this research explores how predictive modeling approach based on healthcare data repositories can generate actionable insights to improve diabetes-related patient outcomes. Independent predictors identified include payer type, disposition type, and median household income demonstrating significant predictive values across ML algorithms. Ensemble approaches such as Boosted Trees and Bootstrap Forest outperformed traditional methods, achieving Area Under Receiver Operating Characteristics (AUROC) scores of 0.7417 and 0.6978, respectively, while maintaining low misclassification rates (31.4% for Boosted Trees). These results highlight the potential of ML models trained on large-scale datasets to optimize care coordination. The findings of this study emphasize the importance of socioeconomic and institutional factors in predicting diabetes-related readmissions and the role of data-driven methodologies in advancing healthcare. This study contributes to the broader application of predictive analytics in healthcare offering scalable solutions to lower readmissions using healthcare data repositories. Future directions include the refinement of ML models and comparisons with existing studies to improve predictive accuracy and healthcare delivery for diabetic patients.
Hospital readmission is defined as a patient’s hospital visit or re- hospitalization after discharge within a specific period to the same or different medical institution (Wang and Zhu, 2022). Hospitalization often signifies the critical state of a patient’s health and the requirement for managed care within a medical setting. However, readmission is commonly perceived as a breakdown in care coordination, especially in transferring patients between facilities or to their homes within a specified timeframe, e.g. 30 days (Smeraglio et al., 2019). Consequently, hospital readmissions imply in-complete treatments, negligence from healthcare service providers (e.g., doctors, nurses), unsuccessful procedures, or medication errors during previous hospital visits (Wang and Zhu, 2022). Hospital readmissions pose dual challenges, financial and emotional, for patients and healthcare providers (Economic & Emotional Cost of Hospital Readmissions, 2021). With hospital readmissions resulting from diverse and complex factors and their associated socio-economic burden, their detailed assessment and critical analysis have been central to US healthcare research, and ‘hospital readmission’ is used as a key benchmark for studies (Centers for Disease Control and Prevention (CDC), 2022; United Health Foundation, 2021). A significant area of healthcare analytics research involves identifying and evaluating risk factors contributing to hospital readmissions among diabetic patients (Boreland et al., 2015, Kukde, Chakraborty, and Shah, 2024; Wang and Zhu, 2022). Diabetes is a growing global health concern, driven by aging populations, increased life expectancy, and lifestyle factors. Diabetes-related complications were the third most common cause of 30-day readmissions, contributing to 32% of total readmissions (Kukde, Chakraborty, and Shah, 2024; Weiss and Jiang, 2018). International Diabetes Federation (2021) reported 1.2 million children (0–19 years) and 537 million adults (20–79 years) living with either type 1 or type 2 diabetes and gestational diabetes affected 16.7% of pregnancies in 2021. By 2030, a minimum of 100 million individuals in the US alone are estimated to have diabetes (International Diabetes Federation, 2021).
With an average hospital stay of 4.66 days, diabetes-related hospitalizations cost $12.8 billion in 2018, raising concerns about increasing healthcare expenditure (Fingar and Reid, 2021). Table 1 presents a comparison of 30-day readmission rates for all-cause and diabetes- related hospital admissions from 2016 to 2019. Over the four-year period, diabetes-related index admissions increased by 11.3%, reflecting a significant rise in hospitalizations for diabetes complications. The 30-day all-cause readmission rate exhibited minor variations over the years, rising from 13.93% in 2016 to 14.02% in 2019. During the same period, diabetes-related 30-day readmissions remained significantly higher at approximately 19.5%.
Data-Driven Insights Into Diabetes-Related Hospital Readmissions in the United States 3
Table 1: Comparison of all-cause and diabetes-related index admissions and 30-day readmissions (2016–2019).
Table available in the original PDF paper.
Comparison 2016 2017 2018 2019 All cause index 28,072,376 28,319,988 28,189,009 28,145,595 admissions
All cause 30-day
3,909,429 3,930,405 3,914,470 3,946,573
readmissions All cause 30-day
13.93% 13.88% 13.89% 14.02%
readmissions rate Diabetes-related index
330,757 360,437 367,109 368,267
admissions Diabetes-related 30-day
64,404 70,739 70,956 70,530
readmissions Diabetes-related 30-day
19.47% 19.63% 19.33% 19.15%
readmissions rate
These trends highlight the urgent need for further exploration of socioeconomic and institutional factors influencing hospital readmissions and how data-driven methodologies can enhance healthcare strategies.
ROLE OF DATA-DRIVEN METHODOLOGIES IN ADVANCING HEALTHCARE Studies show that key risk factors for hospital readmissions include lower socioeconomic status, racial/ethnic minority status, comorbidities, insurance type, emergent or unplanned admissions, and prior hospitalizations (Rubin, 2015). Social determinants of health, including age, gender, and ethnicity, influence diabetes prevalence, with older adults (65+) exhibiting the highest rates at 29.2% in 2019 (CDC, 2022). Hospitals serving low-income patients and those with inadequate care facilities contribute significantly to higher readmission rates, emphasizing the need to lower hospital stays (Yu and Rouse, 2017; Chakraborty et al., 2021). Additionally, lifestyle factors such as smoking, obesity, and physical inactivity increase diabetes risks, while patient education, self-management strategies, and strong support systems have been found to improve disease management (CDC, 2022; Solberg et al., 2004; Trief et al., 2004; Sedor, 2006).
An important component of modern healthcare analytics is the application of data-driven methodologies, including predictive analytics and machine learning models, to improve decision-making, reduce readmission rates, lower readmission-related costs, and enhance post-discharge strategies (Kukde, Chakraborty, and Shah, 2024; Wang and Zhu, 2022). Mahmoudi et al. (2020) observed that prediction models utilizing electronic medical records demonstrated efficient predictive performance emphasizing the critical role of data-driven methodologies in hospital readmission risk assessment. Literature studies show that logistic regression models have been widely employed to assess readmission risks among patients with diabetes (Rubin et al., 2023; Timple and Kawar, 2022; Shaka, 2022; Vasireddy et al., 2021). Various machine learning (ML) approaches have been explored in
recent studies for analyzing healthcare data repositories to predict hospital readmissions (Parajuli, Parajuli, and Guragai, 2022). Shang et al. (2021) and Neto et al. (2021) analyzed diabetes-related hospital readmissions using ML techniques, applying different modeling approaches to the Health Facts Database (Cerner Corporation, US) from 1999–2008.
To gain deeper insights into diabetes-related hospital readmissions, this study utilized a large-scale healthcare data repository to explore the socioeconomic and institutional factors influencing patient outcomes. In this study, we analyzed the Healthcare Cost and Utilization Project’s Nationwide Readmissions Database (NRD) spanning 2016–2019 (Agency for Healthcare Research and Quality, 2020) to explore key factors influencing diabetes- related hospital readmissions, including patient demographics, hospital characteristics, payer type, and discharge disposition. Driven by the critical need to reduce preventable diabetes-related readmissions, this study examined: How can healthcare data repositories and advanced machine learning approaches be utilized to develop scalable, data-driven solutions for predicting and preventing 30-day hospital readmissions?
EXAMINING THE NRD DATASET: VARIABLE SELECTION AND DATA CHARACTERISTICS The Nationwide Readmissions Database (NRD), part of the Healthcare Cost and Utilization Project, provides nationally representative data on hospital readmissions for all ages, addressing a critical gap in healthcare research (Vuddanda et al., 2019). Developed through a Federal-State- Industry partnership and sponsored by the Agency for Healthcare Research and Quality (AHRQ), the NRD enables the study of readmission patterns, healthcare delivery, and patient outcomes at multiple levels (Agency for Healthcare Research and Quality, 2020). NRD datasets from 2016–2019 were utilized for this study. The primary outcome of interest was 30-day readmissions (Yes/No) in the NRD for patients hospitalized due to primary diagnosis of diabetes. Index admissions for diabetes-related hospitalizations were identified and filtered to include only patients over 18 years old, excluding elective hospitalizations. December hospitalizations were removed due to the lack of adjoining 30-day readmission period in NRD data, and cases involving in-hospital mortality were also excluded. The study cohort was defined using patient demographics, including age (groups: 18-44, 45-64, and 65+ years), sex, median household income, patient location, length of stay, total hospital charges, payer status, and discharge disposition to analyze readmissions. Additionally, hospital characteristics such as urban- rural location, hospital teaching status, bed size, and hospital control were used as covariates in the study.
ASSESSING HOSPITAL READMISSION RISK FACTORS: MACHINE LEARNING-BASED PREDICTIVE FRAMEWORK NRD data from 2016–2019 was analyzed using IBM SPSS Statistics 28 and RStudio 2023.06.0 to derive index admission and readmission variables.
Data-Driven Insights Into Diabetes-Related Hospital Readmissions in the United States 5
We specifically examined the categories: no readmissions and readmissions based on the index admission records that satisfied the inclusion criteria. The predictor variables were recoded and weighted analysis was conducted to obtain 100% of US hospitalizations and readmissions within a given year. Chi-square and ANOVA were used to understand the significance and differences in the characteristics of these variables. The level of significance was fixed at 0.05.
Prediction models based on multi-layer perceptron (MLP), radial basis function (RBF), random forest (RF), Naïve Bayes (NB), and decision trees (DT) were developed in this study. To explore ensemble techniques, both random forest and decision tree approaches were incorporated by utilizing bootstrapping and boosting methodologies with 5000 cross validations to gain valuable insights into the factors influencing readmission outcomes for diabetes patients. The study sample was randomly divided into training (70%) and testing (30%) sets. Class imbalance was observed in the original datasets, with the no-readmission class significantly outweighing the readmission class. To mitigate this bias and enhance machine learning classifier performance, data resampling techniques were applied. The area under the receiver operating characteristics curve (AUROC) and misclassification rates were utilized as the performance metrics for comparing these models.
Table 2: Baseline patient and hospital characteristics of diabetes-related index admissions categorized by 30-day readmissions from 2016–2019.
Table available in the original PDF paper.
SE p value
Variable Index Admission
30-day Readmission Total 1426570 276629
Age <0.001* 18–44 years 541324 (37.9%) 90857 (32.8%) 0.0011 45–64 years 515179 (36.1%) 107034 (38.6%) 0.0014 65+ years 370069 (25.9%) 78798 (28.4%)
Sex <0.001* Female 761696 (53.3%) 145403 (52.5%) 0.0009 Male 664875 (46.6%) 131226 (47.4%) 0.0010 194277 (67.9%) 0.0007 Disposition Type <0.0001* Routine 1008694 (71.7%)
144209 (10.1%) 39031 (13.6%) 0.0023
Transfer to other facility
68883 (4.8%) 14119 (4.9%) 0.0038
Home health care 197405 (13.9%) 38581 (13.4%) 0.0020 Against Medical Advice Payer Type <0.0001* Medicare 560784 (41.1%) 125689 (45.6%) 0.0011 Medicaid 371247 (27.2%) 84298 (30.6%) 0.0014 Private Insurance 309129 (22.6%) 49945 (18.1%) 0.0012 Self-pay 126169 (9.2%) 15852 (5.8%) 0.0021
Continued
Table 2: Continued
Table available in the original PDF paper.
SE p value
Variable Index Admission
30-day Readmission
115334 (8.1%) 22122 (7.2%) 0.0024
Patient Location <0.001* Central (metro)> 1M 384340 (26.9%) 84773 (27.7%) 0.0013 Fringe (metro) > 1M 340064 (23.8%) 81588 (26.9%) 0.0014 Metro 250K–999K 313126 (21.9%) 60867 (19.9%) 0.0015 Metro 50K–249K 138696 (9.7%) 29494 (9.6%) 0.0022 Micropolitan county 135010 (9.5%) 26839 (8.8%) 0.0022 Not metro / micro county <0.001* Median Household Income
Large Metropolitan 749374 (54.5%) 145450 (53.1%) 0.0009 Small Metropolitan 499484 (36.3%) 98876 (36.1%) 0.0011 Micropolitan 127326 (9.3%) 29446 (10.8%) 0.0021 Hospital Bed Size <0.001*
Small 281424 (19.7%) 51835 (18.5%) 0.0013 Medium 407356 (28.6%) 76610 (27.4%) 0.0012 Large 737790 (51.7%) 151493 (54.1%) 0.0009 To assess predictors of unplanned 30-day readmission, 1,426,571 patients were identified as index admissions for diabetes related complications from 2016–2019. There were 276,628 (19.8%) unplanned readmissions within a 30-day period. Table 2 presents the baseline patient demographics and hospital characteristics for the study cohort of total diabetes-related index admissions and corresponding 30-day readmissions for 2016– 2019. Multicollinearity tests were conducted to understand correlations among these predictor variables. The teaching status of hospitals was found to be correlated with urban-rural designation, patient location,
Data-Driven Insights Into Diabetes-Related Hospital Readmissions in the United States 7
and control/ownership of hospitals. Additionally, patient location was strongly correlated with urban-rural designation of hospitals. Among patient characteristics, there was a positive correlation between patients’ age and payer type and negative correlation between patients’ age and disposition type. Based on these analyses, independent predictor variables of payer type, disposition type, hospital teaching status, bed size, income, and sex were included for developing ML models for the prediction of 30-day readmissions.
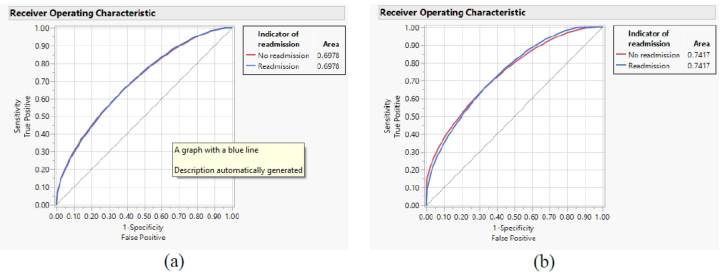
Evaluating Predictive Accuracy: AUROC and Error Analysis AUROC scores were obtained for different machine learning algorithms for the training and testing datasets. Table 3 shows the evaluation of AUROC values and misclassification rates for ML algorithms used for predictive modeling of 30-day readmissions in the US from 2016–2019. Among the methods used, the AUROC of neural network-based approaches: MLP (AUROC, 0.6075), RBF (AUROC, 0.6192), MLP with boosting and k-fold validation (AUROC, 0.6271) were significantly higher than NB model (AUROC, 0.6012). However, it was significantly lower than the DT based model (AUROC, 0.6709) and RF based model (AUROC, 0.6376). Using ensemble method of bootstrapping for RF based model and boosting for DT based model with 5000 cross validations, improved AUROC characteristics were achieved. There was significant increase in AUROC values for Bootstrap Forest (AUROC, 0.6978) and Boosted Tree (AUROC, 0.7417) over other predictive models. The AUROC characteristics for two models with improved performance over other methods are depicted in Fig. 1. The percentage of misclassifications was found to be approximately 34% for NB and RBF models, while it was approximately 35% for MLP based classification models. Slightly lower misclassification rates were observed for DT and RF-based methods. The misclassification rates were 0.332, 0.341, 0.330, and 0.314 for DT, RF, Bootstrap Forest, and Boosted Tree methods, respectively.
Table 3: Evaluation of AUROC and misclassifications of machine learning algorithms for predictive modeling of 30-day readmissions in the US from 2016–2019.
Table available in the original PDF paper.
Algorithm AUROC 95% CI Misclassification Rate Naïve Bayes (NB) 0.6012 0.5845–0.6089 0.348 Multilayer Perceptron (MLP) 0.6075 0.5935–0.6208 0.358 Radial Basis Function (RBF) 0.6192 0.6087–0.6203 0.349 MLP with boosting and k-fold
0.6271 0.6199–0.6324 0.353
validation (k = 10) Decision Trees (DT) 0.6709 0.6644–0.6865 0.332 Random Forest (RF) 0.6376 0.6254–0.6432 0.341 Bootstrap Forest (5000 cross
0.6978 0.6803–0.7218 0.330
validations) Boosted Tree (5000 cross
0.7417 0.7356–0.7478 0.314
validations)
Figure 1: Comparison of AUROC results for ensemble methods: (a) Bootstrap Forest and (b) Boosted Tree for predicting 30-day readmissions in the US from 2016–2019.
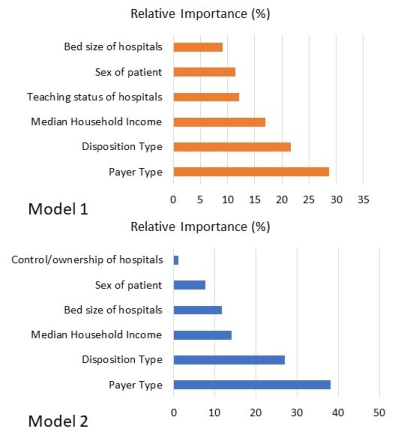
Identifying Key Predictor Variables Using ML Models The importance of predictor variables in ML-based models was evaluated to identify key factors influencing 30-day readmissions. Three most important variables were identified as disposition type, payer type, and median household income for predicting readmission rates. In addition, the sex of the patient, and hospital bed size were found to be relatively important for predicting 30-day readmissions. Since hospital control/ownership was correlated with hospital teaching status, one of these variables was included in the ML model at a time. These two models were developed using the boosted tree approach and compared to understand the relative importance of predictor variables. As shown in Fig. 2, in Model 1, the relative importance of payer type, disposition type, median household income, hospital teaching status, sex of patient and bed size of hospitals was obtained as 28.7%, 21.69%, 17%, 12.15%, 11.37%, and 9.1%, respectively. After including control/ ownership of hospitals instead of hospital teaching status, the importance of payer type, disposition type, median household income, bed size of hospitals, sex of patient, and teaching status were found as 38.16%, 26.93%, 14.15%, 11.81%, 7.79%, and 1.17%, respectively. The significance of insurance status and discharge disposition was predominantly evident through these models for 30-day readmission risk in the cohort studied.
Payer type emerged as the strongest predictor of hospital readmissions, contributing 28.7% in Model 1 and 38.16% in Model 2. These findings highlight their critical role in informing policymakers, healthcare providers, and insurers to develop policies aimed at reducing readmission rates. Disposition type was among the top three predictors indicating that post- discharge placement significantly influences the risk of readmission. The predictive models identified median household income as a significant factor that aligns with existing evidence of healthcare disparities and poorer outcomes among low- and middle-income groups (Milto et al., 2022), emphasizing the need for targeted interventions to address socioeconomic inequalities in healthcare.
Data-Driven Insights Into Diabetes-Related Hospital Readmissions in the United States 9
Figure 2: Comparison of relative importance of predictor variables for Boosted Tree models for predicting 30-day readmissions in the US from 2016–2019.
Strengths, Limitations, and Future Work A key strength of this study is its use of nationwide datasets, covering 97% of the U.S. population, enabling a comprehensive analysis of diabetes-related hospitalizations. The large sample size and nationally representative data provide deeper insights into 30-day readmissions. Unlike previous studies that examined individual factors in isolation, this study takes a holistic approach by integrating patient demographics, healthcare system variables, and socioeconomic factors to offer a more comprehensive understanding of diabetes-related hospital readmissions. However, the NRD used in this study does not include race/ethnicity data, limiting the ability to assess health disparities for 30-day readmissions. Additionally, some predictor variables had low-frequency classification categories, necessitating their exclusion to maintain the reliability of statistical estimates in the models. Diabetes is a complex condition with comorbidities and complications. While this study provides a detailed analysis of patient demographics, hospital characteristics, and readmission rates, further research directions may include exploring comorbidities, lab results, and treatment history as independent predictors and focus on reducing healthcare disparities to improve patient outcomes. Future work could compare the results of ML models in this study with various other models available in the literature to enhance the understanding of risk factors for readmissions. Additionally, incorporating robustness checks on model assumptions and evaluating alternative approaches would reinforce the reliability and applicability of the findings.
CONCLUSION
Hospital readmissions, particularly for diabetes-related complications, present a major challenge for healthcare systems, requiring data-driven solutions for effective management. This study utilized the Healthcare Cost and Utilization Project (HCUP) Nationwide Readmissions Database (NRD) from 2016 to 2019, applying machine learning models to predict 30-day diabetes-related readmissions. Findings indicate that socioeconomic factors such as payer type and median household income, and discharge disposition significantly influence readmission risks. Machine learning algorithms, particularly ensemble models, demonstrated superior predictive performance, with Boosted Trees achieving an AUROC of 0.7417. Results highlight the importance of large-scale healthcare datasets and predictive analytics for enhancing healthcare decision-making with the aim of improving patient outcomes and reducing readmissions. Future research directions include enhancing predictive models by incorporating clinical factors such as comorbidities, lab results, and treatment history to improve hospital readmission risk assessment.
REFERENCES
Agency for Healthcare Research and Quality (AHRQ) (2020) ‘Healthcare Cost and Utilization Project (HCUP)’, Agency for Healthcare Research and Quality. Available at: https://www.hcup-us.ahrq.gov/ (Accessed: 6 September 2023). Boreland, L., Scott-Hudson, M., Hetherington, K., Frussinetty, A., and Slyer, J. T.
(2015) The effectiveness of tight glycemic control on decreasing surgical site infections and readmission rates in adult patients with diabetes undergoing cardiac surgery: A systematic review’, Heart & Lung, 44, pp. 430–440. doi: 10.1016/ j.hrtlng.2015.06.004. Centers for Disease Control and Prevention (CDC) (2022) National Diabetes Statistics Report’, CDC Diabetes Data and Research. Available at: https:// www.cdc.gov/diabetes/php/data-research/index.html (Accessed: 13 December 2024). Chakraborty, A., Pearson, O., Schwartzkopff, K. M. et al. (2021) ‘The effectiveness
of in-hospital interventions on reducing hospital length of stay and readmission of patients with type 2 diabetes mellitus: A systematic review’, Diabetes Research and Clinical Practice, 174, p. 108363. Economic & Emotional Cost of Hospital Readmissions (2021). HealthStream Blog. Available at: https://www.healthstream.com/resource/blog/the-economic- emotional-cost-of-hospital-readmissions (Accessed: 25 January 2025). Fingar, K. R. and Reid, L. D. (2021) Diabetes-related inpatient stays, 2018’, HCUP Statistical Brief #279. Agency for Healthcare Research and Quality (AHRQ). Available at: https://hcup-us.ahrq.gov/reports/statbriefs/sb279- Diabetes-Inpatient-Stays-2018.jsp (Accessed: 12 January 2025). International Diabetes Federation (2021). IDF Diabetes Atlas. Brussels, Belgium:
International Diabetes Federation. Available at: https://diabetesatlas.org/atlas/ tenth-edition (Accessed: 9 February 2024). Kukde, R. D., Chakraborty, A. and Shah, J. (2024) A systematic review of recent studies on hospital readmissions of patients with diabetes’, Cureus, 16(8), e67513. doi: 10.7759/cureus.67513.
Data-Driven Insights Into Diabetes-Related Hospital Readmissions in the United States 11
Mahmoudi, E., Kamdar, N., Kim, N., Gonzales, G., Singh, K. and Waljee, A. K.
(2020) Use of electronic medical records in development and validation of risk prediction models of hospital readmission: Systematic review’, BMJ, 369, p. m1794. Milto, A. J., El Bitar, Y., Scaife, S. L., & Thuppal, S. (2022) ‘Differences in hospital length of stay and total hospital charge by income level in patients hospitalized for hip fractures’, Osteoporosis International, 33(5), pp. 1067–1078. Neto, C., Senra, F., Leite, J., Rei, N., Rodrigues, R., Ferreira, D. and Machado, J.
(2021) ‘Different scenarios for the prediction of hospital readmission of diabetic patients’, Journal of Medical Systems, 45(1), p. 11. doi: https://doi.org/10.1007/ s10916-020-01686-4. Parajuli, S., Parajuli, S. and Guragai, M. K. (2022) ‘A data-driven approach to predict the risk of readmission among patients with Diabetes Mellitus’, 2022 2nd International Conference on Artificial Intelligence and Signal Processing (AISP), pp. 1–7. Rubin, D. J. (2015) Hospital readmission of patients with diabetes, Current Diabetes
Reports, 15, p. 17. Rubin, D. J., Maliakkal, N., Zhao, H. and Miller, E. E. (2023) ‘Hospital readmission risk and risk factors of people with a primary or secondary discharge diagnosis of diabetes’, Journal of Clinical Medicine, 12, p. 1274. Sedor, J. R. (2006) ‘Frontiers in diabetic nephropathy: can we predict who will get
sick?’, Journal of the American Society of Nephrology, 17, pp. 336–338. Shaka, H. (2022) ‘Economic disparities among pediatric diabetic ketoacidosis readmissions in the U.S.’, Diabetes Care, 45, pp. 0–7. Shang, Y., Jiang, K., Wang, L., Zhang, Z., Zhou, S., Liu, Y., Dong, J. and
Wu, H. (2021) ‘The 30-days hospital readmission risk in diabetic patients: Predictive modeling with machine learning classifiers’, BMC Medical Informatics and Decision Making, 21(Suppl 2), p. 57. doi: https://doi.org/10.1186/s12911- 021-01423-y. Smeraglio, A., Heidenreich, P. A., Krishnan, G., Hopkins, J., Chen, J. and Shieh, L.
(2019) Patient vs. provider perspectives of 30-day hospital readmissions’, BMJ Open Quality, 8, pp. e000264. doi: 10.1136/bmjoq-2017-000264. Solberg, L. I., Desai, J. R., O’Connor, P. J., Bishop, D. B. and Devlin, H. M. (2004) ‘Diabetic patients who smoke: Are they different?’, Annals of Family Medicine, 2, pp. 26–32. Timple, V. S. and Kawar, L. N. (2022) ‘Readmission predictors in patients with type II
diabetes’, Journal of Nursing Care Quality, 37, pp. 342–348. Trief, P. M., Ploutz-Snyder, R., Britton, K. D. and Weinstock, R. S. (2004) ‘The relationship between marital quality and adherence to the diabetes care regimen’, Annals of Behavioral Medicine, 27, pp. 148–154. United Health Foundation (2021). America’s Health Rankings. Available at: https://www.americashealthrankings.org/learn/reports/2021-senior-report-2/ appendix-measures-table (Accessed: 30 September 2024). Vasireddy, D., Sehgal, M. and Amritphale, A. (2021) ‘Risk factors, trends, and
preventive measures for 30-day unplanned diabetic ketoacidosis readmissions in the pediatric population’, Cureus, 13, p. 0. Vuddanda, V., Turagam, M., Umale, N., Shah, Z., Lakkireddy, D., Bartus, K. and EK, H. (2019) ‘Incidence and causes of in-hospital outcomes and 30-day readmissions after percutaneous left atrial appendage closure: A US nationwide retrospective cohort study using claims data’, Heart Rhythm, pp. 374–382.
Wang, S. and Zhu, X. (2022) ‘Predictive modeling of hospital readmission: Challenges and solutions’, IEEE/ACM Transactions on Computational Biology and Bioinformatics, 19, pp. 2975–2995. doi: 10.1109/TCBB.2021.3089682. Weiss, A. J. and Jiang, H. J. (2018) Overview of clinical conditions with frequent
and costly hospital readmissions by payer. Available at: http://us.ahrq.gov/ reports/statbriefs/sb278-Conditions-Frequent-Readmissions-By-Payer-2018.jsp (Accessed: 18 April 2024). Yu, Z. and Rouse, W. B. (2017) ‘A deeper look at the causes of hospital readmissions’, Proceedings of the 2017 IEEE International Conference on Industrial Engineering and Engineering Management (IEEM 2017), pp. 919–923.
LISTED IN THE AHFE DIGITAL BOOKSTORE CATALOGUE
Explore the complete digital volume
Artificial Intelligence and Social Computing
Read this individual research paper free through the original publisher, or explore the full digital proceedings book.
ISBN 978-1-964867-39-7
Explore this ISBN in the AHFE Bookstore ↗Listed in the July 2026 bookstore catalogue; search by ISBN to confirm current availability · Digital book purchase optional