Soo Yun Kim, Qiwen Zhao, Iain Lowe, Christi Wilbert (2026). Beyond Visuals: Addressing Cognitive Load and Usability Challenges in an Enterprise Mobile Application Design. In: Usability and User Experience. AHFE Open Access, vol. 232, pp. 121–131. https://doi.org/10.54941/ahfe1008041
Enterprise organizations rely on mobile dashboards to support performance monitoring and decision making (Few, 2013). They are expected to provide timely access to critical metrics, enable situational awareness, and support fast-paced decision making across distributed teams. However, as enterprise systems evolve and data volume increases, these dashboards often become difficult to interpret. Although the project was initially framed as a visual update, early research pointed to deeper challenges related to usability, information architecture, data comprehension, and workflow alignment. Through a multi-phase mixed-methods research program with 81 enterprise sales users, the study surfaced recurring workflow misalignments, information architecture barriers, and role-dependent information needs that hindered day-to-day use. This program included interviews, surveys, and iterative usability testing. The findings show how user research reframed the problem space, challenged long-held assumptions, and informed design exploration toward clearer data presentation and more effective decision support. This case study highlights the role of user research in revealing systemic experience issues within complex enterprise mobile applications. It also offers insights for designing data-intensive tools that better support how users actually interpret and act on data in mobile contexts.
As enterprise systems grow and data volumes rise, mobile dashboards are becoming increasingly difficult to interpret, especially in large organizations that depend on them for performance monitoring and decision making. Users often face the challenge of quickly translating dense metrics and unfamiliar terminology into actionable decisions, which imposes significant cognitive load (Sweller, 1988). This challenge is amplified in mobile contexts, where interactions occur in short, fragmented moments, often between other tasks (Wickens, 2008).
This paper presents a user research–driven case study of My Business Reports (MBR), an internal enterprise sales reporting mobile application in use at Cisco. Although the project began as a visual redesign, early research revealed that the primary challenges were structural rather than aesthetic,
centered on usability, information architecture, data comprehension, and workflow alignment, rather than purely visual.
As findings emerged, the project shifted from a visual update to a deeper exploration of users’ cognitive constraints (Beyer & Holtzblatt, 1998).
CONTEXT AND BACKGROUND Overview of the MBR Platform and Mobile Application
MBR is Cisco’s internal, access-controlled enterprise reporting platform and serves as the primary source for sales bookings data. It supports sales teams and leadership in tracking performance, monitoring trends, and assessing progress toward business goals. Within this ecosystem, the MBR mobile application provides on-the-go access to key sales metrics, allowing users to review performance data outside of desktop environments.
The mobile application is primarily used by enterprise sales representatives, sales leaders, and executives who require quick access to booking information in time-constrained contexts, such as between meetings, during travel, or in preparation for customer conversations. These usage patterns place a strong emphasis on clarity, speed, and up-to-date information, as users often have limited time and attention and need confidence that the data they are viewing reflects the current state of the business.
Initial Project Framing and Expectations The project began in response to executive feedback that, while the app’s data was valuable, the mobile experience felt outdated and difficult to use. The initial request focused on modernizing the app’s visual appearance, based on the assumption that improved aesthetics would lead to higher satisfaction and adoption.
Internally, the effort was referred to as an “MBR rebrand,” reflecting a belief that usability issues stemmed primarily from surface-level visual complexity rather than deeper challenges related to information structure or workflow alignment.
Enterprise Constraints and System Complexity As the team began to explore the existing experience, it became clear that the application operated within significant enterprise constraints. The product was built on legacy data structures and tightly coupled backend systems that limited flexibility in how information could be labeled, organized, or transformed. Many dataset names and metrics were passed directly from source systems, reflecting internal business logic rather than user mental models.
These constraints restricted the team’s ability to make certain changes without substantial engineering effort or architectural updates. Features such as role-based personalization, customizable dashboards, or simplified metric naming were difficult to implement within the current technical framework. Visual updates alone could not resolve many of the usability issues.
Beyond Visuals: Addressing Cognitive Load and Usability Challenges 123 Rationale for a User Research–Driven Approach
Although the project began as a visual redesign, early exploration and stakeholder discussions indicated that the core challenges extended beyond visual presentation. Given the complexity of the enterprise environment and system constraints, user research examined real user workflows, identified where assumptions broke down and showed how users interpreted metrics and navigated dashboards in everyday use.
RESEARCH METHODOLOGY Research Goals
The primary goal of this research was to understand real user workflows, pain points, and information needs for the MBR mobile application to inform user-centered design improvements (Norman & Draper, 1986). Rather than accepting the initial organizational framing of the project as a visual update, the research aimed to uncover deeper systemic usability issues, information architecture challenges, and gaps between expected and actual workflows.
Research Design and Methods A sequential, mixed-methods approach was used consisting of five interconnected studies conducted over a seven-month period (March 2025 – October 2025). The research progressed through three phases: exploratory qualitative inquiry, quantitative feature prioritization, and iterative comparative usability testing with findings from each phase informing subsequent studies.
Phase 1: Exploratory Research (Study 1) Semi-structured user interviews (N = 9) to understand user personas, workflows, and key pain points.
Phase 2: Feature Prioritization (Study 2) Kano Analysis survey (N = 32) to prioritize features based on their impact on user satisfaction (Kano et al., 1984; Berger et al., 1993).
Phase 3: Iterative Usability Testing (Studies 3-5) o Study 3: Moderated usability testing (N = 16) using a within-subjects design to evaluate filter and data refresh interface alternatives. o Study 4: Unmoderated performance testing (N = 15) conducted via Maze to compare alternative search interfaces using quantitative task metrics. o Study 5: Moderated usability testing (N = 9) using a within-subjects design to evaluate table and card-based data presentation.
Participant Characteristics Across all studies, participants were current users of the MBR mobile application representing diverse sales-related roles, including sales leaders, directors, account executives, account managers, renewal managers, and solution engineers. The total sample size (N = 81) included participants across the five studies, with participants from the United States, Colombia, Germany, Canada, Sweden, Austria, and the United Arab Emirates.
Data Collection and Analysis Approach All research was conducted in compliance with ethical guidelines, and informed consent was obtained from all participants, including permission for session recording. Qualitative data were analyzed using thematic analysis, while quantitative data from surveys and task metrics were analyzed using descriptive statistics and comparative methods (Braun & Clarke, 2006; Ericsson & Simon, 1980). Usability testing observations were coded to identify interaction issues and navigation patterns. To strengthen rigor, the studies used counterbalancing, within-subjects designs, and mixed-methods triangulation (Keppel & Wickens, 2004; Creswell & Plano Clark, 2018).
Limitations Several limitations should be acknowledged. Participants were internal organizational users, which may limit generalizability to external contexts, although findings remain relevant for similar enterprise applications. Sample sizes ranged from N = 9 to N = 32, reflecting the specialized user population, though the multi-study, mixed-methods approach helped mitigate this limitation.
In addition, most studies primarily sampled U.S.-based users, and evaluations focused on prototype interfaces rather than fully implemented systems, which may not capture long-term usage patterns.
KEY RESEARCH FINDINGS Overview
Across five studies (>80 participants), the same patterns appeared repeatedly across methods and samples, suggesting these issues were consistent across users rather than tied to a single study. Findings are presented by theme, with study details included where they clarify interpretation.
Workflow Assumptions vs. Actual Use Mobile Drill-Down and Detail Access Requirements
A critical mismatch emerged between how the product team envisioned mobile usage and how users actually interacted with the application. The design assumption was that mobile use cases centered on quick summary checks, with detailed exploration reserved for desktop environments. The data did not support this assumption.
Beyond Visuals: Addressing Cognitive Load and Usability Challenges 125 Users consistently required the ability to drill down from summary metrics to detailed information directly on mobile devices. This included reviewing individual transactions, examining specific performance data, and verifying information in real time. These interactions were not edge cases but core workflow needs, particularly in time-sensitive contexts such as customer meetings, field work, and rapid decision-making.
Role-Based Information Access and Navigation Needs Research also revealed systematic differences in information needs and navigation patterns by organizational role. Supervisory users required efficient comparison across teams or organizational units, yet accessing this information often required multiple navigation steps. Individual contributors prioritized rapid access to their own performance data and customer-specific information.
These role-based differences indicate that enterprise applications serving heterogeneous user groups require flexible, role-aware navigation structures rather than a single, prescriptive workflow, which directly motivates the navigation simplification described in Section 5.
Information Architecture and Terminology Barriers Terminology and Label Confusion
Across all studies, users encountered consistent difficulty interpreting application terminology and labels, revealing a fundamental information architecture problem. Many dataset names and metrics were passed directly from source systems, reflecting internal business logic rather than user mental models, which constrained how labels could be simplified or reorganized. Problematic terms included terms such as “Actuals,” (unclear that this controlled overall data view filtering) “Business Entity” (lacking clarity), “FMV” (Full Market Value, unfamiliar even to experienced users), and “Services” (ambiguous whether referring to Services Annual or Services TCV).
The Data View filter illustrated this problem clearly. When attempting to access options such as AI Infrastructure, Buying Programs, or Recurring Software, participants did not expect these to appear under the “Actuals” dropdown. The label failed to communicate that it governed the global data context rather than a specific metric. During redesign usability testing (N = 16), this mismatch was consistently identified as a critical usability issue.
Low Feature Adoption Despite High Perceived Value User testing revealed that several high-value features were underutilized due to limited discoverability. The bookmark/save filters feature exemplified this issue. When demonstrated during testing, participants immediately recognized its usefulness and described clear scenarios where it would help (e.g., “A Sales Director applies the same three filters every time”). However,
actual usage remained low, indicating insufficient visibility during everyday use. This directly informed the Section 5 navigation changes that prioritize clearer entry points and more visible pathways to high-value functions.
Mobile-Specific Usability Challenges Information Density and Navigation Constraints
Limited screen real estate created cascading usability problems in mobile contexts. Study 5 (N = 9) found that dense table views required extensive scrolling in multiple directions, and touch interaction challenges compounded the difficulty—intended taps on interactive elements frequently triggered scrolling instead, preventing accurate selection. These constraints underscore the critical need to prioritize immediately visible information and minimize interaction depth, principles that guided the filter interaction and navigation redesign in Section 5.
Usage Frequency and Mobile Context The high frequency and time-sensitive nature of mobile usage amplified the impact of usability friction. Participants checked the application 5–6 times daily during normal periods, escalating to up to 50 checks daily at peak times. Every additional tap, scroll, or moment of confusion directly impeded users’ work objectives, underscoring the critical importance of immediately visible information and minimal interaction depth—principles that guided the filter interaction and navigation redesign in Section 5.
Speed and Efficiency as Critical Success Factors Across all studies, speed and efficiency consistently emerged as central factors in mobile use, reflecting the time-sensitive nature of sales workflows. Participants repeatedly prioritized interaction patterns that minimized steps and reduced interpretation time.
In filter usability testing (N = 16), switch-based controls were strongly preferred over dropdown menus for WTD/MTD/QTD selection because they enabled faster toggling and clearer state awareness. Abbreviated labels (WTD, MTD, QTD) were also favored over full terms, highlighting the importance of rapid recognition in mobile contexts.
A similar pattern appeared in search interactions. In comparison testing (N = 15), participants favored designs that minimized steps and enabled faster access to results, even when those designs appeared less visually streamlined.
These findings indicate that enterprise mobile design should prioritize minimal interaction depth, workflow-aligned defaults, and persistent preferences to support efficiency in everyday use, which directly informed the shift toward high-visibility navigation and low-friction filter controls in Section 5.
Beyond Visuals: Addressing Cognitive Load and Usability Challenges 127 Summary: Systemic Themes Across the studies, five recurring themes stood out:
Workflow-Centered Design Misalignment: Product team assumptions about how mobile would be used diverged substantially from actual user workflows, particularly regarding drill-down to detail-level information.
Discoverability Challenges: Valuable features fail to achieve adoption if users are unaware of them or unclear about access points.
Role-Based Heterogeneity: Information needs differed by role, requiring flexible interface strategies.
Speed as Primary Metric: For time-sensitive mobile usage, efficiency trumps aesthetic polish or interface simplicity.
Information Architecture Issues: Problems with labeling, terminology, and mental model alignment create barriers to effective use that cannot be resolved through visual design alone.
These findings demonstrate that the initial framing of the project as a visual aesthetic update substantially underestimated the real user experience challenges. Research-driven problem definition revealed that systemic issues related to information clarity, mental model alignment, and workflow support required addressing before aesthetic improvements would meaningfully improve the user experience.
RESEARCH DRIVEN DESIGN IMPLICATIONS User research conducted for the MBR mobile application changed how the team understood and approached the design problem. Instead of confirming assumptions about visual complexity, the research showed that the primary challenges stemmed from cognitive burden, information structure, and misalignment between system design and real-world usage. These insights clarified that the core design challenges lay in comprehension, trust, and decision support, not visual presentation.
Reframing the Design Problem Initially, usability issues were approached as consequences of outdated visual design. However, interviews and usability testing showed that users struggled not because of visual styling alone, but because the system required continuous translation of dense data without sufficient context. Participants expressed uncertainty about where to find relevant information, which dashboards to trust, and how to interpret metric changes over time.
The design problem was reframed from “simplifying the interface” to reducing cognitive effort during sensemaking. The team recognized that meaningful improvement required restructuring information flows and interaction patterns rather than refining visual aesthetics alone.
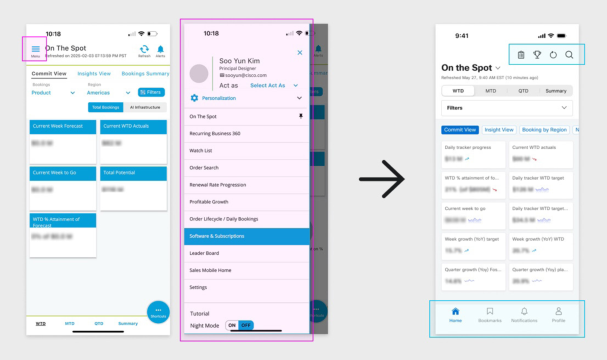
Navigation as a Cognitive Structure Research findings revealed significant navigation challenges. Many users were unaware of key navigational elements, such as the horizontal menu or left-side navigation, or misunderstood their purpose. The coexistence of multiple navigation paradigms created ambiguity, increasing cognitive load and discouraging exploration.
Design implications focused on simplifying navigation hierarchies and clarifying entry points to core dashboards. Rather than exposing users to an extensive set of options, the redesigned navigation prioritized the most frequently used views and aligned menu structures with users’ mental models. This shift emphasized predictability and discoverability over flexibility, enabling faster orientation and reducing unnecessary decision points.
Figure 1: Refining navigation to reduce cognitive load: original (left) vs. redesigned (right) evaluated in usability testing. The redesign consolidates navigation of entry points and reduces redundant controls identified during Study 3.
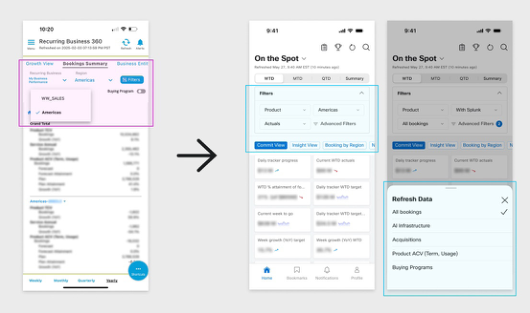
Filter Interaction and Task Efficiency Filtering emerged as a critical interaction pattern in frequent, time-sensitive workflows. Research showed a strong preference for interaction mechanisms that enabled quick toggling and immediate feedback over dropdown-based configurations. Dropdown menus disrupted workflow continuity and obscured active states, making it difficult for users to understand how data views were constructed.
In response, filter interactions were redesigned to foreground commonly used controls, persistently display active filters, and support reuse of preferred configurations. These changes reduced interaction cost while supporting fast data verification and reinforcing user confidence in the system.
Figure 2: Comparison of the original filter interaction (left) and redesigned filter and refresh interaction (right). The redesigned interface consolidates filtering controls into a single, persistent entry point and introduces a dedicated bottom sheet for data refresh, reducing interaction steps and improving clarity in time-sensitive mobile use.
From Presentation to Understanding These design implications emphasized supporting understanding and confident action rather than visual presentation alone. Design decisions remained grounded in observed workflows rather than assumptions.
DISCUSSION
Research Insights into Organizational Assumptions In the MBR mobile app project, user research revealed clear gaps between organizational assumptions and actual mobile use. As in many enterprise environments, the mobile experience had evolved largely as a scaled-down version of desktop workflows, rather than being intentionally designed for mobile contexts. Within this framing, system complexity was often treated as unavoidable, and usability issues were commonly attributed to training rather than design.
Research findings challenged this framing. Features considered central by stakeholders were frequently underused or misunderstood, while users relied on workarounds to complete routine, time-sensitive tasks. Grounding design discussions in observed behavior clarified the importance of mobile-specific design elements, including rapid comprehension and low interaction cost.
Human Factors in Data-Intensive Mobile Systems The research reveals that high interaction costs in the original design led to cognitive tunneling, where users relied on workarounds for time-sensitive tasks instead of utilizing complex features. This underscores that for enterprise mobile systems, usability is defined by minimal interaction effort. By reducing extrinsic cognitive load (Sweller, 1988) through simplified navigation and controls, the redesign allows users to maintain situational awareness and interpret dense data effectively even under the “fragmented attention” (Wickens, 2008) inherent in mobile environments.
Transferable Lessons for Enterprise Design While the work focuses on a single enterprise application, these patterns are likely to appear in other internal dashboards and reporting tools. The findings suggest that many usability issues labeled as visual or aesthetic are, in fact, structural and cognitive in nature. Even within the constraints of legacy systems, a research-driven approach can uncover opportunities to improve clarity, efficiency, and decision support without requiring large-scale technical re-architecture.
LIMITATIONS AND FUTURE WORK This work focuses on a single enterprise mobile application within a specific organizational context, which limits the generalizability of the findings. Despite this scope, the findings remain relevant to broader enterprise mobile experiences. The research surfaced user expectations and interaction patterns characteristic of mobile use that were not adequately supported by the existing system.
Fully addressing these expectations would require substantial changes to underlying data structures and technical architecture, which were beyond the scope of the project. The work therefore focuses on design opportunities that fit within current constraints, rather than proposing a full system re-architecture.
Future work may examine longer-term usage to better understand how redesigned, personalized, and real-time interactions influence learning, trust, and decision-making over time. Longitudinal methods and embedded analytics could provide deeper insight into how enterprise mobile applications integrate into the daily workflows of different sales roles. Further exploration of AI-driven insights and decision support within trusted mobile experiences also represents a promising direction for continued investigation.
CONCLUSION
The MBR mobile app project demonstrates that improvements in enterprise mobile usability depend less on visual refinement than on cognitive clarity. In everyday mobile use, the most significant barriers were navigation complexity, information structure, and limitations in decision support, rather than visual design itself.
By grounding the work in observed user behavior, the team was able to identify and address systemic experience issues within the constraints of a complex enterprise environment. This case highlights how user research can inform design decisions that lead to practical and sustainable improvements in data-intensive mobile applications, beyond surface-level visual change.
ACKNOWLEDGMENT
The authors would like to thank the participants and subject matter experts who generously shared their time and insights throughout the research process.
REFERENCES
Berger, C., Blauth, R., Boger, D., Bolster, C., Burchill, G., DuMouchel, W., ... & Walden, D. (1993). Kano’s methods for understanding customer-defined quality. Center for Quality Management Journal, 2(4), 3–36. Beyer, H., & Holtzblatt, K. (1998). Contextual design: Defining customer-centered
systems. Morgan Kaufmann. Braun, V., & Clarke, V. (2006). Using thematic analysis in psychology.
Qualitative Research in Psychology, 3(2), 77–101. https://doi. org/10.1191/1478088706qp063oa Creswell, J. W., & Plano Clark, V. L. (2018). Designing and conducting mixed methods research (3rd ed.). Sage. Ericsson, K. A., & Simon, H. A. (1980). Verbal reports as data. Psychological Review,
87(3), 215–251. https://doi.org/10.1037/0033-295X.87.3.215 Few, S. (2013). Information dashboard design: Displaying data for at-a-glance monitoring (2nd ed.). Analytics Press. Kano, N., Seraku, N., Takahashi, F., & Tsuji, S. (1984). Attractive quality and must-be
quality. Journal of the Japanese Society for Quality Control, 14(2), 39–48. Keppel, G., & Wickens, T. D. (2004). Design and analysis: A researcher’s handbook (4th ed.). Pearson. Norman, D. A., & Draper, S. W. (1986). User centered system design: New perspectives
on human-computer interaction. CRC Press. Sweller, J. (1988). Cognitive load during problem solving: Effects on learning.
Cognitive Science, 12(2), 257–285. Wickens, C. D. (2008). Multiple resources and mental workload. Human Factors, 50(3), 449–455.
LISTED IN THE AHFE DIGITAL BOOKSTORE CATALOGUE
Explore the complete digital volume
Usability and User Experience
Read this individual research paper free through the original publisher, or explore the full digital proceedings book.
ISBN 979-8-950676-08-6
Explore this ISBN in the AHFE Bookstore ↗Listed in the July 2026 bookstore catalogue; search by ISBN to confirm current availability · Digital book purchase optional