Cheng Tan, Xiaodong Xu, Yuzheng Wang, Liang Ma (2026). Psychometric Characterization of Silent Reliability Degradation Detection in Automated Decision Aids. In: Human Error, Reliability, Resilience, and Performance. AHFE Open Access, vol. 213, pp. 15–25. https://doi.org/10.54941/ahfe1007550
Automated decision aids may undergo silent reliability degradation without explicit alerts, requiring operators to infer state changes from sparse and partly stochastic error cues. The current research conducts a secondary analysis of the raw first-report behavioural data from Tan et al. (2026) to psychometrically characterize silent degradation detection. First-report trajectories from a within-subject 3 x 2 x 2 experiment (reliability loss magnitude: 0%, 5%, 10%; initial reliability: 75% vs. 90%; error type: false alarms vs. misses; N = 60) were reconstructed into window-based cumulative outcomes at 20, 40, 60, 80, and 100 trials. A logistic mixed-effects model estimated window-specific psychometric functions mapping reliability loss to cumulative failure-report probability, from which operational detection thresholds were derived as the loss required to reach a 50% report criterion. Failure-report probability increased with reliability loss and monitoring window, and was lower under 90% initial reliability in the low-loss region. The 90% condition also showed steeper psychometric slopes. Operational detection thresholds declined with monitoring duration in both conditions, but remained higher under 90% initial reliability in the mid-to-late windows, with stable separation at 80 and 100 trials. These findings show that silent degradation detection is not only a matter of when the first report occurs, but also of how much degradation is required, within a given monitoring duration, to trigger a failure judgment.
Automated decision aids are increasingly embedded in safety-critical settings such as industrial inspection, transportation, and clinical support. In these contexts, system value depends not only on nominal accuracy but also on whether human operators can calibrate their reliance to the system’s actual capability over time. Research on automation has long shown that automation reshapes the allocation of information acquisition, information analysis, and decision support, while system reliability, perceived reliability, and trust jointly determine whether users rely on, verify, or override automated recommendations. Accordingly, understanding how humans judge whether automation remains dependable under dynamically changing reliability is
a central problem in human factors and human-automation interaction research (Parasuraman et al., 2000; Lee and See, 2004; Hoff and Bashir, 2015). This challenge becomes more acute when automation does not fail noisily but instead degrades through silent reliability degradation. In such cases, the system provides no explicit indication that its state has changed, and operators must infer a possible reliability drop from sparse, local, and partly stochastic error cues while continuing to perform the task. Classic human factors research has shown that passive monitoring can reduce situation awareness and impair timely takeover following automation failure, whereas high prior reliability may foster complacency, monitoring relaxation, or overreliance, leading operators to treat early anomalies as random fluctuation rather than evidence of degradation (Endsley and Kiris, 1995; Metzger and Parasuraman, 2001; Parasuraman and Riley, 1997). Recent studies on automation reliability similarly indicate that people do update their judgments from experience, but such updating often lags behind the true state of the system and may diverge from actual acceptance behaviour (Hutchinson et al., 2022; Hutchinson et al., 2023).
However, the existing literature is still insufficient for the specific question addressed here. Most prior work has treated automation reliability perception in terms of dynamic ratings, trust calibration, or reliance outcomes, focusing on whether people update their judgments, whether they underestimate reliability, and how such judgments affect advice acceptance. Much less attention has been devoted to a more precise question: within a given monitoring duration, how much reliability loss is required for a person to cross the boundary from routine monitoring to an explicit failure judgment? Recent research examined human perception of subtle silent failures under manipulations of failure severity, initial reliability, and error type (Tan et al., 2026). Yet that study was primarily concerned with whether silent failures were perceived, when they were perceived, and whether the judgment was accurate. It did not psychometrically characterize the loss-to-report mapping itself. Thus, a psychometric account of silent degradation detection remains missing: it is still unclear how much reliability loss is required, under different monitoring windows, to elicit a failure judgment.
To address this gap, the current research conducts a secondary analysis of the raw first-report behavioural data from Tan et al. (2026) from a psychometric-function perspective. Specifically, the factor termed failure severity in the original experiment is reformulated here as reliability loss magnitude, and the response dimension is defined as cumulative failure- report probability within a given monitoring window. On this basis, the study estimates window-specific psychometric functions and derives an operational detection threshold, defined as the amount of reliability loss required to reach a 50% failure-report probability within a given monitoring window. In this way, the current research moves beyond the question of when participants first reported failure and instead asks how much degradation was required, by a given point in monitoring, to trigger a failure judgment.
METHOD
Data Source and Original Experiment The current research is a secondary analysis of the raw behavioral data reported in Tan et al. (2026). The source experiment used a within-subject 3 x 2 x 2 design in a smartphone-screen scratch inspection task, manipulating automation reliability decrease magnitude (termed failure severity in the original study; 0%, 5%, and 10%), initial reliability (75% vs. 90%), and error type (false alarms vs. misses). Sixty participants completed 12 scenarios each. Every scenario consisted of a training phase and a formal monitoring phase. The training phase established a baseline representation of the system’s reliability, whereas during the formal phase participants both verified individual system outputs and continuously monitored whether the system’s overall reliability had declined relative to the training baseline, pressing a “Failure” button when they first judged that sustained degradation had occurred. The training phase typically contained 60 trials, with 40 additional trials if needed; the formal phase contained 100 trials. The key raw behavioral measure used in the current secondary analysis was the trial of the first failure report in each scenario (Tan et al., 2026).
Window-based data reconstruction The current analysis did not treat the data as a time-to-first-report problem. Instead, the original first-report trial from each scenario was transformed into window-based cumulative report data. Specifically, each scenario trajectory was represented at five pre-defined monitoring windows: 20, 40, 60, 80, and 100 trials. For every trajectory and every window, a binary variable reported_ by_window was defined: it was coded as 1 if the participant had already made the first failure report by the end of that window and 0 otherwise. If no failure report occurred during the entire 100-trial formal phase, the trajectory was coded as 0 for all five windows. This transformation expanded the original 720 scenario trajectories into 3600 windowed observations. Conceptually, it reformulated the question from “when did the first report occur?” to “had a report occurred by this monitoring window?”, thereby converting first-report records into the cumulative binary responses required for psychometric analysis.
The factor termed failure severity in the original study is referred to as reliability loss magnitude, because here it functions as the absolute decrease in automation reliability relative to the training baseline rather than as a notion of consequence severity. The current research therefore focuses not on perception time per se, but on the mapping between reliability loss magnitude and cumulative failure-report probability. In psychometric terms, the input dimension is reliability loss magnitude and the response dimension is the probability of having reported a failure by a given monitoring window (Wichmann and Hill, 2001).
Psychometric Modeling and Threshold Estimation The dependent variable in the windowed dataset was reported_by_window. Because this outcome is binary and observations are nested within participants, the data were analyzed using a generalized linear mixed-effects model with a binomial distribution and logit link. Binary categorical outcomes are more appropriately analyzed with logit mixed models than with ANOVA on proportions, and mixed-effects models allow the simultaneous estimation of fixed experimental effects and random subject heterogeneity (Jaeger, 2008; Bates et al., 2015). The final model was:
where loss_num took the values 0, 5, and 10; initial_reliability_num coded 75% as 0 and 90% as 1; window_z was the standardized value of log(window); and subject was included as a random intercept to account for repeated observations within participants. From the fixed-effect estimates of this model, a window-specific psychometric function was obtained for each monitoring window and each initial-reliability condition: ( ) ( ) 1 _ _ * P reportbyw logit alpha rw beta rw loss − = +
where alpha_rw denotes the logit intercept and beta_rw the slope for reliability loss under reliability condition r and window w. The operational detection threshold was defined as the amount of reliability loss required to reach a cumulative failure-report probability of 50% within a given monitoring window. Letting p* = 0.50 denote the criterion probability, the threshold was computed as: ( ) _ * _ / _ threshold rw logit p alpha rw beta rw = [Equation or mathematical symbol available in the original paper PDF] − [Equation or mathematical symbol available in the original paper PDF][Equation or mathematical symbol available in the original paper PDF][Equation or mathematical symbol available in the original paper PDF]
Accordingly, a lower threshold indicates that less degradation was needed to elicit a failure judgment within that monitoring window, whereas a higher threshold indicates that a larger reliability loss was required. Ninety- five percent confidence intervals for model coefficients, window-specific psychometric parameters, and derived thresholds were obtained by parametric bootstrap (Davison and Hinkley, 1997; Wichmann and Hill, 2001).
RESULTS
Psychometric Curves Across Monitoring Windows
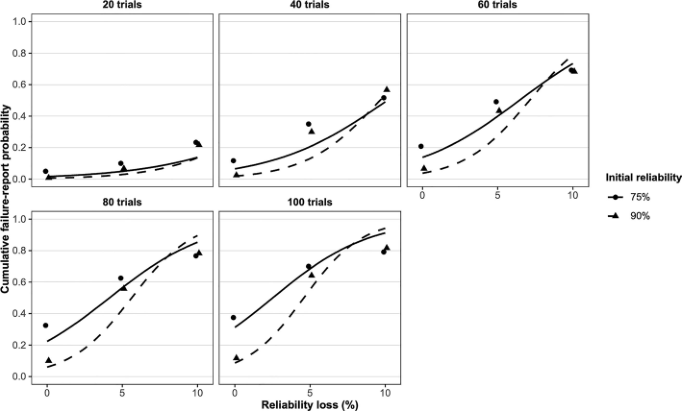
Figure 1 shows the relationship between reliability loss magnitude and cumulative failure-report probability across monitoring windows. Overall, the data exhibited a clear and stable psychometric pattern: failure-report probability increased as reliability loss increased, and the cumulative probability of reporting failure shifted upward as the monitoring window became longer.
Figure 1: Window-specific psychometric curves showing cumulative failure-report probability as a function of reliability loss under the 75% and 90% initial-reliability conditions. Points indicate observed cumulative report probabilities; lines indicate fitted values from the final psychometric model.
The final model parameters in Table 1 supported this pattern. There was a significant positive main effect of reliability loss, indicating that larger reliability loss significantly increased the log-odds of reporting failure. Monitoring window also showed a significant positive main effect, indicating that cumulative failure reports became more likely in later windows. By contrast, the main effect of initial reliability was significantly negative, showing that under low-loss conditions the 90% initial-reliability condition yielded lower report probability than the 75% condition.
Table 1: Coefficient estimates from the final psychometric model.
Table available in the original PDF paper.
Parameter Estimate SE 95% CI z p −7.675 < .001 Intercept −2.119 0.287 [−2.691, −1.573]
Parameter Estimate SE 95% CI z p Reliability loss × Initial reliability × Monitoring window 0.035 0.031 [−0.026, 0.095] 1.188 0.235
Random intercept SD (subject) 1.900 0.191 [1.536, 2.286] More importantly, the reliability loss × initial reliability interaction was significantly positive. This indicates that high initial reliability did not simply shift the psychometric function in parallel, but instead altered the way reliability loss influenced report probability. In contrast, reliability loss × monitoring window, initial reliability × monitoring window, and the three-way interaction were not statistically significant. Taken together, the most robust pattern in the present analysis was not that monitoring window substantially changed the form of the reliability effect, but rather that loss, monitoring duration, and initial reliability jointly shaped failure-report probability, with the most stable feature being a suppression of low-loss reporting under high initial reliability and a significant interaction between initial reliability and loss.
Window-Specific Psychometric-Function Parameters To further characterize the functional form of the curves shown in Figure 1, Table 2 reports the window-specific psychometric-function parameters, namely the logit intercept and the slope for reliability loss for each combination of monitoring window and initial reliability. Under the 75% condition, the intercept increased progressively across windows, from -4.073 at 20 trials to −0.788 at 100 trials. This indicates that near zero loss, the baseline log-odds of reporting failure increased as monitoring continued. Under the 90% condition, however, the intercept remained more negative than under 75% at every window, ranging from −5.120 at 20 trials to −2.359 at 100 trials. This shows that in the low-loss region, reporting failure was consistently less likely under high initial reliability.
Table 2: Window-specific psychometric-function intercepts and slopes.
Table available in the original PDF paper.
95% CI (Slope)
Initial Reliability
Intercept (logit)
Monitoring Window (trials)
95% CI (Intercept) Slope for Reliability Loss 20 75% −4.073 [−4.903, −3.351] 0.224 [0.146, 0.308] 20 90% −5.120 [−6.115, −4.298] 0.327 [0.233, 0.428]
Psychometric Characterization of Silent Reliability Degradation Detection 21 At the same time, the slope under the 90% condition was consistently steeper than under the 75% condition and became steeper as the monitoring window increased. For example, at 20, 60, and 100 trials, the slope values under 75% were 0.224, 0.284, and 0.312, whereas the corresponding values under 90% were 0.327, 0.455, and 0.514. This indicates that although high initial reliability suppressed report probability in the low-loss range, the curve rose more sharply as loss increased. Thus, high initial reliability affected not merely the overall level of reporting, but the shape of the entire loss-to-report mapping.
Operational Detection Thresholds
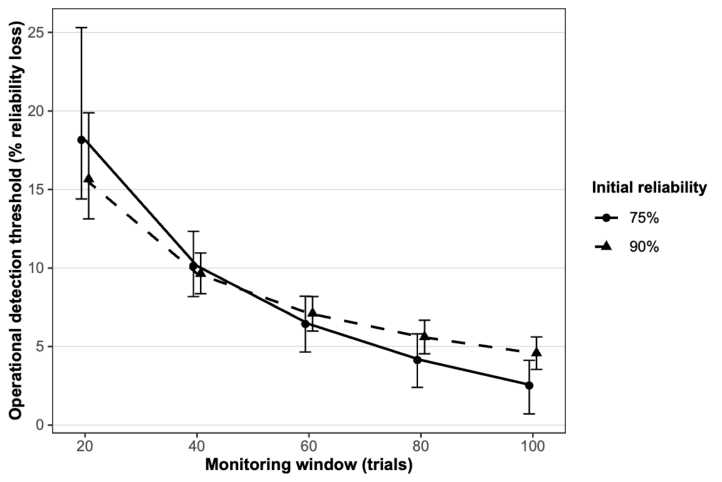
Figure 2 and Table 3 present the operational detection thresholds derived from the psychometric functions, defined as the amount of reliability loss required to reach a cumulative failure-report probability of 50% within a given monitoring window. Overall, thresholds declined markedly as the monitoring window lengthened, indicating that with longer monitoring duration, participants required less reliability loss to form a failure judgment. Under the 75% condition, the threshold decreased from 18.16 at 20 trials to 2.52 at 100 trials; under the 90% condition, it decreased from 15.67 to 4.59.
Figure 2: Operational detection thresholds across monitoring windows under the two initial-reliability conditions. Error bars indicate 95% confidence intervals. Thresholds denote the estimated reliability loss required to reach a 50% cumulative failure-report probability.
Crucially, the separation between the two threshold trajectories was not stable from the outset. At 20 trials, the difference between the 90% and 75% conditions was −2.49; at 40 trials, the difference was −0.49. In both cases, the confidence interval crossed zero, indicating that the group difference was not yet stable in the early windows. At 60 trials, the difference became positive
(0.68), but the 95% CI still crossed zero, suggesting directional separation without stable statistical support. A stable group separation emerged only in the mid-to-late windows. At 80 trials, the threshold was 5.62 under 90% and 4.14 under 75%, yielding a difference of 1.47. At 100 trials, the thresholds were 4.59 and 2.52, respectively, and the difference increased to 2.07.
Table 3: Estimated operational detection thresholds by monitoring window and initial reliability.
The current paper conducted a psychometric secondary analysis of the first-report behavioral data from Tan et al. (2026). Whereas the original study focused on perception time and perception accuracy, the current analysis reformulated the problem as follows: within a given monitoring window, how much reliability loss magnitude is required to trigger a failure judgment? The findings showed that silent reliability degradation detection can be characterized as a time-varying loss-to-report mapping: as monitoring duration increased, the amount of reliability loss required to reach the same failure-report criterion declined; at the same time, high initial reliability continued to elevate the operational detection threshold in the mid-to-late windows. Thus, silent failure was not simply a point event, but a psychometric judgment process unfolding over time. This conclusion is continuous with, but not redundant to, the source paper’s findings that larger failure severity led to earlier and more accurate reporting and that higher initial reliability produced a speed-accuracy trade-off. The additional contribution of the current research is that it recasts those patterns as changes in window-specific psychometric functions and derived thresholds rather than only as time-to- first-report outcomes (Tan et al., 2026; Wichmann and Hill, 2001).
Theoretically, the most important result is not that the 90% condition was globally “worse” or that the 75% condition was globally “better,” but that high initial reliability changed the shape of the psychometric function. In the present results, the 90% condition showed a lower intercept in the
Psychometric Characterization of Silent Reliability Degradation Detection 23 low-loss region, but also a steeper slope that became increasingly pronounced across windows; correspondingly, the threshold trajectories showed unstable differences early and reliably higher thresholds under 90% in the mid- to-late windows. This indicates that high initial reliability did not merely shift the function in parallel. Instead, it suppressed early reporting under subtle degradation while preserving a sharper rise in report probability once larger loss accumulated. In light of the automation literature, this pattern is consistent with the idea that high early reliability establishes a stronger baseline expectation and a more conservative reporting criterion, making operators more likely to interpret early anomalies as random fluctuation rather than system-level degradation (Lee and See, 2004; Hoff and Bashir, 2015). The findings also have direct implications for human-factors design. If the key problem in silent degradation detection is not merely whether people will report, but how much degradation is required for them to report within a limited monitoring duration, then the design target should move beyond globally increasing trust or acceptance and toward lowering the effective detection threshold for subtle degradation. In practical terms, this suggests that interfaces should support early trend transparency, performance-history summarization, and reliability-state cueing so that scattered errors are more likely to be integrated into evidence of state change rather than dismissed as isolated events. Training should likewise focus not only on how to use automation, but on how to identify subtle reliability drift and maintain a stable monitoring criterion. The point is not to reduce trust per se, but to promote trust calibration and timely intervention (Lee and See, 2004; Parasuraman and Riley, 1997).
Overall, the central contribution of the current research is to move silent reliability degradation detection from an event-oriented question of when the first report occurred to a psychometric question of how reliability loss magnitude maps onto cumulative failure-report probability. This shift makes it possible to show that the judgment boundary is not fixed: the threshold declines with monitoring duration and remains higher under high initial reliability in the mid-to-late windows. The value of this conclusion is not simply the addition of another statistic, but the introduction of a more operationally meaningful evaluation framework for supervisory human-automation interaction: the design of automated systems must account simultaneously for nominal system reliability, operators’ baseline expectations formed early in interaction, and the amount of degradation required to trigger a failure judgment within limited monitoring time.
CONCLUSION
The current research conducted a psychometric secondary analysis of the original first-report behavioral data from Tan et al. (2026). Whereas the source study primarily addressed whether silent failures were perceived, when they were perceived, and whether those judgments were accurate, the current paper addressed a more operational question: within a given monitoring window, how much reliability loss magnitude is required to elicit a failure judgment? The results showed that silent reliability degradation detection
can be characterized as a time-varying loss-to-report mapping. As monitoring duration increased, the amount of reliability loss required to reach the same failure-report criterion declined. At the same time, high initial reliability did not simply shift the function uniformly; instead, it lowered report probability in the low-loss region and maintained a higher operational detection threshold in the mid-to-late windows. The threshold estimates further indicated stable separation between the two initial-reliability conditions at 80 and 100 trials, with higher thresholds under 90% than under 75%.
The main contribution of this paper, therefore, is not merely to restate whether people reported earlier or later, but to show that silent-failure detection is not only a matter of time, but also a matter of threshold. The research already demonstrated that larger reliability decreases yielded earlier and more accurate failure reports, whereas higher initial reliability produced a slower but more accurate speed-accuracy trade-off. The current research extends that account by showing that these behavioral patterns can be reformulated as systematic changes in psychometric-function shape and operational detection thresholds. From a human-factors perspective, this suggests that safety-critical automated systems should not focus solely on achieving high nominal reliability; they should also support early trend transparency, performance-history cueing, and training for subtle degradation detection so that the effective threshold for failure judgment can be lowered within limited monitoring time, thereby promoting more appropriate reliance and more timely human intervention (Lee and See, 2004).
ACKNOWLEDGMENT
This study was supported by the National Natural Science Foundation of China (Grant Nos. 72571154, 72192822, and 72192824).
REFERENCES
Bates, D., Mächler, M., Bolker, B. and Walker, S. (2015) ‘Fitting linear mixedeffects models using lme4’, Journal of Statistical Software, 67(1), pp. 1–48. doi: 10.18637/jss.v067.i01. Davison, A.C. and Hinkley, D.V. (1997) Bootstrap Methods and Their Application.
Cambridge: Cambridge University Press. doi: 10.1017/CBO9780511802843. Endsley, M.R. and Kiris, E.O. (1995) ‘The out-of-the-loop performance problem and level of control in automation’, Human Factors, 37(2), pp. 381–394. doi: 10.1518/001872095779064555. Hoff, K.A. and Bashir, M. (2015) ‘Trust in automation: Integrating empirical
evidence on factors that influence trust’, Human Factors, 57(3), pp. 407–434. doi: 10.1177/0018720814547570. Hutchinson, J., Strickland, L., Farrell, S. and Loft, S. (2022) ‘Human behavioral response to fluctuating automation reliability’, Applied Ergonomics, 105, 103835. doi: 10.1016/j.apergo.2022.103835. Hutchinson, J., Strickland, L., Farrell, S. and Loft, S. (2023) ‘The perception of
automation reliability and acceptance of automated advice’, Human Factors, 65(8), pp. 1596–1612. doi: 10.1177/00187208211062985.
Psychometric Characterization of Silent Reliability Degradation Detection 25 Jaeger, T.F. (2008) ‘Categorical data analysis: Away from ANOVAs (transformation
or not) and towards logit mixed models’, Journal of Memory and Language, 59(4), pp. 434–446. doi: 10.1016/j.jml.2007.11.007. Lee, J.D. and See, K.A. (2004) ‘Trust in automation: Designing for appropriate reliance’, Human Factors, 46(1), pp. 50–80. doi: 10.1518/hfes.46.1.50_30392. Metzger, U. and Parasuraman, R. (2001) ‘The role of the air traffic controller in future air
traffic management: An empirical study of active control versus passive monitoring’, Human Factors, 43(4), pp. 519–528. doi: 10.1518/001872001775870421. Parasuraman, R. and Riley, V. (1997) ‘Humans and automation: Use, misuse, disuse, abuse’, Human Factors, 39(2), pp. 230–253. doi: 10.1518/001872097778543886. Parasuraman, R., Sheridan, T.B. and Wickens, C.D. (2000) ‘A model for types and
levels of human interaction with automation’, IEEE Transactions on Systems, Man, and Cybernetics-Part A: Systems and Humans, 30(3), pp. 286–297. doi: 10.1109/3468.844354. Tan, C., Xu, X. and Ma, L. (2026) ‘Can humans timely and accurately perceive silent failures in automated decision aids? Effects of failure severity, initial reliability, and error type’, International Journal of Industrial Ergonomics, 113, 103924. doi: 10.1016/j.ergon.2026.103924. Wichmann, F.A. and Hill, N.J. (2001) ‘The psychometric function: I. Fitting,
sampling, and goodness of fit’, Perception & Psychophysics, 63(8), pp. 1293–1313. doi: 10.3758/BF03194544.
LISTED IN THE AHFE DIGITAL BOOKSTORE CATALOGUE
Explore the complete digital volume
Human Error, Reliability, Resilience, and Performance
Read this individual research paper free through the original publisher, or explore the full digital proceedings book.
ISBN 978-1-964867-89-2
Explore this ISBN in the AHFE Bookstore ↗Listed in the July 2026 bookstore catalogue; search by ISBN to confirm current availability · Digital book purchase optional