Taro Kanno, Kazumi Kajiyama, Haruka Yoshida, Sachika Sharikura, Michihiro Tsubaki, Misumi Yamazaki, Desak Ayu Clara Dewanti, Naoto Endo (2026). Tracking the Chaos: Visualizing People & Resource Flow in Disaster Drills via Mobile App. In: Human Error, Reliability, Resilience, and Performance. AHFE Open Access, vol. 213, pp. 135–142. https://doi.org/10.54941/ahfe1007563
Mass casualty incident (MCI) drills at disaster base hospitals are critical opportunities for continuously improving institutional disaster response capabilities. However, conventional drill evaluations rely heavily on observer-based checklists and post-drill debriefings, making it difficult to objectively and quantitatively capture what actually occurred during the exercise. In drills where numerous simulated casualties, medical staff, and equipment move simultaneously, accurately reconstructing "who was where and when," "which areas became congested," and "how resources such as stretchers were utilized" remains a significant challenge.To address this, we developed a smartphone application designed to record and visualize the flow of people and materials during disaster drills. The app incorporates three tracking methods: NFC tags, BLE beacons, and barcodes. NFC tags attached to casualty cards or equipment are scanned at area entry and exit points to log timestamps. BLE beacons enable continuous location tracking of tagged subjects. Barcodes printed on existing cards or labels allow lightweight data capture with minimal setup. Each method offers distinct trade-offs in deployment ease, recording accuracy, operational burden, and attachment feasibility, enabling selection based on drill objectives and site conditions.Application examples from MCI drills conducted at disaster base hospitals are presented. The recorded data allow time-series reconstruction of each simulated casualty's movement across triage areas—red, yellow, green, waiting zones, and imaging rooms—enabling quantification of congestion onset and duration. Equipment utilization, including stretcher deployment timelines and potential shortages or bottlenecks, is similarly visualized.This approach extends drill evaluation beyond subjective narrative reflection toward objective, data-driven assessment. Metrics such as area dwell time, inter-area transfer duration, congestion levels, and equipment utilization rates enable multidimensional performance measurement. Longitudinal data accumulation further supports year-over-year comparison, facilitating verification of improvement and identification of recurring operational challenges.
Mass casualty incidents (MCIs) place extraordinary demands on hospitals, requiring rapid triage, coordinated patient flow, and continuous situational awareness across multiple clinical areas. Disaster base hospitals therefore conduct MCI drills to test their preparedness for large-scale emergencies. However, drill evaluation often relies on observer notes and post-drill debriefings (Jenckes, 2007), which are limited in objectively reconstructing the dynamic processes that actually unfolded. Although these methods are useful for identifying perceived problems and collecting expert reflections, they have limitations in objectively reconstructing the dynamic processes that actually unfolded during the exercise. In particular, MCI drills involve many simulated casualties, medical staff, and resources moving simultaneously across triage areas, treatment zones, imaging rooms, waiting areas, and other hospital spaces. Under such complex conditions, human observers alone cannot accurately capture who was where and when, how long patients stayed in each area, when congestion emerged, or how critical resources such as stretchers were deployed.
To address this challenge, we developed a smartphone-based application for recording and visualizing the flow of people and materials during hospital disaster drills. The application integrates NFC tags, BLE beacons, and barcodes, enabling flexible data collection according to drill objectives, site conditions, and operational constraints. By converting drill activities into time-stamped movement and utilization data, the system allows patient flow, area congestion, transfer duration, and equipment use to be quantitatively reconstructed and visualized. This paper presents the application design and illustrative examples from MCI drills, demonstrating how data-driven recording and visualization can complement conventional evaluation and support continuous improvement of hospital disaster response.
DATA COLLECTION METHODS This section introduces the Android smartphone applications developed to collect time-stamped movement data on people and materials during MCI drills. The applications were designed to support objective reconstruction of drill processes while minimizing disruption to drill operations. Two complementary approaches were implemented: an NFC-based application for event-based recording at predefined locations, and a BLE-based application for continuous proximity-based tracking.
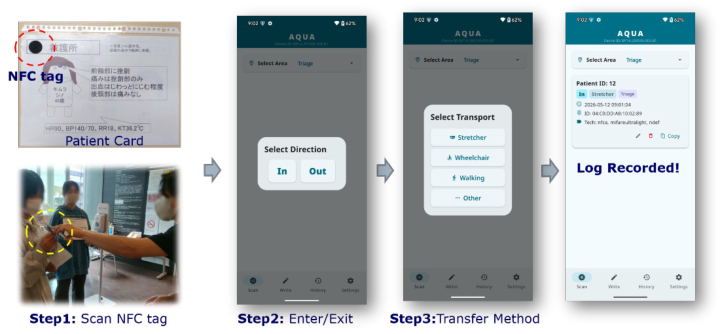
NFC-BASED APPLICATION The NFC-based application was developed to record event-based movements of simulated casualties during MCI drills. Near Field Communication (NFC) is a short-range wireless communication technology that enables data exchange when a tag is brought into close proximity with a smartphone or other reader. NFC tags were attached to casualty cards, and staff with smartphones running the application were stationed at predefined recording points such as triage areas, treatment zones, waiting areas, and imaging rooms. Each scan generated a time-stamped record that included the tag ID, recording location, and movement-related information.
Figure 1 illustrates the basic operation of the NFC-based application. The recording procedure consists of three steps. First, the user scans the NFC tag attached to the casualty card or equipment using a smartphone. Second, the user selects whether the tagged subject is entering or leaving the area. Third, the user selects the mode of movement — such as walking, wheelchair, stretcher, or other transport methods. Through this simple procedure, the application records not only when and where the subject moved, but also how the movement was conducted.
The NFC-based application is particularly suitable for recording discrete movement events at clearly defined points. Its main limitation is that data completeness depends on consistent scanning throughout the drill.
Figure 1: NFC-based smartphone application.
BLE-BASED APPLICATION The BLE-based application was developed to enable continuous, low-burden tracking of simulated casualties and equipment during MCI drills. Bluetooth Low Energy (BLE) is a wireless communication technology designed for low-power, short-range data transmission. BLE beacons periodically transmit identification signals that can be detected by nearby receivers such as smartphones. In this study, BLE was used to estimate the approximate location of tagged objects or participants based on beacon detections by area-specific receivers.
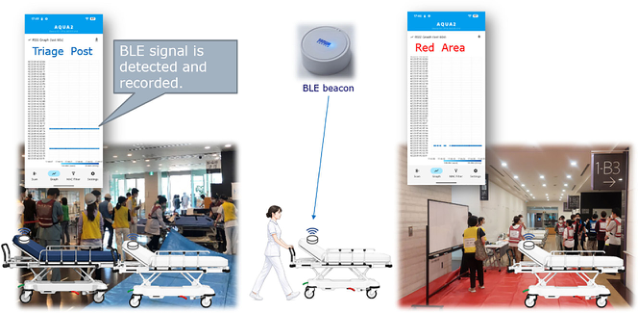
Figure 2 illustrates the basic use of the BLE-based application. First, BLE beacons are attached to the objects or persons to be tracked, such as stretchers or participants. Second, smartphones functioning as BLE receivers are placed in each area where movement and congestion are to be recorded. Third, each receiver continuously detects nearby BLE beacons and records the beacon ID, timestamp, received signal strength, and receiver location. By integrating detection records from multiple receivers, the movement and approximate location of each beacon can be reconstructed over time.
This BLE-based approach reduces the need for manual recording during the drill, as data are collected automatically once the beacons and receivers are deployed. It is therefore useful for capturing continuous movement
patterns, estimating area dwell time, identifying congestion, and visualizing the utilization of resources such as stretchers. In particular, it can provide time-series information on how long each tagged object or person remained near each area and how movement patterns changed throughout the drill.
However, BLE-based tracking provides approximate rather than exact location information. Signal strength can be influenced by receiver placement, distance, obstacles, body shielding, and radio interference in the hospital environment. Therefore, the BLE-based application is best suited for analyzing movement tendencies, congestion patterns, and resource utilization trends, while NFC-based recording is more appropriate when precise entry and exit timestamps are required.
Figure 2: BLE-based smartphone application.
Comparison of NFC- and BLE-Based Applications The NFC- and BLE-based applications were designed as complementary tools for collecting movement and resource-use data during MCI drills. Their advantages and limitations differ according to the level of recording accuracy required, the operational burden during the drill, and the feasibility of attaching tags or installing receivers. Table 1 summarizes the main advantages and limitations of the two approaches.
Table 1: Comparison of NFC- and BLE-based applications.
Table available in the original PDF paper.
Aspects NFC BLE Recording style Manual, event-based scanning Automatic, continuous detection Main strength Precise entry/exit timestamps Low-burden tracking over time
Location accuracy High at predefined points Approximate, signal-based Operational burden Requires scanning during the drill Minimal after deployment Suitable analysis Dwell time, transfer time, handovers
Movement trends, congestion, resource use Main limitation Missed or incorrect scans Signal noise and interference
Requires processing of noisy data
Data handling Easy correction/deletion of records
FIELD IMPLEMENTATION This section presents an example of field implementation of the developed applications in an MCI drill conducted at a disaster base hospital. The aim was to examine whether the applications could collect movement data in a realistic drill setting and whether the recorded data could be used to visualize patient flow and resource movement.
Target Drill The target drill was a mass casualty incident exercise conducted at Kitasato University Hospital, a disaster base hospital in Japan. The drill simulated the hospital response to a major earthquake involving multiple casualties with varying levels of severity (Kanno et al., 2025). During the exercise, simulated patients moved through several functional areas — including triage areas, treatment zones, waiting areas, and imaging rooms — according to their assigned conditions and the decisions made by medical staff. The smartphone applications were used to record the movements of simulated patients and selected resources during the drill. NFC tags were attached to casualty cards, and BLE beacons were attached to selected objects such as stretchers.
Patient Flow Patient flow was reconstructed using the NFC-based time-stamped records collected during the drill. Each simulated patient’s movement history was arranged chronologically to identify when the patient entered and left each area. The resulting dataset made it possible to calculate area dwell time, inter- area transfer duration, and the sequence of locations visited by each patient.
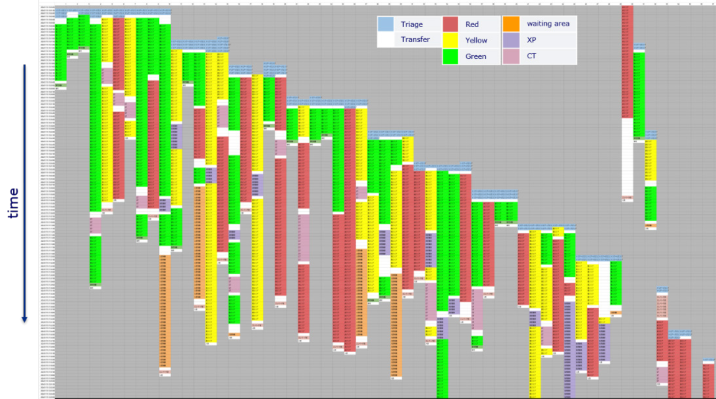
Figure 3 shows an example visualization of patient flow using colored time bands. Each horizontal band represents one simulated patient, and the colors indicate the area where the patient stayed at each point in time. For example, different colors correspond to areas such as red, yellow, and green triage zones, waiting areas, and imaging rooms. This visualization enables an intuitive understanding of how patients moved through the hospital and how long they remained in each area.
The patient-flow visualization also helps identify congestion and operational delays. When many patients remain in the same area for an extended period, the corresponding color bands accumulate, suggesting possible congestion or reduced throughput. In addition, prolonged stays in waiting areas or delayed movement to imaging rooms can indicate bottlenecks in patient assessment, transfer, or resource allocation.
Figure 3: Patient flow in the exercise.
Stretcher Movement Stretcher movement was also recorded and visualized using data collected by the BLE-based application to examine how transport resources were used during the drill. Because stretchers are essential for moving patients who cannot walk independently, their availability and circulation can directly affect patient flow and treatment efficiency.
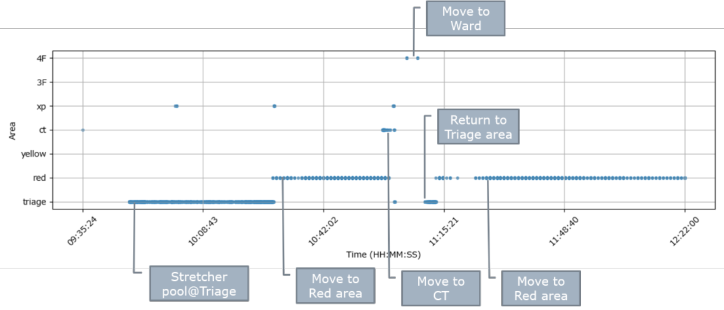
Figure 4 shows an example visualization of BLE-based tracking data for a single stretcher. A BLE beacon was attached to the stretcher, and receivers installed in each area continuously detected the beacon throughout the drill. The time-series record indicates when and where the stretcher was detected, allowing its approximate movement history to be reconstructed. This visualization makes it possible to examine the operational history of an individual transport resource in detail. For example, a prolonged detection period in one area may indicate that the stretcher was occupied by a patient, awaiting transfer, or not returned promptly after use. Repeated detections across multiple areas may suggest high demand for transport support or active circulation of the stretcher during the drill. Such information is difficult to capture accurately through observer notes alone.
Although Figure 4 presents the BLE-based record of a single stretcher, the same approach can be applied to multiple stretchers to compare utilization patterns across resources. By combining stretcher movement records with patient-flow data, it becomes possible to examine whether delays in patient movement were related to stretcher availability, allocation, or circulation. Thus, BLE-based stretcher tracking provides a useful basis for identifying resource bottlenecks and improving transport management during MCI response.
Figure 4: A stretcher movement in the exercise.
CONCLUSION
This study presented a smartphone-based approach for recording and visualizing the flow of people and materials during mass casualty incident drills at disaster base hospitals. Conventional drill evaluations often rely on observer checklists and post-drill debriefings, which are useful but limited in their ability to objectively reconstruct dynamic operational processes.
To address this limitation, we developed applications that collect time- stamped movement data using NFC tags and BLE beacons. The NFC- based application enables event-based recording of patient and equipment movement through scan operations, while the BLE-based application supports continuous, low-burden tracking of resources such as stretchers.
The field implementation at Kitasato University Hospital demonstrated that the collected data can be used to visualize patient flow and stretcher movement during an MCI drill. Patient-flow and stretcher-movement visualizations enabled identification of congestion, delays, and potential bottlenecks in resource allocation.
By transforming drill activities into objective time-series data, this approach extends drill evaluation beyond subjective reflection toward data-driven assessment. Metrics such as area dwell time, transfer duration, congestion level, and equipment utilization can provide a concrete basis for post-drill discussion and performance improvement. In future work, we will continue to accumulate data from drills conducted over multiple years, enabling longitudinal comparison of hospital response capabilities and verification of whether operational improvements are sustained over time.
In addition, we are developing an evaluation method that compares actual drill performance — referred to as Work-As-Done — with the overall performance expected under idealized response conditions reconstructed through computer simulation — referred to as Work-As-Imagined (Dewanti et al., 2025). Such a comparison may help clarify the gap between planned and actual operations and identify where delays, congestion, or resource constraints emerge. We have also developed a prototype barcode-based recording application as a lightweight alternative that can use existing
casualty cards or labels. Together, these tools and methods are expected to support more objective, continuous, and practical evaluation of disaster response drills.
ACKNOWLEDGMENT
This work was partly supported by JSPS KAKENHI Grant Number 25H00777.
REFERENCES
Dewanti, D.A.C., Kanno, T., Nishimura, T., Kajiyama, K., Tsubaki, M., Sharikura, S., Yamazaki, M., Yoshida, H., Parung, J., and Santoso, A. (2025) Evaluating Hospital Disaster Resilience Using Simulation: Integrating Task Duration and Intra-Hospital Patient Transfer, In: Cai, W., Low, M., Tan, G., D’Angelo, G., Ta, D. (eds) Methods and Applications for Modeling and Simulation of Complex Systems. AsiaSim 2025. Communications in Computer and Information Science, vol 2727. Springer, Singapore. https://doi.org/10.1007/978-981-95-4472-1_2 Jenckes, M.W., Catlett, C.L., Hsu, E.B, Kohri, K., Green, G.B., Robinson, K.A., Bass,
E.B., Cosgrove, S.E. (2007). Development of evaluation modules for use in hospital disaster drills. Am J Disaster Med. Mar-Apr;2(2):87-95. PMID: 18271157. Kanno, T., Dewanti, D.A.C., Nishimura, T., Bito, Y., Kajiyama, K., Tsubaki, M., Santoso, A., Yoshida, H., Yamazaki, M. (2025). Proceedings of 11th Biennial Symposium of the Resilience Engineering Association: 141–147.
LISTED IN THE AHFE DIGITAL BOOKSTORE CATALOGUE
Explore the complete digital volume
Human Error, Reliability, Resilience, and Performance
Read this individual research paper free through the original publisher, or explore the full digital proceedings book.
ISBN 978-1-964867-89-2
Explore this ISBN in the AHFE Bookstore ↗Listed in the July 2026 bookstore catalogue; search by ISBN to confirm current availability · Digital book purchase optional