Industrial systems that form the basis of our daily lives, such as railroads, medicine, and aviation, function as socio-technical systems with complex and large-scale characteristics. As a methodology for the safe operation of such systems, measures to enhance "resilience potential," the ability to flexibly respond to changes in circumstances, such as unexpected behavior or unknown events, are attracting attention. Through an experimental approach, this study aims to clarify what strategies and cognitive factors cause differences in performance among operators and how these differences relate to resilience potential. Furthermore, by defining the characteristics of resilient behaviors from the experimental results, we will examine interaction designs to promote these behaviors.MethodThis study focused on the relationship between non-technical skill (NTS), a general-purpose task performance skill, and resilience and formulated the following experimental hypotheses.(1) Participants with higher NTS will behave more resiliently, resulting in higher work performance.(2) When a sudden change occurs, the information and strategies used by the high NTS group will differ from those of the low NTS group.The participants in the experiment were 23 university students. They completed a questionnaire to measure NTS before the experimental tasks. In the experiment, participants were asked to play an application game that implements Craik & Bialystok's Breakfast cooking task: prepare a breakfast set (toast, fried eggs, and coffee) for the number of people ordered at any given time. Additional orders for coffee, fried eggs, and toast alone may be placed, and the task requires that all the ordered items be cooked as quickly as possible without making any mistakes. This task is characterized by the fact that only the goal to be achieved is given, and the procedures and strategies along the way are left to the participants' judgment. This is similar to the characteristics of air traffic control operations, a well-known task that requires resilience potential. The experiment consisted of five scenarios. Scenarios 1, 2, and 4 were steady-state scenarios, while scenarios 3 and 5 were emergency scenarios. In the steady-state scenario, participants were asked to operate one application, while in the emergency scenario, they were asked to perform two applications in parallel. We designed the emergency scenarios to observe the resilience potential, an adaptive response to changing circumstances where accustomed methods do not work. The measurement data were task performance, gaze data, and post-task interviews. Task performance was evaluated regarding the time required to complete the task and the number of errors.Result and DiscussionThe experimental results showed no correlation between NTS scores and work performance. Thus, hypothesis (1) was not supported. Next, we compared the gaze data of the groups with high and low NTS scores. We found several areas on the experimental screen where the gaze accumulation amount differed significantly. In particular, the group with high NTS scores looked at the work progress indicator more than those with low NTS scores. On the other hand, the group with low NTS scores saw more buttons that became active when work was completed than those with high NTS scores. Compared to the post-interview results, the high NTS score group was found to be actively managing their progress. On the other hand, the group with low NTS scores did not address their progress in detail but only checked whether the work was completed using button expressions. These results suggest that hypothesis (2) is likely to be supported.
Maintaining a high level of safety and reliability is extremely important in socio-technical systems that support the operation of transportation, medi- cal care, nuclear plants, telecommunications, and other social infrastructures. Safety in these systems is traditionally defined as “the absence of unacceptable risk.” One of the critical aspects of safety management has been ensuring that operators follow manuals and procedures and eliminating factors that lead to human error and risk (Safety-I) from the analysis of accidents and incidents (Hollnagel, 2014). On the other hand, as social infrastructures have become larger and more complex in recent years, the socio-technical systems that support them have also become more sophisticated. In aviation, for example,
An Experimental Approach to Measuring Resilience Potential 63
technologies for automatic aircraft piloting and automatic collision detec- tion in air traffic control have been put to practical use. They are expected to reduce the workload of pilots and air traffic controllers, prevent errors, and improve operational efficiency. In the medical field, the increasing automa- tion and remoteness of surgery and diagnosis are expected to reduce surgical and diagnostic errors and enable many patients to receive quality medical care.
As socio-technical systems supporting complex operations become more sophisticated, the systems and their working environments change frequently; Hollnagel (Hollnagel, 2015) argues that “socio-technical systems are inher- ently dynamic and constantly evolving.” Safety in such systems should focus on “maintaining functionality under various conditions and in changing envi- ronments.” Operators are required to flexibly adapt to changing conditions while ensuring the safety of the overall system (Safety-II), and this ability is called resilience potential (hereafter RP) (Hollnagel, 2017). For example, con- trollers must adapt to unexpected aircraft movements and weather changes in air traffic control to achieve safe and efficient airspace management (Kohno, 2001). Similarly, medical personnel must make dynamic decisions in clinical operations based on changing patient conditions (Nakajima, 2017). Further- more, in nuclear plant management, operators must be flexible in the wear and corrosion of equipment and must adapt to changing equipment condi- tions (Kitamura, 2015). Suppose operators can increase their RP and respond flexibly to changes. In that case, they will avoid high-risk situations and min- imize the impact of a severe accident if it occurs. RP is, therefore, essential for maintaining the safety and stability of socio-technical systems.
This study aims to improve operators’ RP through system interaction. We will identify the information needed to enhance operators’ RP and how to present it and clarify the interaction design requirements. In addition, spe- cific examples of interaction design that improves operators’ RP and their effectiveness will be given. As a first step, we conducted a study to understand RP characteristics by experimentally replicating situations in which operators need to adapt to change. We used questionnaire items on task performance, eye movement, and strategy as metrics for understanding RP characteristics. This paper describes the experiment and its results. In addition, this paper reports new results and findings on RP obtained by increasing the number of participants from the experiment reported by (Yoshida et al., 2023) and adding eye gaze accumulation and application operation logs as measurement indices.
RELATED WORKS Prior studies on education and training to improve resilience have predomi- nantly focused on abstract aspects related to individuals and organizations. For instance, Hollnagel, a prominent advocate for resilience, identifies corre- sponding, anticipating, monitoring, and learning as the four key components of resilience and argues that education, from this standpoint, enhances human resilience (Hollnagel et al., 2014). Kitamura also suggests additional requirements for these components, such as adequately allocating resources,
identifying change, learning from successful practices, and taking proactive measures (Kitamura, 2017).
While much attention has been given to the abstract aspects of individual and organizational resilience, studies have also explored the tangible ele- ments, including the physical environment (such as equipment and facilities) and the information environment surrounding individuals and organizations. For example, Nakanishi et al. (Nakanishi, 2018) have demonstrated that education and training, along with suitable information design, can enhance and support participants’ resilient and adaptable characteristics. In a previ- ous study, our research group found that differences in the design of radar screen interactions in air traffic control operations affect controllers’ task performance and cognitive load (Yoshida et al., 2021).
In conclusion, the design of interactions to promote resilience improve- ment requires consideration in various domains, including information design, interface design, and other design elements. However, only a few stud- ies have thoroughly elucidated the characteristics and factors of resilience cru- cial for such interaction design. For example, a prior survey by Karikawa et al. (Karikawa et al., 2019) evaluated participants’ resilience using firefighting simulations, revealing distinct behaviors between high- and low-performing groups in response to a large-scale disaster. However, specific characteris- tics and factors of resilience, such as differences in behavior, thinking, and learning characteristics between groups, still need to be fully clarified. In particular, several studies analyzed RP-related behaviors based on task per- formance. However, RP-related behaviors that appear during the task and do not appear in the resulting performance should also be captured.
EXPERIMENT Overview
This experiment aimed to identify the characteristics and factors of RP, which are fundamental findings for designing interactions that help individuals improve their RP. As the experimental task, we used a breakfast cooking task (Harada et al., 2014) similar to air traffic control tasks that require operators’ RP under the hypothesis that RP factors lie in participants’ non- technical skills (NTS) (Nishido, 2011), we measured participants’ NTS as a preliminary study. The NTS of the participants was measured as an initial survey. Participants with high NTS scores were then classified into the high score (HS) group and those with low NTS scores into the low score (LS) group. In analyzing the results, we examined whether the NTS was a factor in RP based on the correlation between the NTS scores and task performance. Furthermore, we analyzed the differences in behaviors and strategies between the high and low-task performance groups based on the percentage of time spent accumulating eye gaze in each application domain. We extracted the behavioral patterns and thinking characteristics of high and low RP.
Experimental Hypothesis The following experimental hypotheses were developed based on related research (Karikawa, 2019):
An Experimental Approach to Measuring Resilience Potential 65
1: There is a positive correlation between NTS and resilience potential. 2: Groups with high resilience potential will exhibit different behaviors than groups with low resilience potential when faced with situations that deviate from their usual patterns (routines).
Experimental Task The experimental task was based on the breakfast cooking task proposed by Craik and Bialystok. Participants were required to operate a breakfast cooking application and prepare a breakfast set, including coffee, fried eggs, and toast, according to the number of customers. They also had to respond to additional orders for coffee, fried eggs, and toast. The goal was to cook all ordered items as quickly as possible without errors. The breakfast cooking task was chosen for this experiment because it shares common characteristics with the air traffic control task, where resilience potential is essential. The common characteristics of the functions are as follows
The operator is given only a goal to achieve, and the procedures and strategies are left to the operator.
The operator constantly monitors the situation and performs several tasks in parallel within a specific time.
Participants performed this task using a PC application. The application indicated additional orders as appropriate in a dialog, but in some cases, additional orders did not come. Cooking times varied by item; coffee was prepared automatically. After some time, the toast cooled and was automati- cally discarded. If fried eggs were cooked incorrectly, they were automatically discarded as garbage.
Two scenarios were prepared for the experiment: steady-state and emer- gency scenarios. Each scenario consisted of three table orders: a breakfast set for two to three people and an additional order. In the steady-state scenario, participants operated one cooking task application, while in the emergency scenario, they operated two applications simultaneously on two screens. Par- ticipants discovered and became familiar with the steady-state scenario’s basic procedures, rules, and strategies. In the emergency scenario, on the other hand, participants realized that the familiar methods no longer worked and had to devise alternative strategies to avoid failure.
Participants We recruited 127 undergraduate and graduate students from Nihon Univer- sity to answer a questionnaire measuring NTS (Nishido, 2011). Twenty-nine participants, consisting of the top 15 (HS group) and the bottom 14 (LS group), participated in the experiment. The participants were males and females in their 20s who usually used computers for classes and assignments and were proficient in mouse operation. This experiment was conducted with the approval of the Ethics Review Committee of the College of Industrial Engineering, Nihon University (approval number: S2020-006).
Procedure
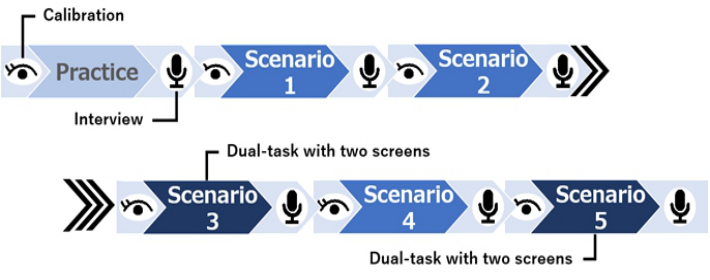
Figure 1 shows the flow of the experiment, with the numbers in parenthe- ses indicating the approximate time required for each step. The experiment began after the experimenter explained the purpose and task to the partici- pants and obtained their consent. Participants first completed two scenarios (six table orders) as a practice to familiarize themselves with the task and manipulations, followed by five scenarios as the main experiment. Each scenario lasted approximately 5 minutes, with 5 minutes of interview and preparation time between scenarios. The total duration of the experiment was approximately 90 minutes. The practice scenarios corresponded to the steady-state scenarios, during which participants were free to ask questions about the operation and the task. Scenarios 1 through 5 were the main exper- iment; scenarios 3 and 5 were emergency scenarios, and scenarios 1, 2, and 4 were steady-state scenarios. Scenario 3 was designed to investigate cop- ing RPs in the event of a significant situation change, and participants were expected to notice changes that would render their usual methods ineffective. Scenario 5 was designed to investigate learning-related RPs, as participants were asked to re-address an emergency scenario they had faced.
Figure 1: Flow of experiment.
Experimental Environment The experiment was conducted in a quiet room with closed doors and illumi- nation comparable to a typical office environment. A 23.5”monitor was used to display the application; the distance between the screen and the participant was 550 mm.
Measurement Performance on the Experimental Task Performance on the experimental task was evaluated using two indices: the difference between the time it took participants to complete the task (real- time), the theoretical minimum time (ideal time), and the total number of toast or fried eggs discarded in the task. Smaller values for both indices indicate better performance.
An Experimental Approach to Measuring Resilience Potential 67
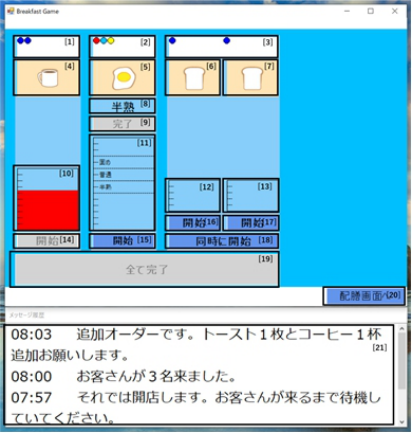
Gaze Data Eye gaze data was collected to objectively determine the information partici- pants looked at during the experimental task. The eye tracker Tobii Pro nano recorded the participant’s gaze position at 60 Hz intervals during the sce- nario. The experimental screen was divided into 21 regions for data analysis. Figure 2 shows the definitions of these regions.
Interview Data After each scenario, an interview was conducted to elicit qualitative factors related to the participants’ RP-related behaviors and thoughts during the experiment. Interview questions were developed based on the Critical Deci- sion Method proposed by Klein et al. (Klein et al., 1989). The interview aimed to ask about the participants’ thinking and behavioral strategies, cue informa- tion about the experimental task, and encourage reflection on their thinking and behavior. A summary of the questions posed in this experiment is shown in Table 1, and participants were asked to select from a list of options their responses to these questions in an interview conducted after each scenario.
Figure 2: Definition of areas in the experiment application screen.Table 1. Questionnaires in the interview.
Table available in the original PDF paper.
No. Questionnaire 1 Methods and strategies for managing tasks and why they are essential. 2 Whether and how to deal with expectations and deviations. 3 Actions were taken to ensure success and their results. 4 Reflection on successes and failures and measures for next time. 5 Information used and how it was used?
RESULTS
Correlation Between NTS and Task Performance To evaluate the correlation between NTS and task performance, we analyzed the correlation between total NTS scores and each item score and between excess hours and total number of discards. Table 2 shows the correlation coefficients between these indicators. From this table, the correlations among all indicators are low, suggesting that the NTS is not significantly related to task performance.
Table 2. The correlation coefficient between the NTS and performance indexes.
Table available in the original PDF paper.
Performance Index NTS Item Overtime The Number of Wastes Total 0.015 −0.009 Situation awareness 0.097 −0.078 Decision 0.452 0.452 Workload management −0.006 −0.091 Planning −0.064 0.115 Summarize 0.040 0.060 Attitude 0.072 −0.037
Eye Gaze Data To examine the information within the application that participants were looking at during the experiment, we divided the application into 21 areas. We calculated the percentage of gaze accumulation time for each location. The results showed a positive correlation between participants’ task perfor- mance and accumulated gaze time for the coffee and toast start buttons (areas 14, 15, 16, and 18) and the task completion button (area 19) (Table 3). The common function of the buttons in these areas is that they are enabled until the process in progress is completed and become active and operable when the process is completed. Since shorter overtime and a number of wastes, which are task grades, performed better when smaller, we found that partic- ipants who looked longer at the coffee and toast start button and the task completion button area had lower task grades.
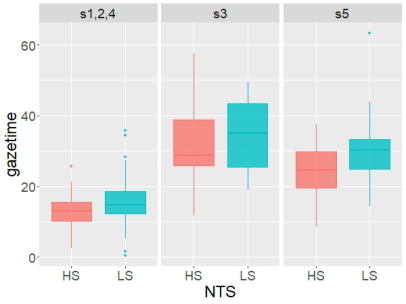
We further analyzed the relationship between NTS scores and gaze accu- mulation time in regions 14, 15, 16, 18, and 19. Figure 3 shows the HS/LS group comparison of cumulative gaze times for areas 14, 15, 16, 18, and 19. The results showed that the LS group of the NTS had significantly longer gaze accumulation times in these regions than the HS group at the 5% level in the steady-state scenarios (Scenarios 1, 2, and 4) and the 10% level in Sce- nario 5, the second emergency scenario. Thus, the LS group looked at these regions significantly longer than the HS group.
Table 3. The correlation coefficient between gaze accumulation and task performance.
Table available in the original PDF paper.
Task Performance Area Overtime The Number of Wastes Start buttons for coffee and toast (Area 14, 15, 16, 18) 0.796 0.521 task completion button (Area 19) 0.601 0.389
An Experimental Approach to Measuring Resilience Potential 69
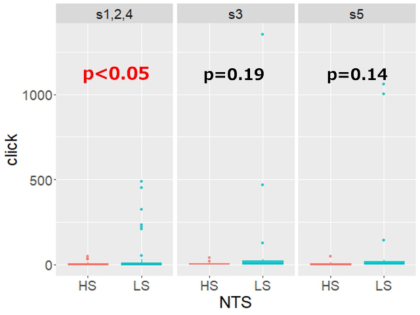
Operation Log Data Areas 14, 15, 16, 18, and 19 are all operation button areas, and the buttons switch between operable and inoperable depending on the progress status. Therefore, we compared the number of times a button in one of these regions was pressed when the button was inactive, which is inoperable, between the HS and LS groups of the NTS. The graphs are shown in Figure 4. The com- parison shows that in the steady-state scenarios (Scenarios 1, 2, and 4), the LS group pressed the buttons in these areas significantly more than the HS group at the 5% level. In other words, the LS group pressed more operation buttons in the inactive state than the HS group.
Figure 3: The HS/LS group comparison of gaze times for areas 14, 15, 16, 18, and 19.Figure 4: The HS/LS group comparison of the number of times areas 14, 15, 16, 18, and 19 were pressed in inactive states.
DISCUSSION
Correlation Between NTS and RP The correlation between NTS and task performance was low in this exper- iment (Table 2). Assuming that the participants’ task performance was attributable to their resilience potential, this suggests that the correlation
between NTS and resilience potential is low. Therefore, Hypothesis 1 was not supported.
Resilient Behavior Analysis Based on Gaze Data In this experiment, there was a positive correlation between the accumulated gaze time and task performance for the coffee and toast start buttons (areas 14, 15, 16, and 18 in Figure 2) and the task complete button (area 19 in Figure 2) (Table 3). These buttons activate the operation when the coffee and toast are ready or all required items are cooked. In other words, they are support functions that tell the user when the individual subtasks that make up the task are complete or when the task as a whole is complete. In this experiment, we found that the longer participants looked at the area of these buttons, the lower their task performance. Although these buttons can- not be operated when they are inactive, it is thought that participants who nevertheless looked at them for a long time were not actively monitoring the various information displayed in the application to understand the num- ber of targets or to recognize the status, but were attempting to understand the status only by the availability of the buttons. In fact, in a post-interview with a participant who had repeatedly hit the task completion button while it was inactive, the participant stated that she had judged whether the target value had been achieved based on the status of the availability of this but- ton. Such behavior is the opposite of resilient behavior, which can adaptively cope with unexpected events by constantly assessing the situation, resulting in lower task performance. The present experiment suggests that the support function, which notifies the user of changes in the situation, may discourage resilient behavior and negatively affect task performance.
CONCLUSION
This study aimed to develop system interactions that improve operators’ RP. As a first step, we conducted experiments to characterize how RP manifests itself in scenarios where users must adapt to changing circumstances. The results are as follows:
- The correlation between NTS and resilience potential is low. - The support function, in which the system notifies the user of changing circumstances, may inadvertently inhibit resilience behavior and negatively affect task performance.
Future research will include a detailed analysis of the relationship between qualitative data, such as interviews and operation logs, and quantitative data, such as eye gaze data. This analysis will help to characterize RP-related thoughts and behaviors and to develop interaction requirements to promote resilient behavior.
ACKNOWLEDGMENT
We thank Professor Etsuko Harada and Harada Laboratory at Tsukuba University for providing this experiment’s “Breakfast Cooking Challenge” application.
An Experimental Approach to Measuring Resilience Potential 71
REFERENCES
Harada, E., et al. (2014). “Individual differences in dynamic task management: A new making multiple breakfast task (Diner’s chef’s breakfast task),” Proceedings of the Japanese Society for Cognitive Psychology, O3-1-2. Hollnagel, E. (2014). Safety-I & Safety-II, Routledge. Hollnagel, E. (2017). Safety-II in Practice, Routledge. Hollnagel, E. Pariès, J. Woods, D. D. & Wreathall, J. (Eds). (2014). Resilience Engi-
neering Perspectives Volume 3 “Resilience Engineering in Practice.” Farnham, UK: Ashgate. Karikawa, D. et al. (2019). “Experimental Study on Resilience using Simplified Simulation Environment,” The Transactions of Human Interface Society, vol. 21 (2), pp. 155–168. Kitamura, M. (2015). “Design of Resilience for Enhancement of Practical Knowl-
edge,” Journal of The Society of Instrument and Control Engineers, vol. 54 (7), pp. 470–478. Kitamura, M. (2017). “Progress in Methodology for Pursuing Safety∼Safety-II and Resilience Engineering,” Human Factors in Japan, vol 21 (2), pp. 37–48. Klein, G. A., Calderwood, R., MacGregor, D. (1989). “Critical decision method for
eliciting knowledge,” IEEE Transactions on Systems, Man, and Cybernetics, 19, (3), pp. 462–472. Kohno, R. (2001). “The Reality of Human Error in Air Traffic Control,” Journal of Human Interface Society 3 (4), 221–228. Nakajima, K. (2017). “The Applicability of Resilience Engineering Theory to
Medical Safety,” Japanese Journal of Endourology 30(1), pp. 54–60. Nakanishi, M., Yao, K. (2018). “Study on Information Design for Supporting Resilient Operation: A Practical Method for Safety-II,” Human Factors in Japan, vol 23 (1), pp. 30—51. Nishido, M. (2011). “Research on the Scaling of Fundamental Competencies for
Working Persons,” Journal of Pool Gakuin University, vol 51, pp. 217–228. Yoshida, H., et al. (2021). “A Study of Design Policy for Air Traffic Control Radar Screen Using the Color Salience Model,” The Japanese Journal of Ergonomics, vol 57 (4), pp. 180–193. Yoshida, H., et al. (2023). “Analysis of Resilient Behavior for Interaction Design,” Proceedings of Human-Computer Interaction International (HCII2023), pp. 182–195.
LISTED IN THE AHFE DIGITAL BOOKSTORE CATALOGUE
Explore the complete digital volume
Human Dynamics, Product Evaluation and Quality
Read this individual research paper free through the original publisher, or explore the full digital proceedings book.
ISBN 978-1-964867-07-6
Explore this ISBN in the AHFE Bookstore ↗Listed in the July 2026 bookstore catalogue; search by ISBN to confirm current availability · Digital book purchase optional