Yumiko Bito, Taro Kanno, Kazumi Kajiyama, Misumi Yamazaki, Haruka Yoshida, Michihiro Tsubaki, Sachika Sharikura (2024). Data Collection and Analysis of Patient and Document Flow During a Disaster Exercise at a Large Hospital. In: Human Error, Reliability, Resilience, and Performance. AHFE Open Access, vol. 132, pp. 44–50. https://doi.org/10.54941/ahfe1004879
Disaster drills are effective for understanding and mastering business continuity plans (BCP) and response plans, and for identifying and improving problems, but the time and effort required to collect data is an obstacle. In this study, we developed a smartphone application to easily record the flow of patients and documents: NFC tags are attached to simulated patients and documents used in training, and they are read at each scene using a dedicated application. This tool can record when and where the patient was in the area, and when and where the documents were issued and received. We also propose several visualization and quantitative analysis methods that can be performed using the acquired data.
Hospitals, especially regional disaster base hospitals, play a critical role in saving lives during a disaster. Therefore, it is important for hospitals to conduct disaster response exercises and thoroughly evaluate the results to understand the current level of response capability and to identify poten- tial problems in disaster response and hospital business continuity. However, because data collection and analysis of disaster exercises is costly in man- power and time, such evaluation has not been well conducted so far. There- fore, this study aims to develop a tool to efficiently collect data on patient and document flow during the exercise.
There have been several studies of data collection during disaster exercises in hospitals. For example, Haverkort et al. (2016) used the Patient Barcode Registration System (PBRS) to track patient flow during an exercise; patients received a wristband with a unique barcode before triage, which allowed the hospital to manage patient information. They used PBRS in an exercise
Data Collection and Analysis of Patient and Document Flow 45
conducted at the Major Incident Hospital (MIH) at Utrecht University Med- ical Center and confirmed that all 120 patients were tracked without loss of patient data, and that the trainees could make appropriate decisions based on the information collected by PBRS in real time. However, PBRS is not easy to implement, which is a major hurdle for many hospitals. In a previous study, we manually collected and analyzed the patient flow data in an exer- cise (Ideguchi et al., 2023; Kanno et al., 2023), which turned out to be very time-consuming and unsustainable.
Furthermore, these previous studies did not cover the document flow dur- ing exercises, such as hospitalization orders and examination request forms. Therefore, it was not possible to capture the entire response processes during training, including information transfer through the exchange of documents.
Against this background, the objective of this study is to develop a tool to record the flow of patients and documents digitally and with minimal effort during a disaster exercise for mass casualties incidents. Specifically, we aim to develop a smartphone application that records the flow of patients and documents using NFC tags.
METHOD
Exercise Overview The disaster exercise covered by this study was conducted at a major hospital in Kanagawa Prefecture, Japan, in 2023. This hospital is designated as a regional disaster base hospital and is thus expected to play a central role in regional disaster medicine. This exercise was designed to deal with mass casualties caused by a major earthquake.
During a disaster, casualties transported from the scenes are triaged at the entrance of the hospital. According to the triage results, they are transported by stretcher or wheelchair to the treatment areas: severe (red), moderate (yellow), minor (green), and fatal (black). In each area, hospital staff provide treatment and, if necessary, issue prescriptions and examination requests to the various laboratories for radiological and specimen examinations.
The exercise scenario was developed in advance by the staff member over- seeing the exercise and was not shared with the exercise participants. The exercise participants made decisions by referring to a card placed on the patient’s chest describing their conditions and symptoms. In the scenario, 46 patients were transported from outside and several patients participated from other hospitals.
Developing a Smartphone Application A data recording application was developed for Android 12 (API Level 31) smartphones. Development was performed with Android Studio 2021.2.1, and the languages used were Java and XML.
Sticker-like NFC tags with recorded IDs are attached in advance to the patient cards for the simulated patients and to the documents used in the exercise. During the exercise, as patients and documents enter and exit each area, a recording staff member scans the tags using the smartphone applica- tion, thereby recording the location and time that patients and documents enter and exit the area.
The data consists of six items: time stamp, ID, area, target, mode, and transportation method. The “Target”is either “Patient”or “Document.” The “mode” is “Enter” or “Exit” for “Patient,” and “Issued” or “Accepted” for “Document.” “Transportation” is recorded only for “Patient” and is selected from “stretcher,” “wheelchair,” “walking,” or “other.”
When an NFC tag is scanned, the ID and the scanned time is written to a csv file in the smartphone’s local storage. After the exercise, this allows a reconstruction of the patient and document flow in the exercise by integrating all the csv files and associating the document IDs and patients IDs.
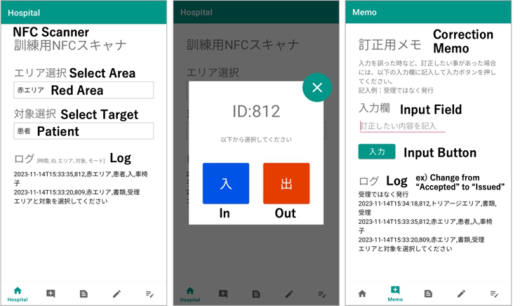
The application is designed with tab-based navigation and has five pages. Figure 1 is a screenshot of the app. On the page for the scan, shown on the left in Figure 1, an area and target are selected from a pull-down menu before an NFC tag is scanned, and a mode and a transport method are selected in a dialog that appears in sequence after the NFC tag is scanned (Figure 1 center). Once the data are recorded, the content is displayed in the log column at the bottom of the screen with the latest record at the top. At this time, the data are written in a csv file. When an NFC tag is scanned by mistake, we can cancel the previous operation by pressing the X button in the upper right corner of the dialog. The memo page, shown on the right in Figure 1, allows the user to make a text memo, which is also written to the csv file. The remaining pages are for reading and writing NFC tags and are used to fill in IDs on the NFC tags.
Figure 1: Screenshots of the smartphone app.
RESULTS AND DISCUSSIONS We collected data in an actual hospital disaster exercise using this app, where 15 people were deployed in each area to record the patient and document flows in the exercise.
During the two-and-a-half-hour exercise, we were able to record the data from 52 of 54 patients and 160 documents; 2 patients were not recorded because they did not appear in the prescribed scenario and did not have NFC tags. While almost all of the patient flow data was recorded, we were not able to fully record the issuance and receipt of documents because it was
Data Collection and Analysis of Patient and Document Flow 47
sometimes difficult for the recorders to find the documents in the player’s hand.
In the following subsections, we show the results of usability evaluation of the application, and also describe the visualization and analysis of the recorded data to evaluate the performance of the exercise.
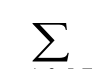
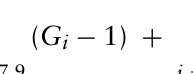
Usability Evaluation A usability evaluation was conducted using the System Usability Scale (SUS) as modified by Bangor et al. (2008). The SUS includes 10 questions scored on a 5-point Likert scale ranging from 1 to 5, and the usability is evaluated by obtaining the SUS score using Equation (1), where Gi is the score of the i-th question. According to Bangor et al. (2008), a SUS score of less than 50.00 indicates Non-Acceptable, between 50.00 and 62.26 Marginal-Low, between 62.26 and 70.00 Marginal-High, and Acceptable if the score is 70.00 or higher.
Equations and mathematical formulas are available in the original paper PDF.
X
Equation reproduced from the original PDF.
(5 −Gi)
Equation reproduced from the original PDF.
[Equation or mathematical symbol available in the original paper PDF]× 2.5 (1)
[Equation or mathematical symbol available in the original paper PDF]
In all, 13 of the 15 recorders participated in the evaluation, and the SUS score was 68.08, rated as Marginal-High; some improvement is needed for practical use, but the usability of the system is sufficient for a prototype.
Visualization of the Flow of Patients and Documents
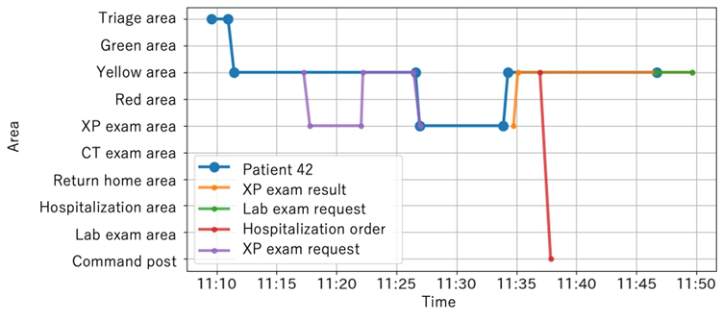
Figure 2 is a flow diagram showing the movements of a particular patient and documents related to the patient. The horizontal axis represents time and the vertical axis the area, where marked points indicate where data were recorded. This visualization allows us to grasp the time lag between the move- ment of documents, that is, the transmission of information, and the actual movement of the patient.
Figure 2: Flow diagram of a particular patient.
Number of Patients and Length of Stay
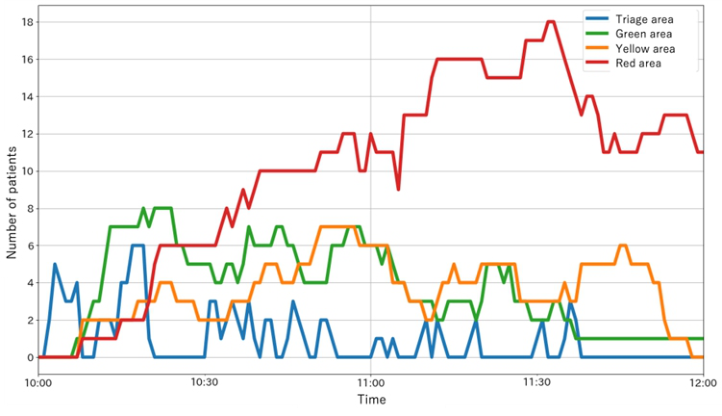
Figure 3 shows the number of patients in the triage area and the three treat- ment areas during the exercise. From Figure 3, we can see that the number of patients in the red area increases, while the number of patients in the green area decreases rapidly. Table 1 presents the length of stay in each area, and shows that the median time spent in the red area is 54.69 minutes, while that in the green area is 8.78 minutes. This evidence suggests that the red area was experiencing a high burden of overcapacity, while the green area still had room for additional work; it is necessary to further investigate the staff allocation and response to see if the red area should have been given the highest priority.
Figure 3: The number patients staying at each area.Table 1. Length of stay in each area (min).
Table available in the original PDF paper.
Triage Green Yellow Red XP CT LOS Number of patients 50 25 13 22 16 11 52 Mean 2.08 17.69 33.03 54.15 7.40 5.96 48.46 Median 1.45 8.78 33.18 54.69 7.53 5.58 49.09 Max 7.10 65.50 57.82 84.92 12.52 11.28 106.85 Min 0.63 2.85 12.58 21.67 1.90 3.18 4.58 SD 1.37 17.53 16.90 17.78 2.70 2.02 28.03
Appropriateness of Medical Examinations
Table 2 shows the number of medical examinations performed during the exercise, comparing the examinations that were actually performed during the exercise with those expected to be performed. Correctly-performed exam- inations is the number of examinations performed that should have been
Data Collection and Analysis of Patient and Document Flow 49
performed, over-performed the number of unnecessary examinations, and under-performed the number of examinations that were not performed as expected.
Table 2 shows that about 65% of the expected X-ray photography (XP) examinations were not performed. On the other hand, about half of the performed examinations were not expected for computerized tomography (CT) and laboratory examinations. There are trade-offs between saving resources and saving life; unnecessary examinations should be avoided to save resources, but saving lives must take precedence. On the other hand, underperformed examinations must be avoided.
Table 2. Number of medical examinations performed during the exercise.
Table available in the original PDF paper.
XP CT Lab Match 13 6 10 Over-performed 3 5 9 Under-performed 24 7 5
DISCUSSION
The data collection in the exercise confirmed that the recording application can be useful for collecting patient flow data, but needs improvement for collecting document flow.
One of the reasons for the incomplete recording of the document flow was that it was more difficult for recorders to notice the presence of doc- uments than of patients. In addition, if multiple documents were stacked on top of each other, forgotten or duplicate recordings were possible. These problems make it difficult to distinguish between inappropriate responses and incompleteness in recording from the recorded data.
The usability evaluation showed that the application was to some extent easy for the recorders to use. It was also found that the accessibility received a relatively lower rating. This may be due to a small bug that caused the recorders frustration. However, this bug has been fixed, so the usability is expected to be better in the future.
The data collected can be used for deeper analyses to find strong and weak points in the exercise and to generate various graphs and visualizations that would be helpful for obtaining an overview of the status of hospital response for better decision making during the exercise, as well as for the post-exercise evaluation.
CONCLUSION
We developed a smartphone application for data collection using NFC tags to digitally and effortlessly record the flow of patients and documents in hospital disaster exercises. The application was used in an actual exercise to collect data. It was confirmed that while the collection of document
flow data needed improvement, the patient flow data were successfully col- lected as expected. It was also confirmed that the application’s usability was acceptable. By analyzing and visualizing the collected data, we identified potential issues requiring further detailed investigation for the evaluation of the exercise.
REFERENCES
Bangor, A., Kortum, P. T., and Miller, J. T., (2008). An Empirical Evaluation of the System Usability Scale,” Intl. Journal of Human–Computer Interaction, Volume 24, No. 6, pp. 574–594. Haverkort, J. M., Bouman, J. H., Wind, J. D., and Leenen, L. P. (2017), Continuous
Development of a Major Incident In-Hospital Victim Tracking and Tracing Sys- tem, Withstanding the Challenges of Time, Disaster Medicine and Public Health Preparedness, Volume 11, No. 2, pp. 244–250. Ideguchi, T., Kanno, T., Umemoto, M., Kajiyama, K., Ikari, R., Yamazaki, M.
and Sharikura, S. (2023). Extensive Data Collection in an In-Hospital Disaster Response Exercise for Evaluating Disaster Resilience, Safety Management and Human Factors, Volume 105, pp. 42–46. Kanno, T., Harada, J., Mitsuhashi, D., Kajiyama, K., and Sharikura, S. (2023). Workas-Imagined vs. Work-as-Done during a Hospital Response to a Disaster, Proc. Int’l Symposium on Resilience Engineering (RE10).
LISTED IN THE AHFE DIGITAL BOOKSTORE CATALOGUE
Explore the complete digital volume
Human Error, Reliability, Resilience, and Performance
Read this individual research paper free through the original publisher, or explore the full digital proceedings book.
ISBN 978-1-964867-08-3
Explore this ISBN in the AHFE Bookstore ↗Listed in the July 2026 bookstore catalogue; search by ISBN to confirm current availability · Digital book purchase optional