Yongsheng Tan, Yu Hsiu Hung (2025). Optimizing E-train Ticket Interface Layout Using HTA and Link Analysis. In: Usability and User Experience. AHFE Open Access, vol. 194, pp. 284–292. https://doi.org/10.54941/ahfe1006691
Nowadays, people can purchase train tickets online anytime and anywhere, making it easier and more convenient to travel by train. Consequently, e-train tickets have gradually replaced traditional paper tickets. While e-train tickets retain the essential information found on paper tickets (such as train number, departure location, destination, and seat information), they also incorporate new features like QR code verification, ticket rescheduling, and refunds. However, the increased functionality has made the interface more complex, and the dense information on e-train tickets can make it difficult for passengers to extract relevant details during their journey. To address this issue, this study was conducted to identify human factors problems associated with the e-train ticket and optimize its layout and interface elements to enhance its usability. Hierarchical Task Analysis (HTA) and Link Analysis were employed in this research. First, a detailed and systematic assessment of the interactions between passengers and e-ticket were described by the hierarchical diagram. Next, the “links” between interface elements and operations were represented and the weight of any possible link between the elements of the e-ticket was calculated as a composite index of its frequency and importance. Based on these findings, an optimized interface layout was proposed, focusing on minimizing the distance between linked interface elements. Usability testing results indicated that the optimized interface significantly enhanced effectiveness, efficiency and satisfaction of the passengers when they interact with the redesigned e-ticket.
The rapid development of digital technology has significantly transformed various aspects of human life, including the way people travel. In the railway transportation sector, the advent of e-train tickets has provided passengers with unparalleled convenience, allowing them to purchase tickets online anytime and anywhere (Awal et al., 2024). These digital tickets are not only eco-friendly compared to traditional paper tickets but also offer additional functionalities, such as QR code verification for quick boarding, options for rescheduling, and the ability to process refunds (Ying et al., 2021). However, with these added features, the complexity of e-train ticket interfaces has increased, posing usability challenges for passengers (He et al., 2023).
Optimizing E-Train Ticket Interface Layout Using HTA and Link Analysis 285
Previous studies have highlighted the importance of user interface (UI) design in improving the overall user experience in transportation systems (He et al., 2023). For instance, research has shown that the layout and display mode of information on e-tickets significantly impact visual search efficiency and user satisfaction (He et al., 2023). Additionally, usability evaluations of ticketing systems, such as those conducted on railway self- service terminals and mobile ticketing applications, have identified key areas for improvement, including simplifying interface elements and enhancing task completion efficiency (Putri and Subiyakto, 2021).
To address these challenges, human factors and ergonomics principles are increasingly being integrated into interface design processes. Among the various methodologies available, Hierarchical Task Analysis (HTA) and Link Analysis have emerged as powerful tools for optimizing interface layouts (Van Westrenen, 2011). HTA provides a structured framework for understanding user interactions by decomposing tasks into subtasks, thereby identifying critical user needs and pain points. Link Analysis complements this approach by evaluating the relationships and dependencies between interface elements, offering insights into how the layout can be reorganized to minimize the cognitive and physical effort required for task completion. These methods have been successfully applied in various domains, including railway operations and human-machine interface design (Saager et al., 2024).
This study leverages HTA and Link Analysis to systematically assess the usability issues associated with e-train ticket interfaces and propose an optimized design. By constructing a hierarchical task model, the study identifies key interaction steps and evaluates the user journey. Subsequently, Link Analysis is used to quantify the frequency and importance of connections between interface elements, enabling the development of a layout that prioritizes user-centric design principles. The proposed redesign is then validated through usability testing, focusing on three core metrics: effectiveness, efficiency, and user satisfaction (Lewis, 2019).
Despite the growing body of research on e-ticketing systems, there remains a gap in optimizing the interface layout to enhance usability. This study aims to address this gap by employing HTA and Link Analysis to identify human factors problems associated with e-train tickets and propose an optimized interface layout. The goal is to improve the effectiveness, efficiency, and satisfaction of passengers when interacting with e-tickets (Van Westrenen, 2011). This research builds on previous work by focusing specifically on the interface layout and user interactions, providing a comprehensive evaluation and optimization strategy (Putri and Subiyakto, 2021).
METHODS
Materials and Participants The e-train ticket of China Railway was used as the subject of this study. Since the end of 2024, China Railway has ceased providing paper tickets and has fully implemented electronic train tickets. Moving forward, it is estimated that over 4 billion passenger trips per year will rely on this e-train ticket for travel. The e-train ticket not only provides a QR code for entry
286 Tan and Hung
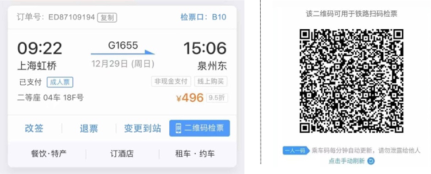
and exit at train stations but also includes traditional information found on paper tickets, such as train number, departure time, departure and arrival locations, gate number, and seat number. Additionally, it offers features like ticket rescheduling, refunds, destination changes, shopping, hotel booking, and ride-hailing services (see Figure 1).
To determine whether the redesigned train ticket improves usability compared to the original version, 64 university students were randomly divided into two equally sized groups, and their task performance on e-train tickets with different layouts was recorded. Female participants (62.5%, n = 40) outnumbered male participants (27.5%, n = 24). The age range was 18 to 22 years, with a mean age of 20.32 years and a median age of 20 years (46.88%, n = 30). Among all participants, 12 were freshmen (18.8%), 20 were sophomores (31.3%), 28 were juniors (43.7%), and 4 were seniors (6.3%).
Figure 1: E-train ticket and QR code (irrelevant information removed from the screen).
To investigate participants’ familiarity with the e-train ticket, they completed a 7-point Likert scale questionnaire, where “1” represented “strongly unfamiliar” and “7” represented “strongly familiar.” The mean familiarity scores for Group 1 and Group 2 were M = 5.31 (SD = .74) and M = 5.47 (SD = .84), respectively. An independent samples t-test indicated no significant difference in familiarity between the two groups (t(62) = 1.23, p = .43).
Hierarchical Task Analysis (HTA) The e-train ticket incorporates a range of information and elements. To analyse the interactions between these elements, it is first necessary to organize the functions provided by the system. Hierarchical Task Analysis (HTA) enables a detailed and systematic assessment of the interactions between human operators and technical systems (Stanton, 2006). As the “best known task analysis technique (Kirwan and Ainsworth, 1992)”, HTA is particularly effective for conducting systems analysis, describing the system in terms of its goals. HTA assumes a hierarchical relationship between goals and sub-goals, where sub-goals are described using measurable performance criteria.
By constructing an HTA for the e-train ticket system, the interactions between operators and the system were analysed in detail. First, various scenarios in which passengers use the e-train ticket were identified, and
Optimizing E-Train Ticket Interface Layout Using HTA and Link Analysis 287
all tasks within each scenario were defined. Next, participants were video- recorded for 5–10 minutes as they performed walkthroughs of these tasks. Finally, participants and researchers jointly reviewed the videos to identify which interface elements were used for each task, the sequence of operations, task accuracy, and time consumption. These observations served as part of the data for subsequent link analysis and usability testing.
Link Analysis (LA) By constructing an HTA for the e-train ticket system, the interactions between operators and the system were analyzed in detail. First, various scenarios in which passengers use the e-train ticket were identified, and all tasks within each scenario were defined. Next, participants were video-recorded for 5–10 minutes as they performed walkthroughs of these tasks. Finally, participants and researchers jointly reviewed the videos to identify which interface elements were used for each task, the sequence of operations, task accuracy, and time consumption. These observations served as part of the data for subsequent link analysis and usability testing.
After obtaining the frequency of each link, the relative frequency index of a function can be computed using the following formula:
Frequency index of function k
Equations and mathematical formulas are available in the original paper PDF.
where m is the total number of functions, and fk is the relative frequency of usage for function k.
Researchers also need to rank the importance of each interface element in descending order. The importance index of a function can be calculated as follows:
Importance index of function k
where iv is the importance value for function k obtained from each pair-wise comparisons, either 1 or 0.
And for any transition from element ito elementj, the link value Lij should be: m X
288 Tan and Hung
where Cijk is the number of movements from element i to element j in function k. This value could be used as relative weight of each transition.
Once the data calculation phase is complete, the creation of the link diagram and link table can begin. Creating a schematic layout of the interface under analysis and adding the links between interface elements results in the construction of the link diagram. The link table displays the same information as the link diagram but presents it in the form of a data table. Components are positioned at the heads of the rows and columns, and the link values are entered into the appropriate cells.
Layout Redesign The goal of LA is to rearrange the layout to minimize the ‘overall cost’ while the operator uses the target interface under certain task requirements (Lin and Wu, 2010). A redesign was proposed based on reducing the distance between the linked interface components. Specifically, according to the link value between components, components with higher values are prioritized to be placed in adjacent positions, thus achieving an optimized layout of the interface. The link value is calculated based on the importance and usage frequency of the components. Compared to traditional paper tickets, the E- train ticket interface is more diverse in terms of color, gradient, grayscale, interactivity, and layout. Therefore, its redesign not only relies on link value but also integrates other interface optimization techniques. For example, different colors are used to divide the interface into functional sections.
Usability Assessment To verify the differences in operational performance between the redesigned interface and the original interface, two sets of usability tests were conducted. Both sets followed the same experimental procedure, performed the same tasks, and recorded completion time and accuracy via video. The subjective satisfaction in usability was measured through a 7-point Likert scale questionnaire. After completing all tasks, participants were required to rate their satisfaction with the interface layout, with “1” indicating “extremely dissatisfied” and “7” indicating “extremely satisfied.”
RESULTS
Task Analysis Through HTA, the e-train ticket system is clearly defined as four primary tasks: confirming pre-departure information, heading to the waiting room, traveling to the train carriage, and post-arrival services. These primary tasks are further broken down into 12 functions and 23 supporting operations. It is important to note that since the ticket interface primarily carries visual information such as gaze time, location, train number, etc., the operations in this study are not limited to hand movements between interface elements but also include eye movements during the search and extraction of visual information (confirmed using the retrospective think-aloud method).
Optimizing E-Train Ticket Interface Layout Using HTA and Link Analysis 289
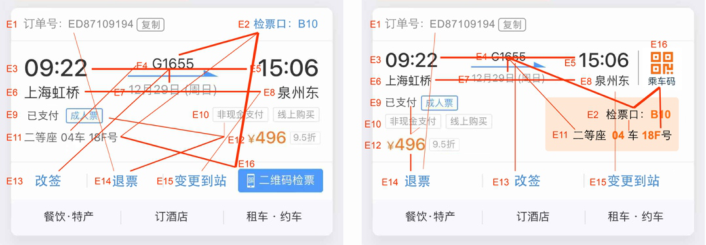
Link Table and Link Diagram Based on formulas (1), (2), and (3), the link values are calculated and a Link table, as shown in Table 1, is constructed. Each value represents the strength of the link between two elements, with higher values indicating stronger links. From the link values in Table 1, it can be seen that during the layout redesign, priority should be given to placing E2 and E16, E3 and E5, E12 and E14, as well as E11 and E16 as close as possible. The links are represented by lines, with the thickness of the lines reflecting the strength of the link values. These links are overlaid on the original and redesigned e-train ticket interfaces, resulting in a link diagram as shown in Figure 2. A comparison reveals that the overall distance of the links has been significantly reduced in the redesigned interface. From a usability perspective, the overall movements required for operating the interface are effectively reduced, which, in the long term, could alleviate excessive physical demand and visual search.
Figure 2: Comparison of the original (left) and the redesigned (right) interface (the thickness represent the strength of link).
290 Tan and Hung
Verification of the Redesigned Layout Although the link diagram in Figure 2 provides a visual indication that the overall distance of links in the redesigned interface is shorter, it is still necessary to further verify statistically whether there are significant differences in usability between the two interfaces. In terms of task completion speed, the redesigned interface (M = 125.09, SD = 15.85, N = 32) was significantly faster than the original interface (M = 154.91, SD = 17.40, N = 32), with an average difference of 29.82 seconds, showing a significant difference (t(62) = 7.16, p<.001). Regarding task completion errors, although the redesigned interface (M = 6.91, SD = 2.57, N = 32) had fewer errors than the original interface (M = 8.25, SD = 2.86, N = 32), the difference between the two groups was not statistically significant (t(62) = 1.98, p = .053). For subjective satisfaction, the redesigned interface (M = 6.38, SD = .55, N = 32) was significantly higher than the original interface (M = 4.44, SD = .95, N = 32), with an average difference of 1.94, showing a significant difference (t(62) = –9.98, p<.001).
DISCUSSION
The study aimed to optimize the e-train ticket interface layout using Hierarchical Task Analysis (HTA) and Link Analysis to enhance usability. The results indicate that the redesigned interface significantly improved task completion speed and user satisfaction compared to the original interface. Although the reduction in task completion errors was not statistically significant, the overall usability benefits are evident. This suggests that the application of HTA and Link Analysis effectively addressed the human factors problems associated with the e-train ticket interface.
The findings highlight the importance of optimizing interface layout based on user interactions and task requirements. By minimizing the distance between frequently used interface elements, the redesigned e-train ticket interface reduced the cognitive and physical effort required for task completion. This approach aligns with human factors principles, which emphasize the need to prioritize user-centric design to enhance efficiency and satisfaction (Campbell et al., 2016). The integration of HTA and Link Analysis provided a comprehensive framework for identifying critical user interactions and optimizing the interface layout. HTA allowed for a detailed understanding of user tasks and subtasks, while Link Analysis quantified the relationships between interface elements (Kuncara et al., 2021). This combination of methods enabled the development of a layout that prioritized high-frequency and high-importance links, resulting in a more intuitive and efficient interface (Habermann et al., 2016).
The optimized e-train ticket interface has significant practical implications for railway transportation systems. With the increasing reliance on e-tickets, improving their usability can enhance the overall travel experience for passengers (Kuncara et al., 2021). The findings suggest that similar methodologies could be applied to other transportation interfaces, such as mobile ticketing apps or self-service kiosks, to address usability challenges and improve user satisfaction (Wang et al., 2024). Future research could
Optimizing E-Train Ticket Interface Layout Using HTA and Link Analysis 291
explore the application of HTA and Link Analysis in different contexts, such as varying user demographics or transportation modes. Additionally, incorporating other user experience metrics, such as emotional responses or perceived ease of use could provide a more holistic evaluation of interface design. Furthermore, longitudinal studies could assess the long-term impact of optimized interfaces on user behaviour and system performance (Kuncara et al., 2021).
CONCLUSION
This study successfully applied HTA and Link Analysis to optimize the e-train ticket interface layout, resulting in significant improvements in usability. The findings emphasize the importance of user-centric design principles in enhancing interface efficiency and satisfaction. By minimizing the distance between linked interface elements, the redesigned layout reduced the cognitive and physical effort required for task completion. This research contributes to the growing body of literature on human factors in transportation interfaces and provides a valuable framework for future interface optimization efforts.
REFERENCES
Awal, M. R., Arzin, T. A., Islam, M. M. and Hasan, M. T. (2024). Understanding railway passengers’ E-ticketing usage intention in an emerging economic context: application of an extended technology acceptance model, Arab Gulf Journal of Scientific Research, Volume, 42 No. 3. Campbell, J. L., Brown, J. L., Graving, J. S., Richard, C. M., Lichty, M. G.,
Sanquist, T. and Morgan, J. (2016). Human factors design guidance for driver- vehicle interfaces, Report No. DOT HS, Volume 812, No. 360. Habermann, A. L., Kasugai, K. and Ziefle, M. (2016). “Mobile app for public transport: A usability and user experience perspective”, proceedings of the Internet of Things. IoT Infrastructures: Second International Summit, Rome, Italy. He, S.-j., Zhi, J.-y., Du, Y. and Feng, S. (2023). Effects of design features of
train electronic guidance interface on visual search, behavior, and usability, International Journal of Industrial Ergonomics, Volume 93. Kirwan, B. and Ainsworth, L. K. (1992). A guide to task analysis: The task analysis working group. CRC press. Kuncara, T., Putra, A. S., Aisyah, N. and Valentino, V. (2021). Effectiveness of the
e-ticket system using QR codes for Smart Transportation Systems, International Journal of Science, Technology & Management, Volume, 2 No. 3. Lewis, J. R. (2019). Measuring perceived usability: SUS, UMUX, and CSUQ ratings for four everyday products, International Journal of Human–Computer Interaction, Volume, 35 No. 15. Lin, C.-J. and Wu, C. (2010). Improved link analysis method for user interface
design–modified link table and optimisation-based algorithm, Behaviour & Information Technology, Volume, 29 No. 2. Putri, S. N. and Subiyakto, A. (2021). “Evaluating User Interface of A Transport Application Using Usability Evaluation Methods”, proceedings of the 2021 9th International Conference on Cyber and IT Service Management (CITSM), IEEE.
292 Tan and Hung
Saager, M., Kruse, J. and Naumann, A. (2024). Who is Responsible for What?
Combining HTA and RACI for Modelling Cooperation in Remote Operation Center of Trains in Future Railway Sector, Human Factors and Systems Interaction, Volume 154, No. 154. Stanton, N. A. (2006). Hierarchical task analysis: Developments, applications, and extensions, Applied ergonomics, Volume 37, No. 1. Stanton, N. A., Salmon, P. M., Rafferty, L. A., Walker, G. H., Baber, C. and
Jenkins, D. P. (2017). Human factors methods: A practical guide for engineering and design, CRC Press. Van Westrenen, F. (2011). Cognitive work analysis and the design of user interfaces, Cognition, Technology & Work, Volume, 13 No. 1. Wang, M., Mehrotra, S., Wong, N., Roberts, S. C., Kim, W., Romo, A. and
Horrey, W. J. (2024). Human-Machine interfaces and vehicle Automation: A review of the literature and recommendations for system Design, Feedback, and alerts, Transportation Research Part F: Traffic Psychology and Behaviour, Volume, 107. Ying, D., Weixing, L., Xiang, G., Bing, S. and Xiaohui, X. (2021). “Research on Electronic Ticket System and Key Technology for Road Passenger Transport”, in: 2021 IEEE International Conference on Power, Intelligent Computing and Systems, IEEE. pp. 101–104.
LISTED IN THE AHFE DIGITAL BOOKSTORE CATALOGUE
Explore the complete digital volume
Usability and User Experience
Read this individual research paper free through the original publisher, or explore the full digital proceedings book.
ISBN 978-1-964867-70-0
Explore this ISBN in the AHFE Bookstore ↗Listed in the July 2026 bookstore catalogue; search by ISBN to confirm current availability · Digital book purchase optional