Chang Liu, Mat Redhuan Samsudin, Yuwen Zou (2025). The Impact of Visual Design Elements in Tea Bag Packaging on Consumer Behaviour: A Prototype and Pilot Study. In: Affective and Pleasurable Design. AHFE Open Access, vol. 164, pp. 199–209. https://doi.org/10.54941/ahfe1006076
Previous research has emphasised the importance of product packaging on consumers' purchase intention; however, empirical studies exploring the specific mechanisms of how packaging design visual elements influence consumer purchase intention remain scarce. In particular, there is a lack of investigation into different levels (sub-dimensions) of design elements, which fails to provide specific guidance for packaging design strategies. This study aims to fill this gap by developing bagged tea packaging design prototypes as visual stimulus materials to examine the effects of packaging design visual elements on consumer responses. First, this study developed 14 bagged tea packaging design prototypes through orthogonal experimental design, incorporating different combinations of five key visual design elements (colour, graphics, logo, typography and layout). These prototypes, after expert evaluation, were used as visual stimulus materials. Second, this study conducted a pilot study with 168 young consumers aged 20 to 29 using scales adapted from previous well-established measures (assessing consumers' brand experience, purchase intention and satisfaction) after expert validation. Preliminary findings indicate that the packaging design prototypes based on orthogonal testing can serve as visual stimulus materials for respondents, and the scale developed in this study has demonstrated good reliability and validity through confirmatory factor analysis (CFA), making it suitable for subsequent research. Moreover, considering sample size limitations, this study employed Kruskal-Wallis tests for preliminary exploration. The visual elements of packaging design (such as Colour, Graphics and Layout) showed significant effects on consumers' brand experience and purchase intention, providing support for the research hypotheses; although the significance of Logo and Typography is limited, they still provide a methodological basis for subsequent exploration of their direct and indirect effects. The results of this pilot study encourage further methods of enhancing consumer purchase intention using orthogonal test-based packaging design prototypes as stimulus materials.
In the era of experiential consumption, along with the ever-changing demands of consumers, packaging is not only a holder of goods but also a key contact point for consumers to interact with the brand. Recent market research suggests that 39 per cent of consumers say that well-designed packaging motivates them to make impulse purchases (Luttenberger, 2023). Thus, the importance of packaging vis-à-vis branding and other marketing variables has been increasingly recognised by managers, especially in the broad consumer goods arena, where it plays a crucial role in consumers’ purchasing decisions (Rundh, 2013).
From a marketing perspective, most scholars classify packaging design elements into two categories: visual element (e.g. package colour) and informational element (e.g. product information) (Silayoi and Speece, 2004, 2007; Cortina-Mercado, 2017; Heide and Olsen, 2017; Wulansari, 2019; Ck, Fukey and Wankhar, 2022). Some scholars have also categorised packaging design elements into visual element (i.e. derived from visual cues) and verbal element (i.e. derived from verbal cues) based on cue utilisation theory (Adam and Ali, 2014; Benachenhou, Guerrich and Moussaoui, 2018; Setiowati and Liem, 2018; Al-Samarraie et al., 2019). The two different classifications mentioned above, although different in presentation, essentially emphasise the dual function of packaging design in conveying information and attracting consumers’ attention. Although these studies have explored consumer responses to design elements through questionnaires, they lack visual stimulus materials and detailed analysis of design element sub-dimensions, limiting their practical value for packaging design strategies.
From a design perspective, visual elements are more effective and influential for packaging design because they are directly noticed by consumers and quickly communicated at the time of purchase (Vyas and Bhuvanesh, 2015). Solving visual problems is at the heart of packaging design (Klimchuk and Krasovec, 2021), making it particularly important to explore the visual elements of packaging design. However, few studies have combined design and marketing perspectives to examine how specific visual elements at brand touchpoints influence consumers’ brand experience, purchase intentions and satisfaction. Exploration of these conceptual links will not only provide a better understanding of the influences on consumer purchasing decisions but is also key to the development of packaging design strategies.
The bagged tea market provides a key research context for studying the impact of packaging design, particularly in China. Despite its relatively late start in China, bagged tea is gradually being embraced by China’s younger demographic, showing promising growth, and there is significant scope for its future development, with young consumers aged 20 to 29 representing a significant market segment (Ipsos, 2020; iiMedia Research, 2021). Existing research has largely ignored how specific visual design elements can influence brand experience and purchasing behaviours of this demographic. Research on these elements can not only provide designers with appropriate design strategies and scientific basis when designing packaging but also provide
The Impact of Visual Design Elements in Tea Bag Packaging on Consumer Behaviour 201
a feasible path for the use of experiential marketing in packaging design. Therefore, it is necessary to conduct this study to verify the relationship between the above variables. This pilot study aims to address these gaps through the following two main objectives: RO1: Develop and validate a prototype bagged tea packaging design as a visual stimulus material through an orthogonal experimental design.
RO2: Examine the association of visual elements of packaging design with consumer brand experience, purchase intention and satisfaction.
RESEARCH DESIGN A two-stage research design was used in this study. The first stage used an orthogonal design of experiments approach to develop a packaging prototype, with the design prototype being passed by an expert evaluator before progressing to the next stage to ensure its validity as a stimulus material for the subsequent stages. The second stage involved data collection through experimental surveys (self-administered questionnaires in conjunction with stimulus materials). This stage involved the development of the measurement tool, i.e. the questionnaire, which was validated by experts and then used with the stimulus material for data collection. The collected data were subjected to a confirmatory factor analysis (CFA) to verify the reliability and validity of the measurement tool, and then the Kruskal-Wallis test was used to test the relationship between the visual design elements and consumer responses.
Development of Packaging Design Prototype This study divides the factors and levels of the visual design elements of the packaging through a literature review, as shown in Table 1. The factors in the orthogonal test are set as five visual design elements of the packaging: Colour, Graphics, Logo, Typography, and Layout.
After determining the factors and levels, the researcher chooses and designs an orthogonal table adapted to the present study. The orthogonal table is key to arranging the factors and levels for combination. In a traditional orthogonal table, the number of levels corresponding to each factor needs to be consistent. However, among the five factors in this study, the number of levels corresponding to them was not consistent. Therefore, to meet the complexity of the mixed orthogonal design, the standard orthogonal table needs to be adapted by applying the proposed level method and the combination method to obtain the mixed orthogonal table suitable for this study. The researcher mapped the mixed orthogonal table with the factors and levels, and verified whether there were any missing combinations of the factors’ levels, to obtain the final mixed orthogonal table of the present study, as shown in Table 2.
Based on the different combinations of factors and levels in the mixed orthogonal table obtained in the previous step, 14 packaging design prototypes were designed using Adobe Illustrator (version 26.4.1) and Adobe Photoshop (version 24.0.0) software. To objectively evaluate the packaging design prototypes, six academic experts and industry practitioners were
invited to evaluate the prototypes with a combination of scales and open- ended questions.
To quantitatively assess the cumulative responses of the expert practitioners, a five-point Likert scale was used to assess each of the 14 packaging design prototypes, with six questions for each prototype. The Likert scales help translate expert responses into closed-ended questions and provide a more objective and quantifiable assessment metric (Struck, Hensen and Plokker, 2010). Simultaneously, open-ended questions give respondents the opportunity to elaborate on previous responses (Hoffmann and Berg, 2020). Therefore, this expert validation combines the scale with open-ended questions to evaluate the packaging design prototype in a more comprehensive way.
Table 1: Factors and levels of visual elements of packaging design.
Table available in the original PDF paper.
Factor Level Colour Monochromatic harmony, analogous harmony, contrast harmony Graphics Figurative, abstract, hybrid Logo Logomark, logotype, combination mark Typography Chinese character print typeface, calligraphy typeface, artistic typeface Layout Bilateral symmetry, grid, centralizedized, diagonal
Table 2: The final mixed orthogonal table of this study.
Measurement Development All variables were measured in this study with multiple question items. The source of the items relied mainly on well-established measurement scales developed by previous scholars in related studies, which were screened and adapted to fit the measurement items of this study. Brand experience was
The Impact of Visual Design Elements in Tea Bag Packaging on Consumer Behaviour 203
measured in three sub-dimensions: sensory experience, affective experience and intellectual experience. Because the items in the scales were adapted from scales developed by previous scholars and to meet the purpose of this study, the wording of the scales was slightly modified to fit this study.
Data Collection By using a combination of statistical power analysis and rules of thumb to determine the sample size, the sample size for the pilot study phase of this study was between 100 and 200 and could not be less than the minimum sample size of 123 determined from the statistical power analysis. The sample characteristics were then further determined. To ensure a homogeneous sample, i.e. a sample with a high degree of similarity in terms of key socio- demographic characteristics, it was determined that the population for this study would be the main consumers of bagged tea brands/products in the city of Shijiazhuang in the Hebei Province of China, corresponding to the age range between 20 and 29 years. This study used a seven-point Likert scale ranging from one to seven, with one meaning ‘strongly disagree’ and seven meaning ‘strongly agree’, to collect data by distributing questionnaires to the target population through this measurement tool.
Before distributing the questionnaire, the study was approved by the Research Ethics Committee of Universiti Teknologi MARA (UiTM) (Reference No. - REC/11/2023 (PG/MR/453)) to ensure compliance with high ethical standards.
The pilot study of the questionnaire was conducted from 26 February to 3 March 2024 to assess the reliability and validity of the measurement scale and to further revise the scale based on the results of the analysis. A total of 184 questionnaires were sent and 181 valid questionnaires were collected in this pilot study, achieving a valid recovery rate of 98 per cent, which meets the standard recovery rate and can provide relatively reliable results (Song, 2014). The quality of the questionnaires was further screened, and questionnaires with an answer duration of less than 180 seconds were excluded, resulting in 168 questionnaires being retained for subsequent data analysis.
RESEARCH RESULTS AND DISCUSSION Verification of Packaging Design Prototype
The experts who carried out the assessment of the packaging design prototypes were divided into two groups, researchers and designers, and each group was asked to respond to the prototypes. A total of six experts, one female and five males, were involved in the evaluation, and the gender of the respondents did not affect the results of the test. The ratings of the six experts were entered into SPSS (version 29.0) software for statistical processing, and a combination of quantitative and qualitative data, i.e. descriptive statistical analyses and expert evaluations, were used to summarise the expert evaluations, supplemented with tables and heat maps to visualise the distribution of ratings for each prototype.
Table 3 shows the descriptive statistics, i.e. the minimum, maximum, mean and standard deviation of the ratings of the 14 packaging design prototypes. The mean value indicates the experts’ perceptions, while the standard deviation is used to measure the consistency or variability of the ratings among the experts. A low standard deviation (less than 0.5) indicates good agreement between experts on the mean scores, while a high standard deviation (greater than 1.0) indicates disagreement between experts (Struck, Hensen and Plokker, 2010). From the results, it can be seen that the mean of the experts’ scores on the 14 packaging design prototypes are all very high. The standard deviations are small and negligible, indicating that the experts are more consistent in their evaluation of these design prototypes.
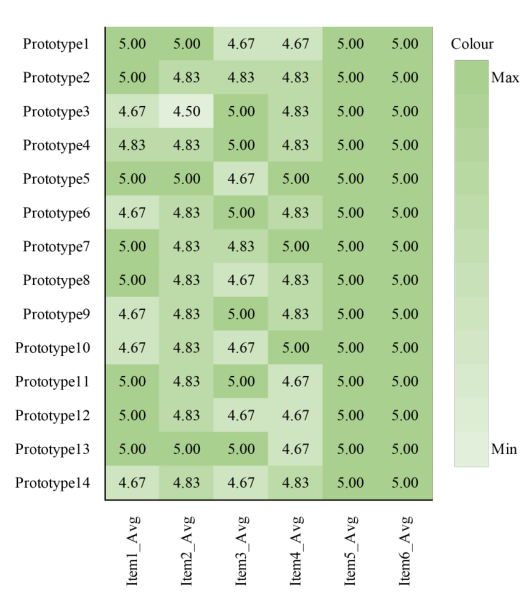
Figure 1 shows the heat distribution of the 14 packaging design prototypes under each question, which visualises the high and low ratings and distribution. Dark colours indicate high ratings, and light colours indicate low ratings. From the distribution of the colour shades in the figure, the average scores of each packaging design prototype in questions five and six are all the same, receiving very high ratings from the experts, indicating that the experts unanimously and highly agree that all the design prototypes comply with the industry guidelines and are adapted to the requirements of this study.
Table 3: Descriptive statistics results of packaging design prototypes.
Sample Characteristics and Descriptive Statistics Analysis The study used SPSS (version 29.0) software to analyse the data using descriptive statistics from 168 valid questionnaires. The results showed that all the respondents in this pretest were within the age group of 20 to 29 years old and all of them had purchasing experience of bagged tea, thus fully meeting the characteristics of the sample set for this study. Among them, 51.8 per cent were male and 48.2 per cent were female. The majority of respondents indicated that their education level was undergraduate (67.3 per cent).
The Impact of Visual Design Elements in Tea Bag Packaging on Consumer Behaviour 205
Figure 1: Heatmap of average item scores by packaging design prototype (author’s own work).
Measurement Model Assessment In order to ensure the internal consistency and reliability of the measurement scales in this study, 168 valid questionnaires were analysed and assessed for Constituent Reliability (CR) and Convergent Validity using Mplus (version 8.3) software, and Validated Factor Analysis (CFA) using Maximum Likelihood to confirm the validity and reliability of the constructs used in this study.
After removing items with low factor loadings (SE4 and AE2), the final measurement model demonstrated good psychometric properties. As shown in Table 4, all constructs exhibited satisfactory Constituent Reliability (CR > 0.7) and Average Variance Extracted (AVE > 0.5), indicating good reliability and convergent validity of the measurement scales.
Model Fit To ensure that the model structure matches the data, this study used Mplus (version 8.3) software to assess the model fit of 168 valid questionnaires. As shown in Table 5, the measurement model demonstrated good fit across all indices: chi-square (χ2), chi-square/degrees of freedom ratio (χ2/df), Comparative Fit Index (CFI), Tucker-Lewis Index (TLI), Root Mean Square Error of Approximation (RMSEA) and Standardised Root Mean Square Residual (SRMR). All values met the recommended thresholds, indicating a good fit between the model and the data.
Table 5: Fit indices for the structural equation model.
Table available in the original PDF paper.
Full Name Value Recommended Compliance Fit Index Standards χ2 Chi-square statistic 198.217* Lower values are
Yes preferable
χ2/df Chi-square to degrees
1.586 ≤3 or ≤5 Yes
of freedom ratio CFI Comparative fit index 0.958 > 0.90 Good, > 0.95
Discriminant Validity In order to ensure the independence between the different constructs of this study, the 168 valid questionnaires were analysed and assessed for differential validity (DV) using Mplus (version 8.3) software, which assesses
The Impact of Visual Design Elements in Tea Bag Packaging on Consumer Behaviour 207
the measurements by means of a correlation matrix, i.e. the square root of the Average Variance Extracted (AVE) of a latent variable should be greater than the correlation coefficient of this variable with any other variable in the study (Fornell and Larcker, 1981). As shown in Table 6, the diagonal values of the constructs are greater than the majority of the values in their respective columns, and the correlation coefficients satisfy the above assessment requirements, which suggests that the measurement scale in this study possesses good discriminant validity, helping to ensure the validity of the results of the study.
Table 6: Correlations matrix.
Table available in the original PDF paper.
Constructs CR AVE SE AE IE SA PI SE 0.756 0.512 0.716 AE 0.835 0.627 0.615 0.792 IE 0.820 0.534 0.264 -0.105 0.731 SA 0.903 0.700 0.902 0.598 0.014 0.837 PI 0.909 0.714 0.345 -0.042 0.417 0.120 0.845
Kruskal-Wallis Test To verify the validity of the experimental manipulation, this study used the Kruskal-Wallis test to analyse the perceived differences between the 14 prototypes and the five design elements. The results showed that the 14 prototypes showed significant differences in all measurement dimensions (χ2(13) = 42.5−103.8, p < 0.001, ε2 = 0.255−0.621).
Further analysis of the manipulation effects of the design elements revealed that the design element Colour showed significant differences on all measured dimensions (χ2(2) = 3.07−90.93, p < 0.05), with the strongest effect (ε2 = 0.368−0.545) on the satisfaction dimension (SA1-SA4). The design element Graphics showed varying degrees of significant differences on several dimensions (p-values ranging from p < 0.001 to p < 0.05), with effect sizes of ε2 = 0.045−0.110 on those dimensions that were significantly different. The design element Layout showed significant effects only on the intellectual experience (IE1-IE2) and purchase intention (PI1-PI4) dimensions (χ2(3) = 0.553−81.981, p < 0.05, ε2 = 0.054−0.491), while the differences were not significant on the other dimensions (p > 0.05). Most of the difference test results for the design elements Logo and Typography were not significant (p > 0.05). Overall, the manipulation test results support the validity of the experimental design on the design elements of Colour, Graphics and Layout, with limited effects for Logo and Typography.
CONCLUSION
In this study, an orthogonal test was used to develop a packaging design prototype as a visual stimulus material and to verify its significant effect on respondents’ behaviour. The study also developed a scale suitable for brand experience research, which proved its good reliability and validity through
confirmatory factor analysis (CFA), and was able to support subsequent more complex causal path analyses.
The findings indicate that the visual elements of package design (e.g. Colour, Graphics and Layout) have a significant effect on consumers’ brand experience and purchase intention, providing support for the research hypotheses; although the significance of Logo and Typography is limited, they still provide a methodological basis for subsequent exploration of their direct and indirect effects. These findings provide practical guidance for brands to convey brand experience and enhance consumers’ purchase intention through packaging design, and further emphasise the central role of visual design in experiential marketing.
This study has some limitations, such as sample size restrictions that may affect the generalisability of the results. However, this pilot study has validated the feasibility of the experimental design and provided optimisation directions for subsequent studies. Future research is recommended to test the causal path between brand experience and packaging design under a larger sample.
REFERENCES
Adam, M. A. and Ali, K. (2014) ‘Impact of Verbal Elements of Packaging of Packaged Milk on Consumer Buying Behaviour’, 5(5). Al-Samarraie, H. et al. (2019) ‘Packaging design elements and consumers’ decision
to buy from the Web: A cause and effect decision-making model’, Color Research & Application, 44(6), pp. 993–1005. Available at: https://doi.org/10.1002/ col.22427. Benachenhou, S. M., Guerrich, B. and Moussaoui, Z. (2018) ‘The effect of packaging elements on purchase intention: Case study of Algerian customers’, Management Science Letters, pp. 217–224. Available at: https://doi.org/10.5267/ j.msl.2018.2.004. Ck, V., Fukey, L. N. and Wankhar, V. (2022) ‘Does Packaging Affect Consumer
Preference During the Purchase of Chocolate?’, ECS Transactions, 107(1), pp. 5827–5838. Available at: https://doi.org/10.1149/10701.5827ecst. Cortina-Mercado, M. (2017) ‘Effect of Packaging Design in the Purchase Decision Process: A Comparison of Generations’, Global Journal of Business Research, 11(2), p. 16. Available at: https://doi.org/Available at SSRN: https://ssrn.com/ abstract=3041635. Fornell, C. and Larcker, D. F. (1981) ‘Structural Equation Models with Unobservable
Variables and Measurement Error: Algebra and Statistics’, Journal of Marketing Research, 18(3), p. 382. Available at: https://doi.org/10.2307/3150980. Heide, M. and Olsen, S. O. (2017) ‘Influence of packaging attributes on consumer evaluation of fresh cod’, Food Quality and Preference, 60, pp. 9–18. Available at: https://doi.org/10.1016/j.foodqual.2017.02.015. Hoffmann, K. and Berg, S. (2020) ‘Survey Research: Useful, Valuable Findings
Require Hard Work’. iiMedia Research (2021) Report on the status quo and consumption trends of China’s teabag industry in the first half of 2021. Available at: http://www.iimedia.com.cn/ consult.jsp. Ipsos (2020) Tea Flavor Preferences and Consumption Patterns of Post-90s New
Consumers. Paris. Available at: https://www.ipsos.com/en-my.
The Impact of Visual Design Elements in Tea Bag Packaging on Consumer Behaviour 209
Klimchuk, M. R. and Krasovec, S. A. (2021) Bao zhuang she ji: Cheng gong pin pai de su zao li: Cong gai nian gou si dao huo jia zhan shi = Packaging design: Successful product branding from concept to shelf. Shanghai: Shang hai ren min mei shu chu ban she. Luttenberger, D. (2023) 2023 Packaging Trends. London. Available at: https://
www.mintel.com/global-packaging-trends. Rundh, B. (2013) ‘Linking packaging to marketing: How packaging is influencing the marketing strategy’, British Food Journal, 115(11), pp. 1547–1563. Available at: https://doi.org/10.1108/BFJ-12-2011-0297. Setiowati, R. and Liem, Y. (2018) ‘Impact of Packaging Design on Perceived Quality,
Perceived Value, Brand Preference, and Repurchase Intention of Candy Products in Jakarta’, p. 10. Silayoi, P. and Speece, M. (2004) ‘Packaging and purchase decisions: An exploratory study on the impact of involvement level and time pressure’, British Food Journal, 106(8), pp. 607–628. Available at: https://doi.org/10.1108/00070700410553602. Silayoi, P. and Speece, M. (2007) ‘The importance of packaging attributes: a conjoint
analysis approach’, European Journal of Marketing, 41(11/12), pp. 1495–1517. Available at: https://doi.org/10.1108/03090560710821279. Song M. (2014) A Study on the Relationship between Brand Experience and Consumer Purchasing Intention in Smart-phone Industry. PhD dissertation. Dalian University of Technology. Available at: https://kns.cnki.net/KCMS/ detail/detail.aspx?dbcode=CDFD&dbname=CDFDLAST2015&filename=10155 74289.nh&v= (Accessed: 22 September 2022). Struck, C., Hensen, J. and Plokker, W. (2010) ‘Usability evaluation of a prototype
design tool for uncertainty propagation and sensitivity analysis’, pp. 15–22. Vyas, H. V. and Bhuvanesh V. (2015) ‘Packaging Design Elements and Users Perception: A Context in Fashion Branding and Communication’, Journal of Applied Packaging Research, 7(2), pp. 95–107. Available at: https://doi.org/ 10.14448/japr.04.0005. Wulansari, A. S. (2019) ‘Food product packaging design as marketing tools in
purchase decision’, 2(2), p. 12.
LISTED IN THE AHFE DIGITAL BOOKSTORE CATALOGUE
Explore the complete digital volume
Affective and Pleasurable Design
Read this individual research paper free through the original publisher, or explore the full digital proceedings book.
ISBN 978-1-964867-40-3
Explore this ISBN in the AHFE Bookstore ↗Listed in the July 2026 bookstore catalogue; search by ISBN to confirm current availability · Digital book purchase optional