Yuchen Yuan, Xiaojun Liu (2025). Investigating Interface Layout Optimization for Enhanced Visual Search Efficiency in Industrial Manufacturing Systems. In: Intelligent Human Systems Integration (IHSI 2025): Integrating People and Intelligent Systems. AHFE Open Access, vol. 160, pp. 331–340. https://doi.org/10.54941/ahfe1005838
This study examines interface layout optimization to enhance visual search efficiency and cognitive performance in industrial manufacturing systems, addressing the high cognitive demands of human-machine interfaces. By improving information visualization, interface design can significantly enhance operators' comprehension and response time, ultimately boosting production efficiency. Two experiments were conducted: Experiment A assessed six layout configurations, identifying LT and MT as the most efficient for visual search. Experiment B used eye-tracking analysis to compare MT and LT layouts, with Scheme 1 (MT layout) demonstrating superior cognitive efficiency, logical structure, and user satisfaction. These results confirm the effectiveness of the proposed design standards and highlight the need for data-driven, intelligent interface layouts in modern manufacturing. The findings suggest that advanced information visualization within HMIs fosters coordination and efficiency in industrial ecosystems, supporting innovative future developments in interface design.
In industrial manufacturing systems, optimized information presentation enhances operators’ cognitive efficiency, ultimately boosting overall production efficiency. Human-machine interfaces (HMIs), as crucial channels for information transmission, can be studied through interface design to meet the information visualization demands during the production process, improving operators’ comprehension speed of interface data (Castellano et al., 2013). Research indicates that interface layout significantly affects cognitive efficiency. For instance, Xiaoli et al. (2021) investigated the impact of different CNC interface layouts on cognitive efficiency through physiological measurements, while Wenze (2018) employed information entropy theory to study the effect of interface complexity in nuclear power plant monitoring through eye-tracking and electroencephalography experiments. McGrath et al. (2016) confirmed the improvement in search efficiency due to icon quantity and arrangement, such as horizontal layouts.
Industrial manufacturing system information visualization exhibits unique characteristics driven by big data. Firstly, modern interfaces deviate from traditional layouts, focusing on data analysis, presenting information through explanatory charts like device status and production line data (Wu, 2020). These charts are vital for interpreting information. Secondly, with technological advancements and increased data granularity, there’s a rise in the need for interfaces to effectively handle and display diverse data, enhancing users’ information understanding and processing capabilities. Common visualization tools include bar charts, line graphs, and pie charts, which use color, text, and graphical design to enhance information display and relationship depiction (Chen, 2019). Thirdly, the surge in data volume poses a challenge to spatial organization, necessitating the optimization of layout and information density to facilitate quick information retrieval for users, a pressing issue in interface design (Rabl et al., 2012).
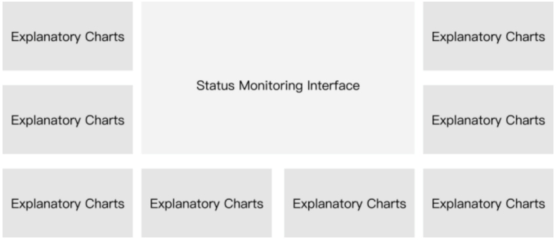
INTERFACE LAYOUT IN INDUSTRIAL MANUFACTURING SYSTEMS Industrial manufacturing system interfaces typically require the display of extensive data visualization, resulting in various layout configurations (Li, 2015). Generally, the central area of the interface features a main graphic, serving as the primary information display, often presenting status monitoring of maps, production lines, and equipment. Surrounding this main graphic are explanatory icon modules designed to analyze multidimensional data within the graphic (Xue, 2015). The interface’s information can be classified into two categories: theme status monitoring and explanatory icons, with diverse layout options, as shown in Figure 1.
Figure 1: Complex human-machine interface layout.
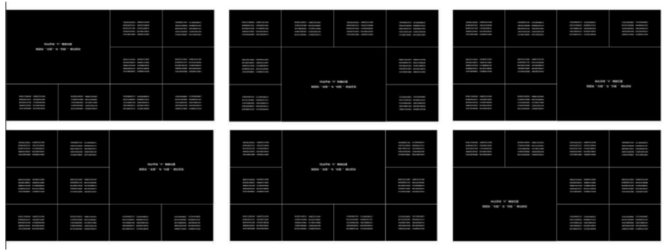
In interface design, adhering to aesthetic principles and ensuring balanced element proportions, such as similar module sizing, is critical. Layouts must avoid both overcrowding and insufficiency in information elements to support functionality and effectively communicate key data. Adjusting layout areas affects information visibility, with single-page content ideally occupying less than 60% of the screen to enhance cognitive efficiency and prevent overload. For explanatory icons, the recommended layout area is also below 60% to meet optimal interface design standards. Based on industrial
Investigating Interface Layout Optimization for Enhanced Visual Search Efficiency 333
manufacturing system interface guidelines, six layout configurations are identified (Figure 2), each with comparable space for the main graphic and explanatory icons, differing in spatial arrangement. Further analysis will assess the strengths and limitations of each layout.
Figure 2: Industrial manufacturing system information interface layout division.
EXPERIMENT A This experiment evaluated the impact of six distinct interface layouts on visual search efficiency, measuring reaction time and accuracy to identify the optimal layout and visual priority within each configuration (Guo & Qian, 2006; Wu & Zhou, 2020; Ding, 2004). Eighteen participants (balanced by gender, aged 23–26) with normal or corrected vision engaged in tasks on a 1920x1280 screen using E-prime, adhering to HCI standards. Six layouts (LT, MB, RB, RT, MT, LB) each contained nine regions—one for monitoring and eight for information (Figure 3). Participants searched for a target letter “A” among distractors (O, M, H) with random positioning in the middle seven positions within each information block, minimizing positional bias. Symmetrical letter distribution ensured even content across layouts. Reaction time and accuracy metrics highlighted layout efficiency, while a subjective questionnaire validated participants’ experiences under each layout.
Figure 3: Experiment interface material diagram.
334 Yuan and Liu
RESULT
Analysis of Experiment Results Tables 1 and 2 present the average response times and accuracy for each layout. The MB layout showed the fastest reaction time but lower accuracy, while LT and MT layouts provided balanced performance with moderate reaction times and relatively higher accuracy. Slower layouts included LB, RT, and RB, with RB having the longest search time and lowest efficiency. LT and MT demonstrated above-average response times and accuracy, indicating these as more efficient for search tasks.
Table 1. Task response time statistics.
Table available in the original PDF paper.
Table 2. Task response accuracy statistics.
Table available in the original PDF paper.
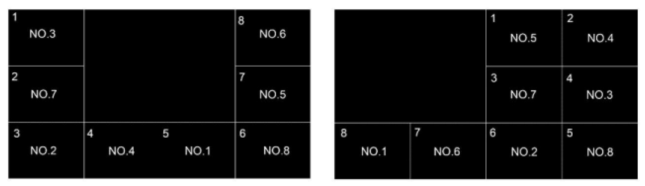
Position-Based Search Efficiency In the MT and RT layouts, search efficiency across module positions (Figure 4) showed the highest efficiency just below the center and the lowest in the bottom-right corner.
Figure 4: Interface position labeling and visual priority ordering.
Investigating Interface Layout Optimization for Enhanced Visual Search Efficiency 335
Table 3. Task response time statistics per layout location.
Table available in the original PDF paper.
Table 4. Statistics on the response accuracy of each layout position task.
Table available in the original PDF paper.
EXPERIMENT B Objective of the Eye Movement Study for Interface Design
The objective of this study was to compare the cognitive efficiency of two interface layouts through eye-tracking metrics, identifying the design with higher search efficiency. Using cumulative fixation time, fixation count, and average fixation duration, the study assessed visual representation, while search efficiency was evaluated through fixation metrics and gaze path analysis. Heatmaps were also used to assess overall design coherence.
Experimental Setup The participants were experienced users of digital twin software for workshop production lines, comprising 18 graduate students (9 males and 9 females) in Mechanical and Industrial Design Engineering from Southeast University, all with normal vision. The experiment was conducted in the Human Factors Laboratory at Southeast University, using a Tobii X2-30 eye tracker on a 27-inch, 1920x1080 resolution display (Table 5).
Two optimized layouts were tested: Design 1 (MT layout) and Design 2 (LT layout). The study consisted of a learning phase, in which participants familiarized themselves with key information modules (e.g., warning messages), and a task phase, where they located specific information following instructions. Each module was encountered 18 times during learning, while the task phase included 16 rounds of targeted searches, designed to simulate real-world information retrieval and decision-making (Table 6).
336 Yuan and Liu
Table 5. Parameters of eye-tracking device.
Table available in the original PDF paper.
Parameters of the Eye-Tracking Device Term Value Term Value
Head movement range 50 ∗36 ∗70 cm Sampling frequency 30 Hz Acquisition method Both eyes System delay 50 −70 ms Precision 0.4
Maximum gaze angle 36
Table 6. List of experimental task questions.
Table available in the original PDF paper.
List of Experimental Task Questions Questions Options Answers
Information Module
B
What is the maintenance status of the drying oven?
A. Not repaired B. Under repair
Warning Information
A
What is the maintenance information for the drill press?
A. Not repaired B. Under repair What’s the lot number of this batch? A. 12345 B. 18968 A
Production Data Board
A. 76 % B. 70% A
What is the production efficiency of today’s product?
A. 66% B. 80% B
Equipment Monitoring
What is the actual production capacity of the cap rolling and light checking process?
A.76% B. 80% A
What is the actual production rate of the cooling and drying process?
What is the temperature at 12:00? A. 22 B. 21 A Real-time Data What is the humidity at 12:00? A. 75% B. 70% A
What is the energy consumption of line A? A. 1080 B. 980 B Workshop Overview What is the energy consumption of line D? A. 1680 B. 1780 B
A. 20.2 B. 15.8 B
What is the output of production line B on Tuesday?
Production Trend
A. 24.5 B. 25.5 A
What is the output of production line A on Friday?
A. 250 B. 300 B
What is the freeze-drying pressure for lyophilized powder injection A , production line B ?
Production Details
A. –48 B. –45 B
What is the freeze-drying temperature of production line A for lyophilized powder injection A?
A. 36 B. 46 A
How many quality inspectors are there in production line C?
Staff Information
A. 68 B. 88 B
How many basic operators are there in production line B?
Investigating Interface Layout Optimization for Enhanced Visual Search Efficiency 337
RESULT
The eye-tracking study evaluated cognitive performance and search efficiency across two interface designs by analyzing key metrics, including fixation time, fixation count, and total visit time. The results, summarized below, provide insights into optimizing interface layout for improved user efficiency.
Layout Influence on Search Efficiency: Layout differences significantly affected search efficiency, as shown in Tables 7 and 8, Solution 1 yielded fewer fixations and shorter total visit times, indicating more efficient information retrieval than Solution 2, which required higher fixation counts and longer access times.
Table 7. Fixations count statistics.
Table available in the original PDF paper.
Table 8. Average access time statistics.
Table available in the original PDF paper.
First Fixation Time as a Complexity Indicator: First fixation time, used to measure interface complexity, showed an overall average of 187ms for Solution 1 versus 146ms for Solution 2 (Table 9). These results suggest that Solution 1 supports easier navigation and higher cognitive performance.
Search Logic and Path Efficiency: Analysis of scanning paths demonstrated that Solution 1 enabled shorter, more direct search paths with fewer revisits, indicating a more logical and user-friendly layout.
338 Yuan and Liu
Table 9. List of experimental task questions.
Table available in the original PDF paper.
Design Coherence Assessment: Heatmaps reveal that Solution 1 focuses user attention on target areas, evidenced by a predominant red zone in the warning message module, supporting high coherence and minimal distraction. In contrast, Solution 2 displayed a broader range of attention colors, suggesting reduced focus and coherence.
In summary, the study confirms that Solution 1 outperforms in cognitive efficiency, search logic, and coherence, establishing a solid foundation for optimizing interface design in industrial applications.
DISCUSSION
Eye movement studies demonstrated that both design schemes excelled in cognitive performance through their visual encoding, confirming the effectiveness and practicality of the designs. Comparative analysis indicated that Scheme 1 surpassed Scheme 2 in search efficiency, browsing logic, and overall coherence. In the eye movement experiments, Scheme 1 was the preferred choice.
The results showed that both schemes had an average initial fixation time below 300ms, indicating high information comprehension efficiency. Subjective satisfaction surveys rated both in terms of overall experience, interface language, learning efficiency, and visual elements above 6, reflecting satisfactory levels. The interpretive design of the icon module was similar and received high praise, with users expressing high satisfaction for both. Integrating objective and subjective evaluations, both schemes demonstrated strong performance and high levels of cognitive performance and user satisfaction, validating the effectiveness of the industrial manufacturing system interface information visualization design guidelines.
When applying industrial manufacturing system interface information visualization design standards, Scheme 1 stood out in eye movement experiments and user satisfaction surveys. It exhibited superior cognitive efficiency, assisting users in quickly and accurately searching for information. Scheme 1 scored highly in interface satisfaction, language, and visual elements, but there was room for improvement in learning efficiency. Logical analysis revealed that Scheme 1’s scanning path was straightforward and
Investigating Interface Layout Optimization for Enhanced Visual Search Efficiency 339
information arrangement was well-structured, enhancing cognitive efficiency. The overall coherence analysis showed that Scheme 1’s heatmap was more focused, reducing distractions and facilitating rapid target identification. Subjectively, Scheme 1 had a better overall experience compared to Scheme 2, with ratings in other aspects being nearly equivalent. Integrating objective and subjective assessments, Scheme 1 excelled in information recognition efficiency and user satisfaction, hence being designated as the optimal solution.
CONCLUSION
The ongoing transformation of industrial manufacturing systems, driven by advancing technology, is pushing the study of interface information visualization towards a more futuristic and comprehensive upgrade. The integration of intelligence amplifies the strengths of the human-information- physical system, fostering interconnectedness, coordination, and inspiration. Information visualization strengthens this connection, fueling deeper innovation potential in industrial ecosystems.
REFERENCES
Castellano, G., Cimino, M. G. C. A., Fanelli, A. M., Lazzerini, B., Marcelloni, F., & Torsello, M. A. (2013). A multi-agent system for enabling collaborative situation awareness via position-based stigmergy and neuro-fuzzy learning. Neurocomputing. Chen, X. (2019). Research on Construction and Visualization Representation of
Complex Information Space Networks Based on Big Data (Thesis, Southeast University). Ding, Y. (2004). Ergonomics. Beijing: Beijing Institute of Technology Press. Guo, F., & Qian, S. (2006). Ergonomics. Beijing: China Machine Press. J. Behav. Decis. Making (2010). An eye-tracking study on information processing in risky decisions: Evidence for compensatory strategies based on automatic processes. Li, J. (2015). Method of Human-Computer Interface Information Encoding with
Balanced Cognitive Load (Thesis, Southeast University). McGrath, L., Bresciani, S., & Eppler, M. J. (2016). We walk the line: Icons provisional appearances on virtual whiteboards trigger elaborative dialogue and creativity. Computers in Human Behavior. Rabl, T., Sadoghi, M., Jacobsen, H. A., et al. (2012). Solving Big Data Challenges
for Enterprise Application Performance Management. Proceedings of the VLDB Endowment, 5(12), 1724–1735. Tang, W. (2018). Research on Interface Information Complexity and User Decision Making Based on Eye Movement and EEG Experiments (Thesis, Southeast University). Wu, S. (2020). Research on the Complexity of Search Task Interface (Situation Map)
Based on Eye Tracking Data Visual Analysis (Thesis, Beijing University of Posts and Telecommunications). Wu, X., & Zhou, F. (2020). Design Cognition-Research Methods and Visual Representation. Nanjing: Southeast University Press.
340 Yuan and Liu
Wu, X., Yan, B., Xue, C., & Xu, P. (2021). Information Presentation of Intelligent Manufacturing Production Line Information System Based on Gravity Model. Journal of Southeast University (Natural Science Edition), 51(01), 145–152. Xue, C. (2015). Methods and Applications of Human-Computer Interaction Digital
Interface Design for Complex Information Systems. Nanjing: Southeast University Press.
LISTED IN THE AHFE DIGITAL BOOKSTORE CATALOGUE
Explore the complete digital volume
Intelligent Human Systems Integration (IHSI 2025): Integrating People and Intelligent Systems
Read this individual research paper free through the original publisher, or explore the full digital proceedings book.
ISBN 978-1-964867-36-6
Explore this ISBN in the AHFE Bookstore ↗Listed in the July 2026 bookstore catalogue; search by ISBN to confirm current availability · Digital book purchase optional