Hui Meng, Xiaojun Liu (2024). Feasibility and Effectiveness of 2D Highlighting Methods Applied in 3D Modeling. In: Intelligent Human Systems Integration (IHSI 2024): Integrating People and Intelligent Systems. AHFE Open Access, vol. 119, pp. 665–675. https://doi.org/10.54941/ahfe1004531
The requirements for human-computer interaction in digitalized 3D production line systems are increasing in combination with the advancement of intelligent manufacturing research. However, there is a dearth of interaction research on these systems, particularly about information highlighting. This work examines the viability and impact of utilizing 2D highlighting techniques on 3D models inside digitalized 3D manufacturing line systems. A reintegrated classification method for visual variables is proposed, and the consequences and properties of static visual variables applied to 3D maps are addressed in detail. 3D highlighting methods summarized based on the 2D highlighting guidelines proposed by Robinson A. are scored by an expert scoring method. Which resulted in the selection of three highlighting methods: hue, transparency, and texture. Experiments were conducted on the three selected highlighting methods to examine the feasibility of utilizing 2D visual variables in 3D models and the impact of three variables - hue, texture, and transparency - on highlighting effects in 3D models. All three highlighting methods attracted the attention of the subjects because there was no significant difference in the effect of the different highlighting methods on reaction time(RT). Additionally, the correlation coefficient between the highlighting methods and the mean RT was the smallest, and the number of symbols and the type of symbols highlighted had a significant effect on RT. At the same time, the error rates associated with the three highlighting methods were relatively small, and the mean score of all the methods on the subjective questionnaire was above 3 points. This shows that the three highlighting methods have no problem in effectively highlighting. Objective data analysis shows that there is no doubt that the hue highlighting method has the best highlighting effect, and the transparency highlighting method has the worst effect, because transparency has the highest error rate in terms of both response time and error rate, and it has the worst efficiency among different types and numbers of highlighting symbols. Additionally, the subjective evaluation results confirm that transparency received the lowest score in terms of subjective evaluation. The outcomes of the experiments demonstrate how well these strategies work to lower error rates and increase search efficiency. At the same time, a set of guidelines applicable to 3D highlighting is summarized: saliency, ease of realization, and reduction of visual target complexity. But still, the study also identifies certain drawbacks and suggests areas for future investigation. These include examining the effects of dynamic variables and other perceptual channels on highlighting, contrasting the highlighting techniques in various target environments, and confirming the viability and efficacy of the methods. The investigation and assessment of visualization highlighting techniques for 3D models in digital 3D manufacturing line systems offered by this work is helpful.
With the in-depth research of Industry 4.0 and smart manufacturing, the interaction and integration of the physical world and the information world have become the core issues to promote the changes in the manufacturing industry. In this context, the concept and technology system of digital twins have been proposed by academia and industry to solve the above problems (Guo and Zhang, 2020). Different from the ordinary industrial system inter- face, the digital 3D production line system features a real-time connection between a virtual model and the physical world. This connection creates a dynamic, 3D display. At present, there are numerous types of research on visualizing dynamic information and 3D models. Additionally, in the con- text of a digital 3D production line, the highlighting function plays a crucial role in its visualization. When using the related system, error alarms and
the acquisition of important information are closely linked to the highlight- ing function. Therefore, it is necessary and promising to study the rendering properties and highlighting techniques of real-time 3D models for digital intelligent manufacturing systems.
Visual variables play a crucial role as integral elements of graphic sym- bols, serving diverse purposes within geographic information systems (GIS). There are certain similarities between 3D GIS and digital 3D production line systems, as they both require 3D display. 3D GIS has extensively explored model visualization, whereas research on model visualization in the context of digital twin systems is relatively limited. Therefore, insights from 3D GIS can be leveraged to enhance the digital twin system’s model visualization capabilities.
In 1967, Bertin made the initial proposition of the visual variables of map symbols and introduced this concept into the field of cartography (Ling, Wang and Ding, 2017). Carpendale M (Carpendale, 2003) initiated a scholarly discourse on the utilization of visual variables in computer systems. Ling Jinshan et al. (Ling, Wang and Ding, 2017) analyzed and evaluated the application effect of visual variables of static map symbols. The traditional types of visual variables were reintegrated, eliminating some unreasonable types, and a new classification system for visual variables was established. Chen Yufen (Chen, 1995) thinks that the visual variables proposed by Bertin are a broad concept, that does not apply to some maps therefore she proposes that the visual variables for constructing a map symbol are shape, size, color, brightness, pattern, and texture. Bai Yalan et al. (Bai et al., 2021) mentioned the various visual variables commonly used in maps. They also proposed visual variables specifically applicable to micro-map variables. Seipel et al. (Stefan et al., 2020) showed that transparency is not a standalone visual vari- able, but that it also affects the color of the 3D model, and the visual salience in the scene. Xu Zhiyong et al. (Xu et al., 2006) defined the static parameters of 3D map symbols. Shojaei et al. (Shojaei et al., 2013) evaluated some of them according to the requirements of 3D map visualization and proposed a comprehensive set of features for an interactive 3D map visualization system.
At any given time, only a small fraction of the information registered by the visual system reaches a level of processing that directly affects behavior. Human visual processing resources are limited (Itti and Koch, 2000). Wolfe J.M. and T.S. Horowitz (Wolfe and Horowitz, 2004) classi- fied visual attributes based on their ability to direct attention through a bottom-up mechanism. Robinson A. (Robinson, 2011) suggests that high- lighting methods must fulfill three basic criteria: saliency, versatility, and ease of implementation. It also proposed three basic guidelines for highlighting methods.
There exist numerous classifications of static visual variables. Diverse per- ceptions exist regarding the classification of static visual variables, and a universally accepted standard is lacking. Hence, in order to investigate the uti- lization of static visual variables in three-dimensional displays, it is imperative to compile a comprehensive list of static visual variables that are appropriate for such displays. This will serve as a foundation for subsequent experimental research in this field.
Feasibility and Effectiveness Study of 2D Highlighting Methods Applied in 3D Modeling 667
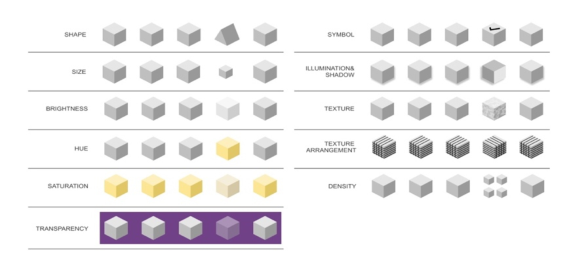
CHARACTERIZATION AND ANALYSIS OF VISUAL VARIABLES Combined with prior studies on static visual variables and Wolfe J.M.and T.S. Horowitz. (Wolfe and Horowitz, 2004) proposed attributes that may guide visual attention are guided by various attributes, the following variables are summarized (see Figure 1).
Figure 1: Static visual variables in 3D modeling.
The static visual variables of the above 3D models were analyzed and screened according to the three basic criteria that must be satisfied by a saliency approach proposed by Robinson A. (Robinson, 2011): saliency, ver- satility, ease of implementation. In addition, highlighting should fulfill the following three criteria to support the visually oriented analysis process: Firstly, highlighted observations should not change shape or size after being highlighted. Secondly, the visual properties of the observations should be maintained. Finally, the state surrounding the highlighted object should be preserved to support pattern analysis. Combining the above three points, shape, size, and density are excluded due to changes in shape, size, or surrounding state.
The significance of the remaining seven static visual variables, namely brightness, hue, transparency, saturation, lighting and shadow, texture, and texture direction, was tested through a questionnaire. A total of 14 experts (all of whom are industrial design masters) were invited to participate in this questionnaire survey. They were asked to rate the highlighting effect of var- ious static visual variables on a scale of 1 to 5, with 1 indicating not very prominent and 5 indicating very prominent. The weighting analysis of the experts’ scores was conducted using the priority graph method, and the sum is performed for each row to obtain the total value (TTL). Hue has the high- est importance with a weight share of 26.531%, followed by Texture with a share of 22.449%, and Transparency with a share of 18.367%. Saturation has the lowest importance and, therefore, the lowest weight of 2.041% (see Table 1).
In order to assess the reasonableness of the expert ratings, the data were tested for consistency. It can be observed that 14 experts rated the effect of 7 static visual variables highlighting (see Table 2). The final ICC correlation
668 Meng and Liu
coefficient value is 0.783 (95% CI:0.576∼0.948), and the ICC intra-group correlation coefficient value is higher than 0.75, which implies high consis- tency of the evaluation, i.e., it means that the scoring given by the 14 experts in this case has a very high level of credibility and a high level of consistency. Therefore, the expert scores are valid.
Table 1. Calculation results of priority graph weight.
Table available in the original PDF paper.
Term Mean TTL(Indicator score) Weight value Texture direction 5.067 3.500 14.286% Texture 8.400 5.500 22.449% Lighting and Shadows 3.867 1.500 6.122% Transparency 7.333 4.500 18.367% Saturation 3.733 0.500 2.041% Hue 9.067 6.500 26.531% Brightness 4.533 2.500 10.204%
Unique metric ICC(C,1) 0.783 0.576 ∼0.948 Average metric ICC(C,K) 0.981 0.950 ∼0.996 C denotes consistency, 1 denotes a unique measure, and K denotes an average measure.
EXPERIMENT The main objective of this experiment is to examine the feasibility of uti- lizing 2D visual variables in 3D models and the impact of three variables - hue, texture, and transparency - on highlighting effects in 3D models. In this experiment, animation was used as a stimulus, and the research objectives were selected based on the relevant studies mentioned above. The first three methods of static highlighting chosen were hue, texture, and transparency. A user test was designed to investigate the efficiency of highlighting several static visual variables in a 3D model. Response time and accuracy of behav- ioral indicators were measured to evaluate the efficiency and effectiveness of the highlighting methods.
SUBJECTS The 22 subjects who took the test were all students at Southeast University. The average age of the subjects was 25 years old. In Dukaczewski D.’s study, it was pointed out that there may be differences in the perception of visual variables among different age groups, so all participants come from early adulthood (20–30).
STIMULI The background used for the test consisted of a sheet of fifteen square model matrices. The five different types of symbols appearing on the model map for
Feasibility and Effectiveness Study of 2D Highlighting Methods Applied in 3D Modeling 669
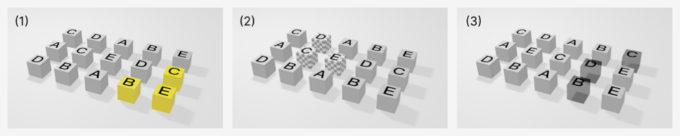
the test are all letter symbols. Each symbol is placed in a 100 × 100-pixel box, and the fonts used are all 96 PingFang SC. Additionally, all symbols are displayed in black color. The highlighting material for the hue attribute uniformly uses yellow as the color for the highlighting effect to prevent the influence of different hues. The highlighting material for the texture attribute selects grayscale texture to avoid the impact of the hue. The highlighting material for the transparency attribute maintains a consistent level of trans- parency, ensuring that the original hue remains unchanged and does not affect the final result (see Figure 2).
Figure 2: Highlighting methods used in the experiment: (1) Hue highlighting (2) Texture highlighting (3) Transparency highlighting.
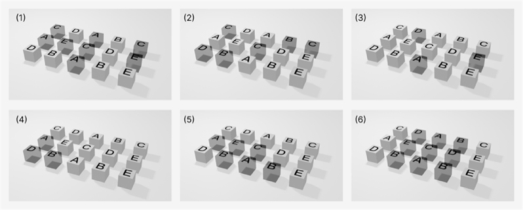
PROCEDURE The experiment utilized a within-group design, where all subjects were exposed to the same three-dimensional model interface. Three, six, or nine- letter symbols were highlighted simultaneously on the map. In each case, there were two spatial distributions: one where the highlighted symbols were relatively clustered, and the other where they were scattered among the inter- face. Three different spatial arrangements were used for the letter symbols to prevent subjects from memorizing their locations, thereby eliminating the potential impact of location on the overall experiment (see Figure 3). Thus, there were a total of 3 × 2 × 3 = 18 combinations, each with a specific num- ber of target highlighted letter symbols. It was up to the subject to choose the total number by selecting the appropriate number key (i.e., the correct answer options were 1, 2, 3, 4, or 5). All 18 combinations were visualized using hue, transparency, and texture highlighting methods, resulting in a total of 54 3D models for each subject. These 3D models were presented to the subjects in a randomized order, which would have eliminated the effects of practice and fatigue.
In the test, subjects were asked to indicate the number of symbols of a spe- cific type that were highlighted on each 3D model distribution map. First, the target symbols were presented to the subject. When the subject was ready to proceed, a key on the keyboard was pressed and a map without any highlight- ing appeared. 450 milliseconds (ms) later, certain symbols on the map were automatically highlighted. After this, subjects performed the task by pressing the appropriate number key on the keyboard (1, 2, 3, 4, or 5), which repre- sented the number of highlighted symbols of the target type. Then, the next target symbol appeared and the process was repeated. Before the actual test round, all subjects were required to perform five practice rounds so that they would become accustomed to the test.
670 Meng and Liu
Figure 3: Different distribution models in the experiment: (1) (2) (3) dispersed spatial distribution; (4) (5) (6) gathering spatial distribution.
Finally, subjects filled out a questionnaire that assessed their experience with the various highlighting methods. The questionnaire included the fol- lowing prompt: “Please rate your experience with the different highlighting methods on a scale of 1 to 5, with 1 representing the lowest rating and 5 representing the highest rating.”
RESULTS
Reaction Time Analysis A total of 1,188 reaction time (RT) data were collected in the present study. RT refers to the duration between the moment the subject observed the task image stimulus (T1) and the moment the subject completed the task (T2), specifically calculated as T2-T1. To ensure the accuracy of the subsequent analyses, the normality of the RT distribution was assessed. The p-value, which was found to be less than 0.005, indicated that the distribution did not adhere to the ex-Gaussian distribution.
In order to ensure the appropriate advancement of the subsequent exper- imental analysis, a parametric transformation was conducted on the data. The goodness-of-fit test using Minitab showed a p-value of 0.363 using the Johnson transform, which is greater than the predetermined significance level of 0.05. Therefore Johnson transform was used to transform the data at the time of response.
Among the data collected, the overall mean RT was 4357.99 milliseconds (ms), and a total of 92 incorrect responses were recorded, resulting in an overall error rate of 7.744%. A two-sample Kolmogorov-Smirnov (KS) test was conducted in Python to compare the dis- tribution of correctly answered samples and incorrectly answered samples using Python, and the p = 0.9994>0.05, proving that there is no significant difference between the distributions of the two samples, suggesting that they follow the same distribution.
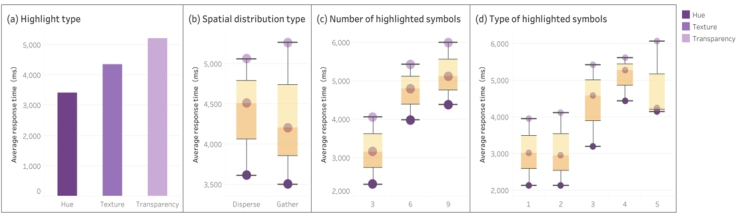
It is evident from the data that the mean RT of the three highlighting tech- niques, namely hue, texture, and transparency, are 3416.42ms, 4364.19ms, and 5207.30ms, respectively. Notably, the mean RT for hue is the shortest (see Figure 4), while transparency has the longest RT. In relation to spatial distribution, it is observed that the mean RT for dispersed data is longer
Feasibility and Effectiveness Study of 2D Highlighting Methods Applied in 3D Modeling 671
compared to clustered data. Regardless of whether the data is dispersed or gathered, the display method using hue consistently yields the shortest RT, while transparency consistently results in the longest RT. Furthermore, in the case of gathered distribution, the mean RT for hue and texture is shorter compared to dispersed distribution, whereas the mean RT for transparency is longer in gathered distribution compared to dispersed distribution. The duration of the gathered distribution is longer compared to the dispersed distribution.
The general trend of the mean RT of the three highlighted symbol types exhibited an overall increase as the number of symbol types increased from 1 to 5. However, it is worth noting that both hue and texture displayed a slight decrease in mean RT when transitioning from symbol types 1 to 2. Nevertheless, the magnitude of this decrease was not substantial. Further- more, the difference in reaction time observed between highlighting symbol types 1 and 2 was not significant. In contrast, the mean RT spans a signif- icant variation when selecting different symbol types, ranging from 2 to 3. The mean RT for texture and hue exhibits a close proximity when the high- lighted symbol type is 5, and is comparatively lower than the mean RT when the highlighted symbol type is 4. The mean RT for the three highlighting techniques exhibits an upward trend as the number of highlighted symbols increases.
Figure 4: The average reaction time of three highlighting methods under different conditions.
A correlation analysis was performed to examine the relationship between the three highlighting methods and the mean RT. The analysis revealed a sta- tistically significant difference (p<0.05) in the mean reaction time (RT) based on the highlighting method, the type of highlighted target symbol, and the number of highlighted symbols. The correlation coefficients for these vari- ables were −0.163, 0.709, and 0.738. These findings suggest a significant positive correlation between the number of highlighted letters and the mean RT. The correlation coefficient between spatial distribution type and mean RT is −0.098, which is close to 0, and the p >0.05, which shows that there is no statistically significant correlation between spatial distribution type and mean RT. This observation elucidates the varying changes in RT among the three highlighting methods depicted in Figure 4, which can be attributed to distinct distribution approaches.
Linear regression analysis was conducted to examine the correlation between various conditions. The results indicated that the method of
672 Meng and Liu
highlighting (0.137) had the smallest effect, the number of target symbols highlighted (0.753) had the largest effect, and the type of target symbols highlighted (0.675) had a slightly lesser degree of influence.
The analysis of variance (ANOVA) results indicated that the p = 0.675> 0.05 for the highlighting method and RT, and there was no statistically signif- icant effect of the highlighting method on RT. No statistically significant differences were observed in the multiple comparisons conducted between the transparency display method and the texture display method, the trans- parency display method and the hue display method, and the texture display method and the hue display method. The study revealed a significant impact of the number of highlighted symbols on the RT results (F = 195.993, p<0.001). Specifically, a significant difference was observed among the meth- ods when the number of highlighted symbols was three (F = 123.859, p<0.001), six (F = 29.113, p<0.001), and nine (F = 24.743, p<0.001). The largest difference was found when the number of highlighted symbols was three. Additionally, it was determined that the transparent methods were the least efficient and the hue methods were the most efficient when there were three, six, and nine highlighted symbols. The effect of the highlighted symbols (F = 59.076, p<0.001) on the response time was found to be signifi- cant. Specifically, when the highlighted symbols were categorized into types 1 (F = 35.034, p<0.001), 2 (F = 80.034, p<0.001), 3 (F = 57.254, p<0.001), 4 (F = 11.204, p<0.001), and 5 (F = 35.034, p<0.001), significant differences were observed between the methods. At the same time, it was found that when the highlighted symbol types are 1 and 2, the transparency method has the lowest efficiency, and the hue method exhibits the highest efficiency; when the highlighted symbol types are 3 and 4, both the transparency and texture methods are significantly less efficient than the hue method; When the highlight symbol type is 5, both the hue and texture methods are significantly more efficient than the transparency method. The spatial distribution status was analyzed and found that it p = 0.542 > 0.05, which has no significant impact on RT.
The subjective questionnaire results showed that subjects selected hue (mean = 4.91) as the display method with the most prominent effect, which was the same as the objective test results. However, the results also revealed that texture (mean = 3.09) and transparency methods (mean = 3) received similar average scores. The scores pertaining to texture and transparency were highly dispersed. Two participants expressed the opinion that the tex- ture method and the hue method had the best highlighting effect, and two participants believed that the texture method and the transparency method produced the least effective highlighting effect. Although there is a greater scatter in the scores, the overall visual impact of the texture and transparency display methods are similar.
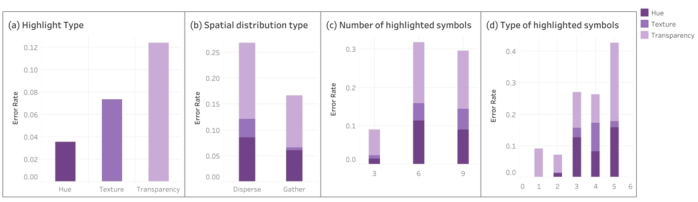
Error Rate Analysis In the dataset analyzed, a total of 92 incorrect answers were identified, result- ing in an average error rate of 7.74%. The method of highlighting involves the use of more than two groups, so the Kruskal-Wallis test statistic is used
Feasibility and Effectiveness Study of 2D Highlighting Methods Applied in 3D Modeling 673
for analysis, and the p = 0.368 >0.05. Therefore, samples employing vari- ous highlighting methods will not show significant differences in error rates. There is no statistically significant difference in the error rate across different factors.
Figure 5: Error rate.
It can be seen that the transparent display method has the highest error rate and the hue display method demonstrates the lowest error rate (see Figure 5). Additionally, when considering the spatial distribution state, the error rate is lower in the gathered state compared to the dispersed state. Furthermore, in terms of the number of symbols highlighted, it is found that when the number of highlighted symbols is six, the overall error rate is the highest, and the transparency error rate>texture error rate>color error rate; in terms of the type of highlighted symbols, there is an overall trend of an increase in the error rate from 1 to 5, with the hue error rate being the lowest.
DISCUSSION
All three highlighting methods attracted the attention of the subjects because there was no significant difference in the effect of the different highlighting methods on reaction time. At the same time, the error rates associated with the three highlighting methods were relatively small, and the mean score of all the methods on the subjective questionnaire was above 3 points. This shows that the three highlighting methods have no problem in effectively highlighting. Objective data analysis shows that there is no doubt that the hue highlighting method has the best highlighting effect, and the transparency highlighting method has the worst effect, because transparency has the high- est error rate in terms of both response time and error rate, and it has the worst efficiency among different types and numbers of highlighting sym- bols. Additionally, the subjective evaluation results confirm that transparency received the lowest score in terms of subjective evaluation.
The transparency effect is the worst, probably because the change in transparency makes the highlighted 3D target visually overlap with the sur- rounding 3D model that has not changed its transparency, making it difficult for subjects to differentiate between them, and therefore it takes more time required to identify the highlighted target and a higher error rate. The texture effect, the second of the three, does not have the difficulty of discrimination caused by visual overlap, but the texture pattern is often too complex, and
674 Meng and Liu
the human brain will be slower to process the more complex information (Zhang et al., 2021)(Tsotsos, 2011). The effect of hue was found to be the most prominent, and the greater the similarity between the target item and the distractor, the greater the complexity of the search task would increase (Tsotsos, 2011), and the hue of the salient target in the hue display approach and the hue of non-highlighted targets are far apart, so the complexity of the search task is smaller.
When highlighting targets in a visual search, it is essential to reduce the complexity of the visual target, which is closely related to search efficiency. As can be seen from the efficiency of the three different highlighting meth- ods, compared to the texture and transparency methods, the complexity of hue is the lowest, and therefore its efficiency is the highest. Therefore, the following guidelines for 3D saliency in 3D systems have been derived by combining the guidelines related to 2D saliency proposed by relevant researchers: saliency, ease of realization, and reduction of visual target com- plexity. Saliency means that the 3D highlighted target must be significantly different from the non-highlighted target, which can be clearly observed by the user; Ease of implementation means that the 3D highlighting method should be able to be implemented without serious performance problems to support smooth and dynamic user interactions; Reducing the complexity of the 3D highlighted target means, as the name implies, that the complexity of the 3D highlighted target should be small, so as to increase the efficiency of the user’s visual search.
CONCLUSION
In the digital 3D production line system, the highlighting of relevant alarm information and important information is inseparable from the 3D model. This thesis primarily investigates the feasibility and effectiveness of imple- menting the 2D highlighting method on a 3D model. Based on the analysis and discussion of the experimental results, the following conclusions can be drawn: a) It is feasible to apply the 2D highlighting method to 3D models. b) Three feasible 3D highlighting methods are proposed: hue highlight- ing, texture highlighting, and transparency highlighting. Among these methods, the hue-highlighting method is the most effective. c) Guidelines for three-dimensional saliency are proposed: saliency, ease of realization, and reduction of visual target complexity.
ACKNOWLEDGMENT
I am deeply grateful for the opportunity to present my research paper at this conference. It has been an invaluable experience that has allowed me to share my work, receive feedback, and engage with other researchers in my field. Thank you once again for your dedication to fostering intellectual growth and collaboration.
Feasibility and Effectiveness Study of 2D Highlighting Methods Applied in 3D Modeling 675
REFERENCES
Bai Yalan et al. (2021). Visual variables of We-Maps symbols and their applications, Science of Surveying and Mapping, 46(7), pp. 182–188+204. Carpendale, M. S. T. (2003) “Considering Visual Variables as a Basis for Information
Visualisation”, Technical report, University of Calgary, Calgary, AB. Chen Yufen (1995). Visual variable for Map Symbol, Journal of the People’s Liberation Army Institute of Surveying and Mapping, (2), pp. 145–148. Dukaczewski, D. (2014) “Designing Simple and Complex Animated Maps for Users
from Different Age Groups, Employing the Appropriate Selection of Static and Dynamic Visual and Sound Variables”, in: Thematic Cartography for the Society, T. Bandrova, M. Konecny, and S. Zlatanova (eds). pp. 47–60. Guo liang and Zhang Yu (2020). Review on Application Progress of Digital Twin in Manufacturing, Mechanical Science and Technology for Aerospace Engineering, 39(4), pp. 590–598. Itti, L. and Koch, C. (2000). A saliency-based search mechanism for overt and covert
shifts of visual attention, Vision Research, 40(10), pp. 1489–1506. Ling Shanjin, Wang Xiaoling and Ding Yuanyuan (2017). Classification and Function of the Visual Variables of Static Map Symbol, Journal of Anhui Normal University (Natural Science), 40(1), pp. 69–76. Robinson, A. C. (2011). Highlighting in Geovisualization, Cartography and Geo-
graphic Information Science, 38(4), pp. 373–383. Shojaei, D. et al. (2013). Visualization requirements for 3D cadastral systems, Computers, Environment and Urban Systems, 41, pp. 39–54. Stefan, S. et al. (2020). Visualization of 3D Property Data and Assessment of the
Impact of Rendering Attributes, Journal of Geovisualization and Spatial Analysis, 4(2), p. 23. Tsotsos, John, ed. (2011). A Computational Perspective on Visual Attention.
Cambridge: MIT Press Scholarship Online. Wolfe, J. M. and Horowitz, T. S. (2004). What attributes guide the deployment of visual attention and how do they do it? Nature Reviews Neuroscience, 5(6), pp. 495–501. Xu Zhiyong et al. (2006). On Visual Variables of 3D Map Symbol, Geomatics and
Information Science of Wuhan University, (6), pp. 557–560. Zhang, L. et al. (2021) “Human-Computer Interface Design of Intelligent Spinning Factory Monitoring System Based on Eye Tracking Technology”, in: Advances in Usability, User Experience, Wearable and Assistive Technology, T. Z. Ahram and C. S. Falcão (eds)., pp. 579–586.
LISTED IN THE AHFE DIGITAL BOOKSTORE CATALOGUE
Explore the complete digital volume
Intelligent Human Systems Integration (IHSI 2024): Integrating People and Intelligent Systems
Read this individual research paper free through the original publisher, or explore the full digital proceedings book.
ISBN 978-1-958651-95-7
Explore this ISBN in the AHFE Bookstore ↗Listed in the July 2026 bookstore catalogue; search by ISBN to confirm current availability · Digital book purchase optional