Isabel Varajão, Rosane Sampaio, Iara Margolis, Emanuel Sousa, Sérgio Monteiro, Luis Louro, Nuno Ribeiro, Rafael Pedro, Estela Bicho (2024). User-Centric Design of Forklift Operation: A Task Analysis via User Journey Mapping. In: Human Factors in Design, Engineering, and Computing. AHFE Open Access, vol. 159, pp. 2319–2329. https://doi.org/10.54941/ahfe1005800
Loading pallets in truck bays presents significant human factors challenges, including physical ergonomics, workplace safety, task efficiency, and operator well-being. Forklift operation, in particular, demands both physical and cognitive effort and carries a risk of injury. Work injuries have significant social and economic impacts, both for the injured individuals and for the company. Therefore, analyzing ways to reduce these risks, streamline processes, and enhance efficiency is crucial for both human and organizational well-being. This study focused on analyzing the current operational flow of pallet loading in an industrial facility where this process is integral to production. Using a user journey map, which combined storytelling and material visualization, issues were identified from a human factors perspective issues from the perspective of human factors. The study followed the early stages of the Design Thinking Methodology, particularly in need identification and problem definition. In the initial phase, a multidisciplinary human factors team visited the workstation, employing observation, semi-structured interviews, and on-site recordings. This data was validated through consultations with operators. In the second phase, the user journey was outlined, highlighting six dimensions: user actions, interfaces, goals, experiences, emotions, pain points, and opportunities. After that the user journey map was validated with an industrial team.Through an empathic analysis based on user-centered design, the journey map revealed critical issues such as visibility frustrations and maneuverability challenges. By deeply understanding the operators' experiences, the study provided practical insights and recommendations for improving safety, efficiency, and overall operator well-being.
Forklift operation is one of the most frequent tasks taking place in industrial environments, most notably in those where materials handling or transportation of heavy goods is required. Nevertheless, it is physically and cognitively demanding. Forklift operators frequently report musculoskeletal discomfort symptoms such as pain in the back, neck and shoulders (Solman, 2022; Flodin et al., 2018) as well as mental impact related to stress, high workload (Ludwig and Goomas, 2009) and time pressure (Solman, 2022). Additionally, forklift operation involves substantial risk of accidents, with drivers being particularly exposed (Ulutas and Ozkan, 2019).
One frequently suggested solution to decrease risk exposure when dealing with heavy machinery is teleoperation (Kim et al., 2024). In this approach, drivers would be entirely removed from the forklift operation environment, working safely from a desk-like control station. While the concept of tele-operating industrial machinery has existed for some time, recent advances in enabling technologies like 5G networks have renewed interest. However, significant challenges remain in developing effective human- machine interfaces for remote operators. Issues such as the “straw effect,” communication latency, and others must be carefully considered in the design of these systems (Tener et al., 2022).
In the context of the PRODUTECH R3 (WP9 – SmartIL: Intelligent interoperable robotic intralogistics and quality control platform and solutions for industry), one of the challenges involves integrating a remotely operated robotic forklift into the flow of pallet picking and loading operations. To develop a new, more streamlined experience where human interaction remains central, the user journey map was selected as a strategic tool.
User Journey Mapping (UJM) is a popular technique used to map in a visual way the experiences of individuals when dealing with a service or system (Sirola et al., 2024). Its main aim is to help organizations develop products and services that align with real user needs, fostering more intuitive and empathetic experiences. Fakher (2024) emphasizes that the journey helps identify key elements, uncover challenges, and create a roadmap for innovation and solutions within a company, making it a strategic tool for innovation.
UJM has been used as a tool for many things, like consumer behavior (Alvarez et al., 2020; Bascur et al., 2019; Sirola et al., 2024), and in industrial problem- solving (Fakher, 2024).
This article details the development of a strategic UJM to understand the workflow, identifying opportunities, and diagnosing pain points in the pallet picking and truck loading processes. It illustrates how UJMs can be a useful tool within a user-centred design framework, facilitating an in-depth examination of task flows in repetitive industrial operations. Ultimately, this approach will guide developers in designing interactions to facilitate the transition from co-located to remote teleoperation of industrial mobile equipment.
User-Centric Design of Forklift Operation: A Task Analysis via User Journey Mapping 2321
USER JOURNEY MAPPING AS A TOOL UJM is a creative tool typically applied in workshops moderated by UX specialists, designed to quickly understand user processes and identify necessary activities even before research begins (Endmann and Keßner 2016). Bascur et al. (2019) used it from a consumer perspective, addressing the customer experience (CX), while Alvarez et al. (2020) applied it to customer journey maps (CJM). Fakher (2024) utilised UJM in industrial logistics for innovation, outlining a roadmap for development.
One interesting aspect of the tool is its foundation. Endmann and Keßner (2016) based their method on Story Mapping from agile development, focusing on understanding user processes to identify areas for further research. Monkam Ngatcheu (2021) also adopted it within agile requirements, while Alvarez et al. (2020) employed psychophysiological measurements such as EEG and electrodermal sensors to gain insights into the journey.
The construction of dimensions and analyses depends on the specific needs of each case. Endmann and Keßner (2016) state that the construction process is based on defined stages, and at the end of the process, user issues are identified, leading to the determination of the next dimensions in research or the development of design concepts. Their method consists of nine stages, beginning with the identification of personas and ending with the definition of the next dimensions: (1) Specifying Personas, (2) Preparing the UJM, (3) Writing Down the Process’s Associated Activities, (4) Organizing Activities, (5) Identifying and Naming Tasks, (6) Complementing Activities and Tasks, (7) Assigning Pains and Gains, (8) Adding Existing Documents, and (9) Identifying Next Steps.
The stages outlined by Bascur et al. (2019), while sharing the same core principles, differ in execution. These authors focus on identifying the journey’s life cycle, the touchpoints in consumer interactions with the company, and the experiences with an emphasis on the predominant emotions at each stage. Tincher (2013) divided the journey map into five phases: (1) Goal, (2) Patient Emotional Response, (3) Touchpoints, (4) Information Sought, and (5) Level of Effort.
Sirola et al. (2024) applied the Customer Journey Map (CJM) to the nail industry in six phases: (1) Stage/Activities, (2) Thoughts and Feelings, (3) User Pains, (4) Objectives, (5) Situation, and (6) Touchpoints, using a 5-point Likert scale to evaluate the situation.
Fakher (2024) applied a six dimensions process in the industrial sector: (1) Goals, Expectations, and Needs, (2) Actions, Activities, and Processes, (3) Emotions, Thoughts, Feelings, Experience, Feedback, (4) Touchpoints and Channels, (5) Pain Points, and (6) Opportunities, Ideas, and Solutions.
These various approaches demonstrate that the UJM can be adapted according to specific needs but is always centered on identifying user pain points throughout a process.
METHODOLOGY
UJM was designed following a structured approach, inspired by Giroux- Huppé et al. (2019), who highlight the importance of identifying psychological pain points in the user journey—specific moments of intense negative emotions that differ markedly from the baseline. These can be either explicitly reported by users or identified through psychophysiological measurements, which offer more objective precision. Dirican and Göktürk (2011) further emphasize that identifying these pain points is essential to improving usability, user satisfaction, and interaction quality.
The map was divided into six key dimensions, each defined through a careful analysis of the collected data and tailored to meet the study’s objectives. These dimensions included: (1) User Action: Describes the actions performed by operators at each stage of the process within the truck bay. The goal was to document each activity in a logical sequence, pinpointing where each action occurs in the overall process; (2) Interfaces (or contact points between user and environment): Describes the interfaces or devices used in each task. Based on observations of the operators’ work, this dimension defines how the operator interacts with the system (inputs) and how they receive feedback from their actions. This additional layer was included to clarify the resources used by operators to obtain information and provide system input (action); (3) Goals and Experiences: Describes the objective behind the operator’s actions. For each stage of the process, based on the material collected from operators, specific goals were defined to be achieved through their actions; (4) Feelings and Thoughts: Investigates the emotional states of operators at each stage of the process, capturing the emotions that might impact or enhance execution. Operators’ emotions were classified using an iconographic Likert scale (1-5), to provide a visual and quantifiable sense of their feelings; (5) Pain Points: Describes the obstacles and difficulties encountered by operators, including who is affected and the severity of these obstacles in each task. A Likert scale (1-5) was also used to classify both the severity and risk posed by each obstacle; and (6) Opportunities: This final dimension outlines improvement opportunities and solutions for the identified obstacles.
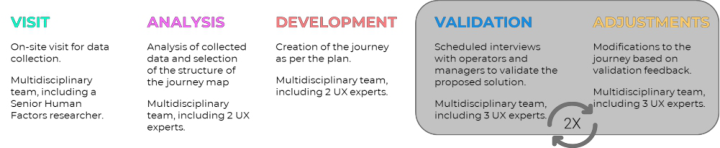
The UJM process began with a site visit by a multidisciplinary human factors team, who employed observation, semi-structured interviews, and on-site recordings at the operators’ workstations. The team then analyzed the collected data and conducted a simultaneous review of best practices for UJM to identify steps that best suited the operational context. Using this foundation, the map was developed to reflect the specific flow of pallet picking and loading. Six key dimensions were documented in the map—user actions, interfaces, goals and experiences, feelings and thoughts, pain points, and opportunities. Once the initial map was constructed, we held a validation session with industry stakeholders to review and refine the findings. The feedback led to several adjustments, and the revised journey map was then validated in a second meeting. Figure 1 illustrates the workflow followed in this methodology.
User-Centric Design of Forklift Operation: A Task Analysis via User Journey Mapping 2323
Figure 1: Methodology used.
In the first stage, a multidisciplinary human factors team visited the operator’s workstation, employing observation techniques, semi-structured interviews, and on-site recordings. After that, the collected data were analyzed, and simultaneously, a review of UJMs best practices was conducted to determine the steps of the tool that best fit the challenge. The journey was then mapped out following the flow of pallet picking and loading operations, considering and documenting six aspects: user actions, interfaces, goals & experiences, feelings and thoughts, pain points, and opportunities. Once the map was created, a validation session with the industry was scheduled to present the material and validate the journey. Several points were analyzed and the identified discrepancies were revised and incorporated into the journey map, which was then re-presented in a second meeting for final validation and refinement. This workflow is depicted in Figure 1.
Work Environment The work environment belongs to a large company that operates 24 hours a day, seven days a week. The sector analyzed was the trailer loading area, where eight forklifts operate simultaneously, loading approximately 3,000 tons of cargo daily. The work follows a seasonal cycle, with higher intensity at the end of the month or during holiday periods, such as the end of the year.
RESULTS
Development of the UJM To achieve the final UJM, the process underwent three iterations. The first version (see Figure 2-A) was developed prior to the initial validation.
In this version, six major dimensions in the loading process were identified: work order consultation, picking pallet, driving to the truck, loading, and confirming the task. Several areas of uncertainty were marked in red. This flow highlighted 10 feelings and thoughts, 9 pain points, and 9 opportunities. The second version was created after the initial validation session with the local team, during which several critical revisions were raised. Key issues included the simplification of the loading process and corrections of misperceptions, such as realizing that order consultation was done on paper rather than digitally. Additionally, more user feelings and thoughts needed to be incorporated into the journey. This validation session lasted over two hours. Following the session, the multidisciplinary team revised the material, leading to the development of a second version for further evaluation (Figure 2-B). In this version, 17 feelings and thoughts, 17 pain
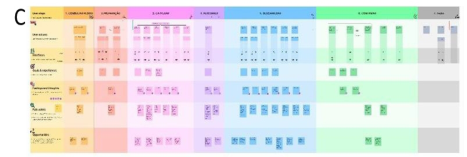
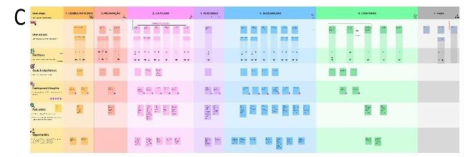
points, and 17 opportunities were identified, alongside a more streamlined flow, particularly in the loading phase. The final version was developed after validating the second iteration. The process expanded from five to seven stages, now including: acquiring the work order, preparation, pallet picking, driving to truck bay, placing the pallet, validating task completion, and closing the work order. A final validation session followed, with a deeper analysis of feelings, pain points, and opportunities. Each aspect was scaled for impact, leading to the refinement of the journey. In the final User Journey Map (Figure 2-C), 18 feelings and thoughts, 18 pain points, and 18 opportunities were mapped out. Visually (Figure 2), the evolution of the journey is clear, with simplifications (e.g., the gray areas in Figure 2-A was reduced to the pink area in Figure 2-B and 2-C) while other processes were further refined (salmon and gray in Figure 2-C), demonstrating the progression in both the refinement of the workflow and the depth of analysis.
Figure 2: Evolution of the User Journey Map, with the local team validation.
UJM in 6 Dimensions In analyzing the UJM, for each stage of the process, one color was defined, as shown in Figure 3.
Figure 3: Colors used in each stage of the process.
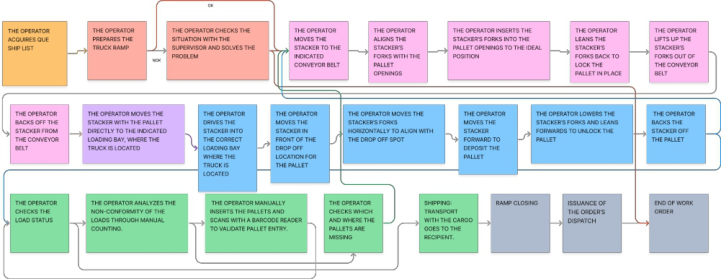
The first dimension, “User Action,” provided a detailed flow of the forklift operator’s activities. The journey begins with the operator physically going to
User-Centric Design of Forklift Operation: A Task Analysis via User Journey Mapping 2325
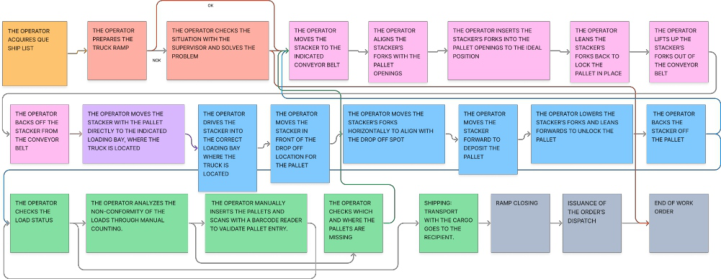
the dispatch room to retrieve a paper with their task. They then approach the forklift to begin the loading process (pick the pallet, drive, and load on the truck). Once this is completed, the operator validates that the order is correct and closes the task (see Figure 4). The actions were mapped to understand the logical sequence of each one and at what point in the process they occur. Some actions were further broken down for a more detailed understanding.
Figure 4: User Action.
After determining the actions, the interfaces (dimension 2) or devices used in each action (input and output) were described. Iconographic symbols were implemented to represent each type of interaction and where it takes place (see Figure 5). These symbols were chosen based on the multidisciplinary team’s assessment of what would best represent the interfaces.
Figure 5: Symbols.
In the third dimension, “Goals and Experiences,” concrete objectives were defined to be achieved through the actions performed (see Figure 6). Importantly, restrictions (what the operator must avoid) were also identified.
Figure 6: Goals and experience.
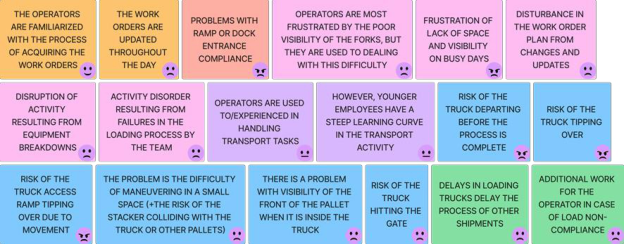
For the fourth dimension, “Feelings and Thoughts,” the operators’ feedback was analyzed, translating their feelings and thoughts into a rating system validated using a pictographic 5-point Likert scale (see Figure 7). This dimension provided an empathetic insight into the key issues affecting both the team and management, such as changes in work plans and visibility challenges (like the visibility of forklift forks, spaces during busy days) which had a score of 4, and concerns regarding accidents and incidents, which were scored at 5.
Figure 7: Feelings and Thoughts.
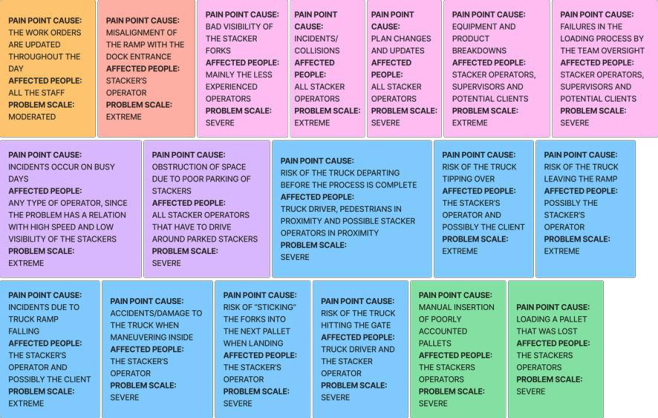
In the penultimate dimension, “Pain Points” were analyzed, including the severity of each obstacle. The goal was to clearly and objectively identify the obstacles faced by operators during the operation and who is directly affected. The most commonly observed severity levels were “severe” and “extreme,” indicating obstacles that impact a broad range of people (from the operator to the customer) and present critical pain points, potentially posing physical risks to those involved (see Figure 8). By translating these thoughts into pain points, it became possible to offer insights and guidance for reshaping the journey under remote operation. The focus was placed on key areas, particularly the frequent changes of work plans (a frequent reality in this routine), visibility during operation (the pallet occludes the operator’s view increasing the risk of collisions), and the occurrence of incidents/accidents.
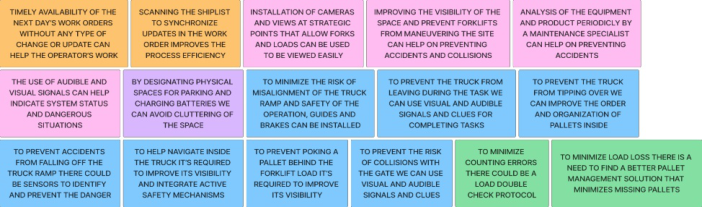
Finally, opportunities (dimension 5) were considered for the listed problems. Based on the identified obstacles, a series of improvement opportunities and solutions were proposed for each described context (see Figure 9).
Figure 8: Pain points.
User-Centric Design of Forklift Operation: A Task Analysis via User Journey Mapping 2327
Implementing these opportunities through collaborative robotics can greatly enhance operational efficiency, safety, and spatial organization. Providing timely, unaltered work orders and synchronizing updates via automated scans streamline workflows, while strategically placed cameras and sensors improve visibility and prevent collisions. Collaborative robots equipped with visual and audible signals can assist in guiding tasks, reducing risks of pallet misalignment and load tipping. Designating spaces for charging and using advanced pallet management solutions will also reduce clutter and minimize counting errors, fostering a safer, more efficient work environment.
Figure 9: Opportunities.
Lessons Learned The presented analysis of the UJM in 6 dimensions offers a comprehensive understanding of the forklift operator’s workflow, identifying key pain points, potential areas for improvement, and opportunities to optimize the loading process. The analysis of the six dimension in the UJM highlights key insights into optimizing the workflow and improving the operator’s experience, namely: User Actions: Mapping user actions provides a clear understanding of the task flow, emphasizing the opportunities to streamline steps such as replacing manual paper instructions with digital tools to enhance efficiency and decrease the risk of errors; Interfaces: The study of system interactions was useful to determine necessary components of the tele-operation interface and understand needs regarding cameras and other sensors for assisting the maneuvering (Kim et al., 2024); Goals and Experiences: Understanding at each step of the task what the driver is trying to achieve and (quite importantly) what he is trying to avoid is extremely relevant for the design of the tele-operation workflow and to ensure that the system and the interface respond to right needs; Feelings and Thoughts: Operators experience significant stress at various stages, revealing emotional pain points that can impact productivity and safety. Identifying the most relevant issues and addressing them through simplification and automation can significantly reduce stress and errors stress (Rasheed et al., 2024); Pain Points: Identifying pain points of the current task underlines the need for immediate workflow improvements to enhance safety, efficiency, and overall satisfaction (Giroux-Huppé et al., 2019), offering insights and guidance for reshaping the journey under tele-operation; Opportunities: The study highlights opportunities for innovating the picking and loading processes
though tele-operation, beyond the simple replication of the current process. Opportunities for digitizing administrative tasks and automating repetitive actions were also identified, paving the way for process improvements that boost both efficiency and employee well-being.
CONCLUSION
The analysis of the User Journey Map underlines the potential impact of user- centered design on improving the truck loading process. By mapping the operator’s actions in detail, the study provides a structured approach to understanding their workflow, identifying pain points, and offering potential solutions in an emphatical way. This method reveals critical issues which not only affect operator efficiency but also pose safety concerns and important causes of emotional stress. The identification of these pain points, alongside opportunities for improvement, illustrates the importance of aligning technological advancements, such as collaborative robotics, with human-centered design principles. This approach ensures that innovations are tailored to the needs and experiences of the operators, fostering a more intuitive, efficient, and safer work environment. Ultimately, the UJM becomes a strategic tool for both innovation and user satisfaction, driving operational improvements while maintaining empathy for the user’s experience.
ACKNOWLEDGMENT
This work has been supported by the European Union under the Next Generation EU, through a grant of the Portuguese Republic’s Recovery and Resilience Plan (RRP) Partnership Agreement, within the scope of the project PRODUTECH R3 – “Agenda Mobilizadora da Fileira das Tecnologias de Produção para a Reindustrialização”, Total project investment: 166.988.013,71 Euros; Total Grant: 97.111.730,27 Euros.
REFERENCES
Alvarez, J., Léger, P. M., Fredette, M., Chen, S. L., Maunier, B., & Senecal, S.
(2020). An enriched customer journey map: How to construct and visualize a global portrait of both lived and perceived users’ experiences? Designs, 4(3), 29. Bascur, C., Rusu, C., & Quiñones, D. (2019). User as customer: Touchpoints and journey map. In Human Systems Engineering and Design: Proceedings of the 1st International Conference on Human Systems Engineering and Design (IHSED2018):
Future Trends and Applications, October 25-27, 2018, CHU-Université de Reims Champagne-Ardenne, France 1 (pp.117–122). Springer International Publishing. Dam, R. F. (2024). 5 stages in the design thinking process. Interaction Design Foundation. Retrieved from https://www.interactiondesign.org/literature/ article/5- stages-in-the-design-thinking-process Dirican, A. C., & Göktürk, M. (2011). Psychophysiological measures of human cognitive states applied in human-computer interaction. Procedia Computer Science, 3, 1361–1367. Endmann, A., & Keßner, D. (2016). User journey mapping–A method in user
experience design. i-com, 15(1), 105–110.
User-Centric Design of Forklift Operation: A Task Analysis via User Journey Mapping 2329
Fakher, M. (2024). Empowering parcel delivery logistics: The role of customer journey mapping in driving innovation and customer-centric solutions. Flodin, U., Rolander, B., Löfgren, H., Krapi, B., Nyqvist, F., & Wåhlin, C. (2018).
Risk factors for neck pain among forklift truck operators: A retrospective cohort study. BMC Musculoskeletal Disorders, 19(1), 44. Giroux-Huppé, C., Sénécal, S., Fredette, M., Chen, S. L., Demolin, B., & Léger, P. M.
(2019). Identifying psychophysiological pain points in the online user journey: The case of online grocery. In Marcus, A., & Wang, W. (Eds.), Design, user experience, and usability. Practice and case studies. HCII 2019. Lecture Notes in Computer Science, vol 11586. Springer, Cham. https://doi.org/10.1007/978-3-030-23535- 2_34 Kaplan, K. (2024). When and how to create customer journey maps. Customer Journey Maps: When and How to Create Them. Nielsen Norman Group. Retrieved June 4, 2024, from https://www.nngroup.com/articles/customer- journey-maps/. Kim, S., Hernandez, I., Nussbaum, M. A., & Lim, S. (2024). Teleoperator-
robot- human interaction in manufacturing: Perspectives from industry, robot manufacturers, and researchers. IISE Transactions on Occupational Ergonomics and Human Factors, 12(1–2), 28–40. Larsson, T. J., & Rechnitzer, G. (1994). Forklift trucks analysis of severe and fatal occupational injuries, critical incidents, and priorities for prevention. Safety Science, 17, 275–289. Ludwig, T. D., & Goomas, D. T. (2009). Real-time performance monitoring, goal-
setting, and feedback for forklift drivers in a distribution centre. Journal of Occupational and Organizational Psychology, 82(2), 391–403. Monkam Ngatcheu, M. (2021). Agile requirements engineering with prototyping in small software projects: An action research case. Rasheed, U., Cai, J., Xu, X., Hu, Y., & Li, S. (2024, March). Equipment teleoperation
and its impacts on future worker and workforce in construction: Semi-structured interviews. In Construction Research Congress 2024 (pp. 846–855). Širola, D., Strahinja, R., & Arbanas, M. (2024). Mapping the customer experience: Unveiling the customer journey in the nail industry. CroDiM: International Journal of Marketing Science, 7(1), 77–88. Solman, K. N. (2002). Analysis of interaction quality in human–machine systems:
Applications for forklifts. Applied Ergonomics, 33(2), 155–166. Tener, F., & Lanir, J. (2022). Driving from a distance: Challenges and guidelines for autonomous vehicle teleoperation interfaces. In CHI Conference on Human Factors in Computing Systems (pp. 1–13). New Orleans, LA, USA: ACM. Tincher, J. (2013). Creating a customer-focused customer experience journey map.
Heart of the Customer. Ulutas, B., & Ozkan, N. F. (2019). Assessing occupational risk factors for forklift drivers. Le Travail Humain, 82(2), 129–149.
LISTED IN THE AHFE DIGITAL BOOKSTORE CATALOGUE
Explore the complete digital volume
Human Factors in Design, Engineering, and Computing
Read this individual research paper free through the original publisher, or explore the full digital proceedings book.
ISBN 978-1-964867-35-9
Explore this ISBN in the AHFE Bookstore ↗Listed in the July 2026 bookstore catalogue; search by ISBN to confirm current availability · Digital book purchase optional