Jeewon Han (2024). Usability Factors and Guidelines for Climate Control Interfaces Using Big Data from Vehicles. In: Human Factors in Design, Engineering, and Computing. AHFE Open Access, vol. 159, pp. 2214–2220. https://doi.org/10.54941/ahfe1005789
Understanding user behavior accurately and designing interactions based on this understanding is essential for providing an enhanced user experience. This study focuses on vehicle climate control systems, aiming to quantitatively analyze user operation frequency through real-time data collected from the vehicles. By examining this behavior, the research seeks to provide actionable insights to optimize interaction design and improve the in-vehicle user experience.VCRM (Vehicle Customer Relationship Management) data was collected from approximately 70,000 vehicles whose drivers subscribed to and consented to connected services. This data is derived from the vehicles’ CAN signals and diagnostic communications, including real user information across various driving environments. The data, linked to details such as driving time, date, and weather conditions, allows for an analysis of macro-level usage patterns over time. For instance, while driving distance did not significantly influence operation patterns, interactions with the climate control system became simpler when driving speeds exceeded 30 km/h. This suggests that drivers tend to rely more on automatic controls at higher speeds, reducing the need for manual adjustments.Based on these insights, this study proposes several guidelines for optimizing climate control system layouts. Frequently used functions should be placed in easily accessible locations, while less commonly used or automated functions can be positioned farther away. This strategy aims to reduce cognitive load while driving and enhance driver safety. Furthermore, the study highlights the importance of customizable interfaces that adapt to different driving conditions and user preferences, allowing for a more personalized experience.In addition to proposing these guidelines, this study developed a concept for integrating them into an IVI (In-Vehicle Infotainment) system. This optimized layout was tested through user experiments, which demonstrated improvements in task completion times and reduced driver distraction. Eye-tracking data particularly revealed that drivers spent less time focusing on the system, thereby lowering cognitive load during operation.By utilizing real driving data instead of traditional surveys or lab-based experiments, this study presents a novel approach to accurately analyze user behavior. This data-driven methodology facilitates the design of more intuitive and user-centered vehicle interfaces, simultaneously improving both safety and user satisfaction. This study underscores the importance of data-driven UX design and offers valuable insights for the future direction of automotive interface design.
In recent vehicle development stages, reducing and integrating buttons has been a key issue to optimize the layout for better design elements and the utilization of the front-row space. Various usability factors have been reviewed to determine whether such reductions and integrations are feasible. These factors include the urgency of the function, frequency of use, the potential for alternative controls. Among these, the frequency of use is an important usability factor, revealing how often and how dependent users are on each function. Our usability principles focus on balancing urgency and frequency of use during driving, emphasizing that controls and information should be easily visible and accessible based on their importance. In this study, we specifically focused on climate control systems, using VCRM vehicle data collected in real-time from the field to quantify actual user control frequencies. VCRM vehicle signal data is collected in the car cloud from certain CAN signals and diagnostic communication data applied in Hyundai Bluelink and Kia Connect vehicles, providing information about the user’s driving behavior. Through user data, this study aims to quantitatively identify users’ needs for essential control functions. It also seeks to develop guidelines for optimizing climate control systems by analyzing operational patterns based on driving characteristics. Additionally, the study provides directions for enhancing control logic to minimize manual operation and suggests grouping functions for better usability.
Usability Factors and Guidelines for Climate Control Interfaces 2215
VEHICLE BIG DATA ANALYSIS PROCESS Analysis Method
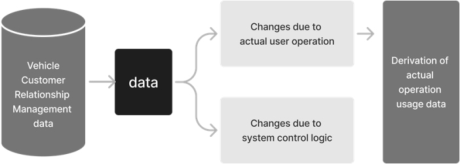
Data provided by VCRM are time series status signals, and most climate control system are also collected as operating status signals. By detecting changes in status signals from the collected database as shown below, the user’s control can be inferred.
Figure 1: Schematic diagram of deriving real usability using VCRM data.
In order to increase the consistency of inferring the user’s control behavior, accurate classification is necessary, and the following method was used for this.
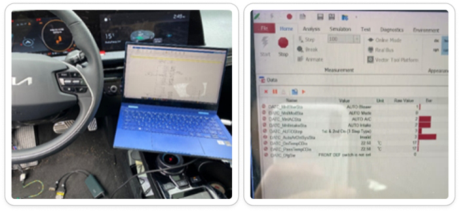
Using CANoe equipment, the signal values collected by VCRM were checked in real time when the actual climate control system was operated by connecting to the vehicle, and the signal behavior that can determine the operation was derived.
Figure 2: Climate control system signal confirmation using CANoe equipment.
Climate control system specification analysis, signal behaviors that operate by control logic were classified and excluded. 1), 2) were used to extract the behavior of signals that can derive actual control behavior and several criteria necessary for analysis were established. Examples include the definition of misoperation, the control time criteria considering the characteristics of the control system by function, and the definition of valid driving. A common analysis guideline was established. Afterwards, data analysis was conducted and visualized.
2216 Han
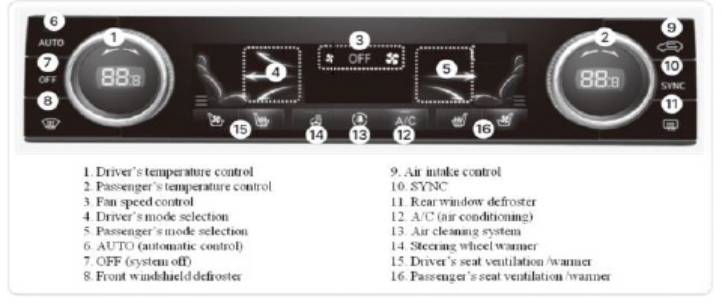
Analysis Subjects and Conditions Considering the climate control system layout and data collection conditions that can be operated 0-depth control among vehicles, the GV80 model was selected and analyzed. The detailed analysis control system and outline are as follows.
Figure 3: GV80 climate control system layout.
Among the above functions, (11) rear window defroster, (13) air cleaning system were excluded from the analysis due to the difficulty in collecting signals. When analyzing the results, The operation data from the driver and passenger control were combined for analysis. The detailed analysis outline is as follows.
Table 1. Data analysis outline.
Table available in the original PDF paper.
Contents Data Target date 32 days Total number of vehicles in operation 69,895 vehicles Total number of trips 6,408,660 driving cycle
Since the data collected by VCRM is data from all trips with the engine turned on and off, preprocessing was performed on the entire trip under the conditions of xDriving time lasting for more than 300 seconds and y maximum speed exceeding 10 kph to reflect the conditions where user’s climate control operation can occur. In addition, in order to distinguish data that had the intention of control, control operation was defined only when the signal remained the same for more than 3 seconds after control, and for functions that require multi-step continuous control such as temperature and wind speed, control within 5 seconds was considered as one control frequency regardless of increase or decrease. (For example, if the temperature was manipulated from 18 degrees →25 degrees →23 degrees within 5 seconds using a knob, it was considered as one control).
Usability Factors and Guidelines for Climate Control Interfaces 2217
Analysis Results Overall Control Frequency The order of the main functions of climate control system is as follows: Fan speed, temperature, mode, AUTO, internal/external intake air, and DEF.
Table 2. Relative operation frequency of climate control functions.
Table available in the original PDF paper.
Climate Control Functions Relative Operation Frequency Fan speed control 50.7% Temperature control 28.3% Mode 5.4% SYNC 5.3% Steering wheel warmer 4.4% seat ventilation /warmer 2.1% AUTO 1.6% Intake 1.4% A/C 0.5% DEF 0.3%
Control Frequency by Weather
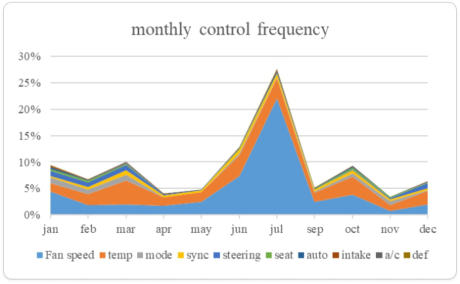
Figure 4: Monthly control frequency (*august was excluded).
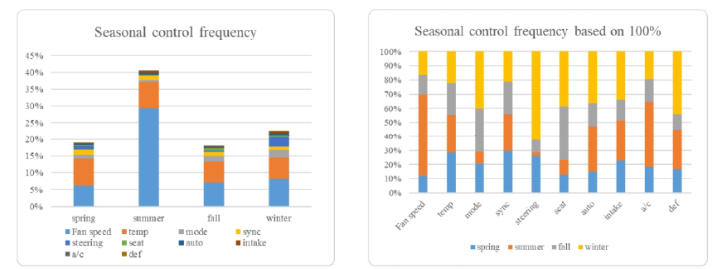
In the case of seasons, the analysis date was distributed equally by season, and the average temperature/cold day/hot day/rainy weather of each season was considered for selection and analysis as representative annual data. The monthly control frequency is as follows, and the overall number of operations was in the order of summer > winter > spring = fall.
Considering the difference in absolute control frequency, if we look at the function usage pattern based on 100% for each season as shown in Fig. 5 below, the use of fan speed is particularly prominent in summer, and the use of steering wheel heating is particularly prominent in winter, and spring and fall show similar function usage patterns.
2218 Han
Figure 5: Seasonal control frequency and Seasonal control frequency based on 100%.
Considering the differences in absolute control frequency by function, if we normalize seasonal operation frequency to 100%, the functions least affected by season are temperature and SYNC, while those most affected by season are Fan speed, steering wheel heating, A/C, and DEF.
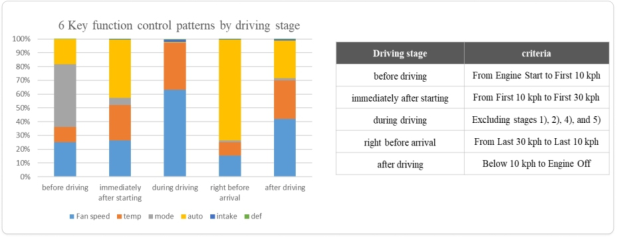
Control Frequency by Driving Characteristics Given that a significant portion of the actual driving data corresponds to “During driving,” the standard operating frequency (normalized to 100%) is classified by driving stage as follows.
Figure 6: Function operating pattern by driving stage.
The most noticeable aspect of the control pattern during the driving stage is that various functions are utilized before driving and immediately after starting the vehicle. However, at speeds of 30 kph or higher, the primary functions used are temperature and Fan speed, which account for 97% of usage. There is no significant difference in the patterns based on driving distance or driving time. Therefore, it can be concluded that the driving characteristic with the greatest influence on the user is the transition to a driving stage at a speed of 30 kph or higher, during which user control becomes significantly simpler
Usability Factors and Guidelines for Climate Control Interfaces 2219
USER SCENARIO AND USABILITY GUIDE Based on the above results, the following guides were derived and user scenarios were derived.
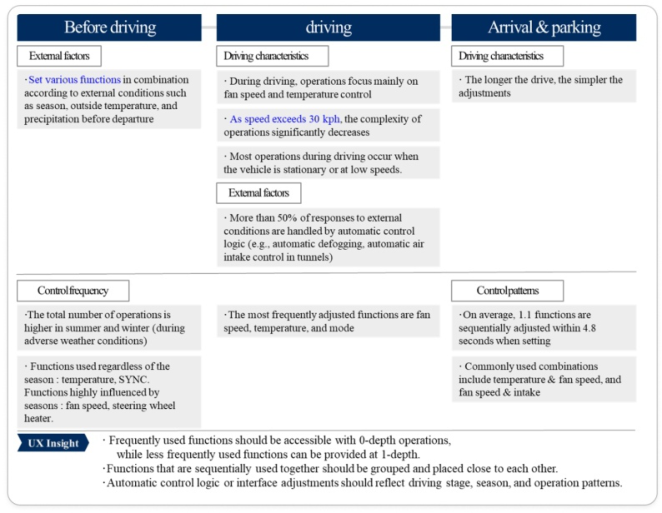
Figure 7: Data driven user scenario for climate control system.
1) Functions with a high usage frequency in the climate control system are positioned at the forefront for easy access. These frequently used functions are positioned on the left side, which is closer to the driver.
2) Functions with low operation frequency that can benefit significantly from automatic control should be developed to enhance the control logic, allowing for a lower arrangement priority. These functions can be positioned on the right side, which requires a relatively longer operation distance.
3) Considering that the control pattern varies depending on the driving stage or situation, when providing a customizable operation system in the future, detailed customization by driving stage and situation should also be included and referenced in the development of the control logic.
CONCLUSION
Usability Analysis of Climate Control Systems Using Real Driving Data In the past, methods such as surveys, observational studies, and evaluation experiments were employed to analyze the frequency and patterns of climate control system usage. However, these methods had limitations in accurately reflecting the characteristics of the climate control system. This
2220 Han
study addresses the shortcomings of previous methods by using real driving data, overcoming the constraints of limited driving scenarios and time. Representative analysis dates were selected to minimize seasonal impacts, which are crucial for climate control systems. Additionally, by considering various driving context factors, the study identified correlations among multiple elements affecting control frequency.
The Importance of Data-Driven UX Index from the SDV Perspective A good climate control system should provide automatic control that minimizes user intervention while offering easy-to-operate controls when users wish to engage. This study identified the actual needs of users across various conditions, confirming their usage patterns. From an SDV (Software Defined Vehicle) perspective, this data is essential for understanding the interaction between software (functions) and hardware (controls). This data- driven UX index is expected to serve as critical evidence in future decisions regarding digital cockpit layouts and vehicle interface designs. The real- time, data-driven approach will be instrumental in developing intuitive and user-centered systems for future vehicle interfaces.
ACKNOWLEDGMENT
This study was supported by Hyundai motor company.
REFERENCE A. Degani, A. Gellatly and M. Heymann, (2011). HMI aspects of automotive climate control systems. 2011 IEEE International Conference on Systems, Man, and Cybernetics, Anchorage, AK, 2011, pp. 1795–1796.
LISTED IN THE AHFE DIGITAL BOOKSTORE CATALOGUE
Explore the complete digital volume
Human Factors in Design, Engineering, and Computing
Read this individual research paper free through the original publisher, or explore the full digital proceedings book.
ISBN 978-1-964867-35-9
Explore this ISBN in the AHFE Bookstore ↗Listed in the July 2026 bookstore catalogue; search by ISBN to confirm current availability · Digital book purchase optional