Gaurab Baral, Junxiu Zhou (2024). A hybrid Regression method for Predicting Housing Prices. In: Human Factors in Design, Engineering, and Computing. AHFE Open Access, vol. 159, pp. 1576–1584. https://doi.org/10.54941/ahfe1005725
Accurate house price prediction is crucial for accommodating the diverse needs of stakeholders in the home-buying process. House prices can be affected by various factors, such as location, construction date, exterior, etc. This work proposes a hybrid regression method that leverages the strengths of different regression techniques to improve prediction accuracy. Specifically, this work looks at conventional linear regression and other machine learning techniques such as support vector regression (SVR), and XGBoost regression. Then we compare these models with our proposed hybrid regression model that leverages ridge regression and lasso regression to capture hidden relationships between house properties and sale prices to reveal the different predictive power of these models. In addition, this work also highlights feature engineering to address potential issues in the data and improve prediction performance. The dataset used in this study is obtained from the Kaggle Competition “House Prices: Advanced Regression Techniques.” Different model results are submitted to Kaggle, and the scores are illustrated in the paper.
Regression is a statistical tool used for predicting diverse outcomes (Sarstedt & Mooi, 2014). In our context, we apply regression to predict the sale prices of various houses in Ames, Iowa, considering many predictive factors encompassing both numerical and categorical variables. This study introduces a hybrid regression approach aimed at enhancing prediction accuracy by leveraging the strengths of different regression techniques. Specifically, we explore conventional linear regression along with other machine learning algorithms such as support vector regression (SVR), random forest regression, ridge regression, lasso regression, and XGBoost regression. The dataset employed in this research is sourced from the Kaggle Competition titled “House Prices: Advanced Regression Techniques” (Kaggle, 2024). After model development, various outcomes are submitted to Kaggle, and the resulting predicted accuracy are demonstrated within this paper.
A Hybrid Regression Method for Predicting Housing Prices 1577
RELATED WORK
There are several works that aim to accurately predicting house prices. Troung et al. (2020) use different regression concepts like random forest, extreme gradient boosting, light gradient boosting along with a combination of these to predict the house price index (HPI), a statistic method is used for measuring price fluctuations of real estates. The paper also utilizes stacked generalization which helps to combine several prediction algorithms and get one output. In terms of accuracy, the stacked generalization model comes to be at top followed by other machine learning prediction algorithms. Lu et al. (2017) explores different regression algorithms to predict the sale price of the house. They stated that in terms of predictive accuracy measured by root mean squared error, hybrid regressions outperform individual methods such as Ridge, Lasso, or Gradient Boosting regression. This work follows this insight by combining different regression methods.
Raga et al. (2019) introduced various classification algorithms aimed at predicting whether a house’s resale price will yield a profit or suffer a loss. The study employs logistic regression, decision trees, random forest, naive Bayes, and AdaBoost classification methodologies to make these predictions. Their paper AdaBoost classifier gives the best predictions as measured by accuracy of 96% correct outcomes.
Gao et al. (2022) predicted property valuation on properties at Sydney with the help of different machine learning and deep leaning concepts. The paper implemented linear regression model, support vector regression, tree- based model, gradient boosting based model and artificial neural networks. They concluded that models based on random forest and gradient boosting exhibit higher R-squared values and lower Mean Absolute Prediction Error, indicating better prediction capability. Tay & Ho (1992) conducted a comparison between regression analysis and artificial neural network for predicting apartment prices. They found that the neural network model outperformed the regression analysis model, achieving a mean absolute error of 3.9%.
Similar to the above work, this work compares the performance of multiple machine learning models. In addition, this work also proposed a hybrid regression model that combines ridge regression and lasso regression to provide a better house price result after exploring different feature pre-processing technologies on house properties.
COMPETITION OVERVIEW The Ames Housing competition offers an exploration of real estate pricing dynamics, inviting participants to delve into a dataset brimming with 79 explanatory variables. Created by Dean De Cock, this competition challenges entrants to predict the final sale price of homes in Ames, Iowa, by harnessing advanced regression techniques and creative feature engineering. The evaluation of this competition is based on the Root-Mean-Squared-Error (RMSE) metric (Kaggle, 2024).
1578 Baral and Zhou
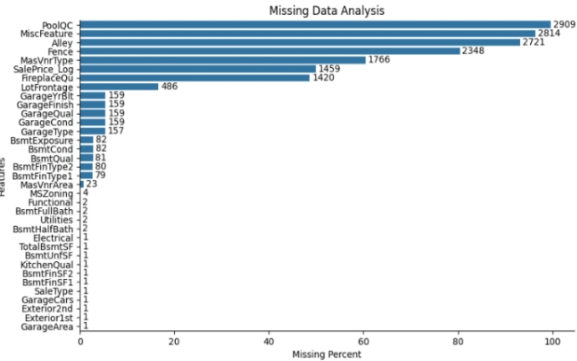
Figure 1: Missing values of different variables.
The response variable is the Sale price of the house in dollars. A descriptive statistic of the sale price is shown in Table 1 below. The dataset consists of 1460 rows and 81columns in the train dataset and 1459 and 80 rows in the test dataset. In the train dataset, there are 43 categorical columns and 38 numerical columns. Figure 1 shows a horizontal bar plot illustrating features with missing values along the Y-axis, and the percentage of missing values along the X-axis. Additionally, the plot displays the total count of missing values across the combined test and train files alongside each bar.
Table 1. Descriptive statistics of the response feature; “Sale Price”.
Table available in the original PDF paper.
Feature Total Count Mean Minimum Median Maximum SalePrice 1460 180921 34900 163000 755000
METHODOLOGY
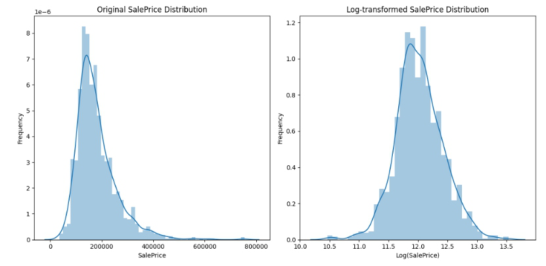
Data Cleaning and Processing The sale prices of the houses are right-skewed, with most prices falling below the median. To fix this, a log transformation is conducted, and the results are shown in Fig. 2 with the help of a histogram. The new sale prices follow gaussian distribution. Next, the missing values across the dataset are appropriately addressed. For numerical categorical predictors, missing values are replaced with the mode of the training dataset. For quantitative predictors, missing values are replaced with the median of the training dataset. Some of the instances in categorical predictors with very small counts are combined into a single category. Additionally, categorical predictors with identical instances, such as “Utilities”and “Street,” are removed from further analysis. The same data cleaning process is applied to the testing data as well.
A Hybrid Regression Method for Predicting Housing Prices 1579
Figure 2: Histogram of “Saleprice” before and after log transformation.
Modelling A total of 6 different regression concepts are used in this paper which are explained in this section.
Linear Regression Linear Regression is the most widely used prediction model that predicts a response variable based on one or more independent(predictor) variables. The prediction will be more accurate when there is a highly linear relationship between response and predictor variables. Simple linear regression is used when a single predictor variable is present, whereas multiple linear regression is utilized when there are multiple predictor variables (Kavitha et al., 2016). In this case, multiple linear regression is used to predict the sale price of the house which is described in equation 1:
Y = β0 + β1X1 + β2X2 + · · · + ε (1) In this equation, Y is the sale price of the house, X1, X2 are the categorical and quantitative predictors. β1 and β2 are the coefficients of the predictors, β0 is the y-intercept and ε is the error term of the regression model.
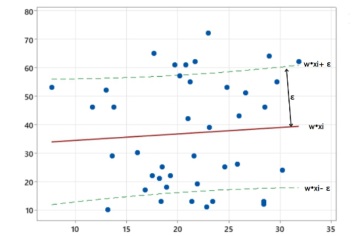
Support Vector Regression Support Vector Regression (SVR) is another regression technique that aims to fit the data within a defined margin of tolerance, penalizing only the data points that fall outside this margin. Depending on the kernel used, Support Vector Regression can model linear or non-linear relationships (Kavitha et al., 2016). In this instance, we utilized the RBF kernel which is best illustrated using the equation 2 and Figure 3.
Equation reproduced from the original PDF.
−γ ∥x −x′ ∥2i
where, γ is the parameter that defines the width of the (RBF) function and ∥x −x′ ∥2 is the squared Euclidean distance between the input vectors x′ and x
1580 Baral and Zhou
Figure 3: Graph showing optimal hyperplane (red) and boundary hyperplane (green) within margin of tolerance (ε).
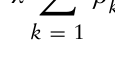
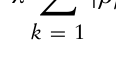
Ridge Regression Ridge regression is another type of regression that is best if used with data that has multicollinearity. When independent variables are highly correlated, least squares estimates are unbiased which is the penalty type used by ridge regression. Along with this, Ridge regression is preferred when all predictors are assumed to be relevant (Owen, 2007). The ridge regression objective function modifies the ordinary least squares (OLS) loss function by adding a penalty term based on the squared value of the coefficients as seen in the equation 3:
K X
X
β2
2 + λ
min
yi −β′xi
k (3)
β i
Equation reproduced from the original PDF.
where
yi −β′xi
2 is the loss function, λ (lambda) is the regularization parameter and β2
k is the penalty term.
Lasso Regression Lasso regression is another regularization technique that promotes simpler models by reducing some coefficients to exactly zero. This is best used for feature selection especially in high-dimensional datasets where many predictors might be irrelevant. Using lasso regression, some coefficients shrink to zero resulting in a sparse model which only has the most significant predicting factors (Owen, 2007). Lasso regression adds an additional penalty term based on the absolute values of the coefficients as seen in the equation 4:
X
K X
2 + λ
min
yi −β′xi
|βk| (4)
β i
Equation reproduced from the original PDF.
where
yi −β′xi
2 is the loss function, λ (lambda) is the regularization parameter and |βk| is the penalty term.
A Hybrid Regression Method for Predicting Housing Prices 1581
XGB Regression To avoid overfitting while capturing intricate data connections, XGBoost utilizes decision trees built in a top-down manner by minimizing a regularized loss function. This makes sure that the parameters do not overfit on the training dataset. Also, it has a variety of hyperparameters used for model fine-tuning (Cross-partitioning is a technique for dividing a dataset into two or more subsets that are mutually exclusive meaning that no data points are shared among them) (Github, 2024).
Random Forest Random Forests uses Bootstrap Aggregating to develop multiple decision trees. For each tree in the forest, random subsets of training data are trained simultaneously. Furthermore, different features are considered randomly for every split in the decision tree, thereby minimizing inter-tree correlations, hence enhancing generalization. As for the prediction of the model, it is average prediction made by all the trees because of which there is less chance of overfitting (Madhuri et al., 2019; Segal, 2004).
EVALUATION METRICS The two metrics used in this competition are listed below with their descriptions:
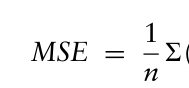
Mean Square Error (MSE) The Mean Squared Error (MSE) quantifies the average squared difference between estimated and actual values. The lower the MSE, the better the algorithm performs on the test data (Chicco et al., 2021). The formula is shown in equation 5:
Equation reproduced from the original PDF.
n6(Predicted Rating −Actual Rating)2 (5)
Root Mean Square Error (RMSE) The Root Mean Squared Error (RMSE) is the square root of Mean Squared Error. The lower the RMSE, the better the algorithm performs on the test data (Chicco et al., 2021). The formula is shown in equation 6:
r Predicted Rating −Actual Rating
2 (6)
RMSE =
1 n6
RESULTS
The ‘SalePrice’ of the houses are predicted using the different regression methods and the submission score (RMSE) is measured on the test dataset which is mentioned in this section. The baseline Kaggle submission RMSE score is 0.15420. All our models surpassed the baseline score with the stacked model of Ridge and XGB performing the best. Table 2 shows the RMSE scores of different regression models. The model hyperparameters are introduced below:
1582 Baral and Zhou
The multiple linear regression model had an R2 of 94.35%. However, the predicted result is worse than other methods as shown below.
The support vector regression used rbf kernel with gamma = 0.0045 and the regularization parameter being 200000.
For Ridge Regression, with the help of k-fold cross-validation object with 10 folds, the optimal α (regularization strength parameter) is found to be 1.18. For Lasso Regression, with the help of cross-validation, the optimal α (regularization strength parameter) is found to be 0.00099.
Table 2. RMSE scores of 6 different regression methods.
Table available in the original PDF paper.
Type of Regression RMSE Linear regression 0.14400 Support vector regression 0.12783 Ridge regression 0.11489 Lasso regression 0. 11720 XGB regression 0.11788 Random forest 0.14893
The XGBoost regression model utilized a learning rate of 0.02, alpha regularization (L1 regularization term) of 0.45, with a maximum depth of 4 for each tree. Additionally, it constructed 5000 boosting rounds (trees) and considered 50% of the features at each split during training.
The Random Forest Regressor was employed with a maximum depth of 15, 20, and 25 for each tree. Additionally, it constructed 27, 30, and 33 trees (n_estimators) to determine the optimal number of trees for the model. Hyperparameter tuning was conducted using a grid search approach with cross-validation to ensure robust performance.
For the hybrid models, different combinations of these models with varying weights were evaluated, and the best scores are summarized in Table 3. While a single model might overfit the data, an ensemble approach that averages multiple models tends to be more robust and generalizes better to new data (Opitz & Maclin, 1999).
Table 3. RMSE scores of 6 combined regression methods.
Since Ridge, XGB, and Lasso models were the best individual models, combining these models was done to further improve the prediction of the house’s ‘SalePrice’. For the Ridge + XGB combination, the final sale price is calculated as 0.7 * Ridge + 0.3 * XGB. For the Lasso + XGB
A Hybrid Regression Method for Predicting Housing Prices 1583
combination, the final sale price is calculated as 0.6 * Lasso + 0.4 * XGB. For the Lasso + Ridge combination, the final sale price is calculated as 0.6 * Lasso + 0.4 * Ridge. Lastly, for the combination of Lasso, Ridge, and XGB, the final sale price is calculated with a weight of 0.33 for each model.
CONCLUSION
Findings from the study reveal that hybrid regression techniques are better than each individual technique when it comes to house price and prediction. Our hybrid models which employ ridge regression, lasso regression, and XGBoost achieved better performance than classical linear regression as well as traditional support vector regression and random forest regression.
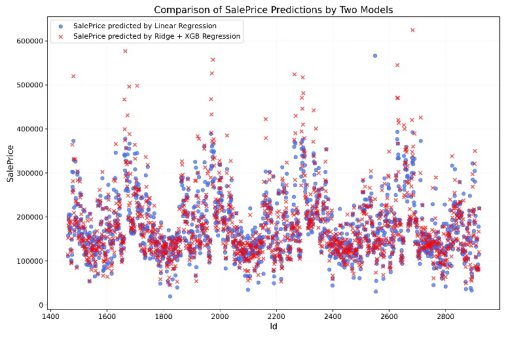
The best model overall is the combined model of Ridge and XGB with an RMSE of 0.11261. Since there are many predictors, Ridge does an excellent job uncovering the multi-collinearity between the predictors and XGBoost. On the other hand, can reduce bias by capturing non-linear patterns. The predicted sale prices of houses using Ridge and XGBoost are compared with the sale prices predicted using linear regression in Figure 4 in which we can see that the combined model seems to capture a more intricate relationship. The resulting hybrid model achieves a balance between bias and variance which helps prevent overfitting and improves model generalization as shown by the low RMSE score on test dataset.
Figure 4: Saleprice predicted on test-data of two different models.
Despite the promising results, there are limitations to this study. The models were trained and tested on the Ames housing dataset, and the findings may not generalize to other regions with different housing market dynamics. Additionally, while the hybrid models performed well, the process of selecting optimal weights for combining predictions from different models can be further optimized using techniques such as Bayesian optimization or genetic algorithms. Another limitation lies in the submission timeline of the competition, where the test labels remain undisclosed to the public and the competition only allows a maximum of 10 submissions per day.
1584 Baral and Zhou
ACKNOWLEDGMENT
The authors would like to acknowledge Kaggle and Dean De Cock for organizing the competition. The author would also like to extend gratitude to L.I.F.E foundation for providing fellowship for the research study.
REFERENCES
Chicco, D., Warrens, M. J., & Jurman, G. (2021). “The coefficient of determination R-squared is more informative than SMAPE, MAE, MAPE, MSE and RMSE in regression analysis evaluation.” PeerJ Computer Science, 7, p. e623. Gao, Q., Shi, V., Pettit, C., & Han, H. (2022). “Property valuation using machine
learning algorithms on statistical areas in Greater Sydney, Australia.” Land Use Policy, 123, p. 106409. Github. (2024). “dmlc/xgboost.” Available at: https://github.com/dmlc/xgboost (Accessed: 05 May 2024). Kaggle. (2024). “House Prices - Advanced Regression Techniques.” Available
at: https://www.kaggle.com/competitions/house-prices-advanced-regression-tec hniques (Accessed: 03 May 2024). Kavitha, S., Varuna, S., & Ramya, R. (2016, November). “A comparative analysis on linear regression and support vector regression.” In 2016 Online International Conference on Green Engineering and Technologies (IC-GET) (pp. 1–5). IEEE. Lu, S., Li, Z., Qin, Z., Yang, X., & Goh, R. S. M. (2017, December). “A hybrid
regression technique for house prices prediction.” In 2017 IEEE International Conference on Industrial Engineering and Engineering Management (IEEM) (pp. 319–323). IEEE. Madhuri, C. R., Anuradha, G., & Pujitha, M. V. (2019, March). “House price prediction using regression techniques: A comparative study.” In 2019 International Conference on Smart Structures and Systems (ICSSS) (pp. 1–5). IEEE. Opitz, D., & Maclin, R. (1999). “Popular ensemble methods: An empirical study.”
Journal of Artificial Intelligence Research, 11, pp. 169–198. Owen, A. B. (2007). “A robust hybrid of lasso and ridge regression.” Contemporary Mathematics, 443(7), pp. 59–72. Sarstedt, M., & Mooi, E. (2014). A concise guide to market research: The Process,
Data, and. 12. Segal, M. R. (2004). “Machine learning benchmarks and random forest regression.” Truong, Q., Nguyen, M., Dang, H., & Mei, B. (2020). “Housing price prediction via improved machine learning techniques.” Procedia Computer Science, 174, pp. 433–442. Tay, D. P., & Ho, D. K. (1992). “Artificial Intelligence and the Mass Appraisal of
Residential Apartments.” Journal of Property Valuation and Investment, 10(2), pp. 525–540.
LISTED IN THE AHFE DIGITAL BOOKSTORE CATALOGUE
Explore the complete digital volume
Human Factors in Design, Engineering, and Computing
Read this individual research paper free through the original publisher, or explore the full digital proceedings book.
ISBN 978-1-964867-35-9
Explore this ISBN in the AHFE Bookstore ↗Listed in the July 2026 bookstore catalogue; search by ISBN to confirm current availability · Digital book purchase optional