Sheuwen Chuang, Kuei-miao Kuo, Jyun-wei Jhang, Jui-chi Lin (2024). Integrating Machine Learning With Resilience Models To Assist Hospital Resilience improvement. In: Human Factors in Design, Engineering, and Computing. AHFE Open Access, vol. 159, pp. 1204–1213. https://doi.org/10.54941/ahfe1005688
Healthcare systems have become increasingly fragile due to growing rates of burnout, depression, distress, and subsequent workforce shortages since the COVID-19 pandemic. Although researchers and institutions urgently called for hospitals and healthcare staff to build resilience to withstand, adapt, recover, rebound, or even grow from adversity, stress, or trauma, the ambiguous relationships between individual and organizational resilience are one of the major obstacles to the development of resilience in hospitals. The COVID-19 pandemic amplified the intersection of individual resilience and system resilience. It provided a good opportunity to discover the weak signals of cognitive behavior of healthcare staff that were ignored before the pandemic. The Patient Safety Culture Survey (PSCS) and the Employee Satisfaction Survey(ESS) are mandatory requirements for hospitals by the hospital accreditation. The PSCS has 46 questions in 8 dimensions. It aims to examine the dimensional strengths and weaknesses of hospitals’ patient safety culture. The ESS (39 questions, 7 dimensions) aims to understand how healthcare workers are satisfied with policy, management, team, job, etc. Both survey data include employees' feelings and attitudes about the work system and workload but have been used only for their designed purposes. Thus, the study aims to identify individual and collective weak signals from routine hospital survey data to proactively support employee retention programs and strengthen hospital resilience promotion activities.The study setting is a medical center. It collected 2020 – 2022 PSCS data including the emotional exhaustion questions adopted from the Maslach Burnout Inventory, and ESS data. First, we applied machine learning(ML) to determine which questions in the PSCS and ESS were associated strongly with workers’ resignation or retention. Next, based on the concepts of the multilevel organizational resilience model and the interplay model of individual and organizational resilience, we accordingly marked each determined question corresponding to individual or organizational resilience elements as a signal map for further improvement activities. Finally, by departments, we screened out the riskiest units to make suggestions for employee care and system resilience improvement. 3076 records of PSCS and 4521 in ESS were analyzed. The XGBoost method combined with 10-fold cross-validation was adopted in ML. By using SHapley Additive exPlanations(SHAP), the SHAP value of PSCS and ESS questions greater than 0.05 were selected as the most meaningful signals to resignation and retention accordingly. PSCS: questions S12 (education & training courses organized by our hospital) and S30, and ESS: questions Q14 (I like my job very much), Q16, Q27, and Q35 were identified for the retention signals. PSCS: question 27 (communication channels and methods of the hospital) and S30, and ESS: question 13 (has a culture that fosters colleagues to learn from others’ mistakes) and Q24, Q37 of ESS were identified for resignation signals. The determined questions were accordingly linked with the elements of individual resilience and organizational resilience by departments for future resilience improvement.The study provides a valuable framework that integrates with ML analysis to utilize the dynamic relationships between individual and organizational resilience and assist in future hospital resilience development.
Healthcare systems have become increasingly fragile due to growing rates of burnout, depression, distress, and subsequent workforce shortages since the COVID-19 pandemic. Although researchers and institutions urgently called for hospitals and healthcare workers (HCWs) to build resilience to withstand, adapt, recover, rebound, or even grow from adversity, stress, or trauma, a lack of understanding, specifically of the practical relationships between individual and organizational resilience, is one of the significant obstacles to the development of resilience in hospitals and keeping workers retention.
The COVID-19 pandemic amplified the intersection of individual resilience and system resilience. It provided an excellent opportunity to discover the weak signals of cognitive behavior of healthcare workers that were ignored before the pandemic. The Patient Safety Culture Survey (PSCS) and the Employee Satisfaction Survey(ESS) are hospital-wide surveys and mandatory requirements by hospital accreditation. The PSCS has 46 questions in eight dimensions: teamwork climate, safety culture, job satisfaction, stress recognition, perception of management, working conditions, emotional
Integrating Machine Learning With Resilience Models to Assist Hospital 1205
exhaustion, and work-life balance. It is designed to annually examine the dimensional strengths and weaknesses of hospitals’ patient safety culture (Sexton et al., 2006). The ESS has 49 questions in seven dimensions: policies and goals, leadership and management, education & training, job scheduling, communication and reporting, salary and benefits, and working environment. It is designed to annually understand how healthcare workers are satisfied with policy, management, team, job, etc. Both survey data are employees’ voices, including healthcare workers’ feelings and attitudes about the work system and workload. However, these voices are hidden and have been used only for their designed purposes, such as safety culture, by dimensions.
The literature emphasized that promoting individual resilience without addressing organizational resilience may leave healthcare workers feeling alienated or marginalized from critical support and resources that organizations can and should provide (Denhardt & Denhardt, 2010; Vercio et al., 2021). Therefore, in acknowledging the interrelations and interdependence of individual and organizational resilience, the study aims to utilize the most essential questions extracted from the massive individual voice by analyzing the two mandatory hospital survey data, ultimately proactively supporting HCWs’ retention programs and strengthening hospital resilience promotion activities.
METHODS
Study Design The study adopted the theory of the differing pathways to resiliency Ang et al. (2018) and the interplay model of individual and organizational resilience (Vercio et al., 2021) as the basic foundations of study design. This was followed by a machine learning analysis of survey data to develop prediction models. The models will also be used to identify essential survey questions that could be used to predict employees’ intention to resign in the future.
Ang et al.’s study revealed three main categories of individual resilience: (i) outlook on work, (ii) self-efficacy and empowerment, and (iii) coping responses. The theory of the differing pathways to resiliency explains the relationships between these three categories and proposes resilience is a dynamic and individualized process. The outlook on work relates to participants’ attitude to work positively or negatively, e.g., enjoying their work. Category self-efficacy and empowerment relate to individuals’ confidence and belief in their own abilities to succeed in specific situations or accomplish a task, negative examples, e.g., just keep quiet. Category coping responses relate to how individuals cope with stressors, e.g., talking to colleagues or trying to ignore them Ang et al. (2018).
The interplay model, on the other hand, not only emphasizes the relationships between individual and organizational resilience but also offers practical implications. It suggests that the ‘weakest link’ viewed as an individual should be transformed into the weakest bond between the individual and the organization. This insight can inspire hospital managers
to recognize that strengthening these bonds is their primary responsibility to support ailing healthcare providers (Vercio et al., 2021).
The study then used the selected survey questions from the ML prediction models to match the characteristics defined by the individual, organizational resilience, and bond in the above models.
Data Source The study setting is a medical center. It collected 2021 – 2022 PSCS data, including de-identified HCWs’ essential variables, i.e., encrypted ID code, gender, age, department, job, seniority, resignation date after the survey, and 46 questions and 2018 – 2022 ESS data, including HCWs’ essential variables and 49 questions. The resignation date was used to determine whether employees resigned after responding to each survey. If the date is not blank, then a registration mark “1” was added to a new column named “resignation” as the positive outcome measure; otherwise, “0” was added to it. This study has been approved by the Joint Institute Review Board of Taipei Medical University, Taipei, Taiwan.
Prediction Model Development and Training In this study, all variables except encrypted ID code, department, resignation date after the survey in the PSCS and ESS datasets, and question 48, 49 (due to about 80% missing data) in the ESS dataset, were selected as the features to develop prediction models. Eight algorithms were selected to develop prediction models that can be formulated as classification models indicating resignation (resignation mark = 1) or retention (resignation mark = 0). These algorithms included logistic regression (LR), Bernoulli Naive Bayes, K Nearest Neighbors (KNN), Multi-layer Perceptron (MLP), Gradient Boosting, Decision Tree, Random Forests, eXtreme Gradient Boosting. The machine learning algorithms were generated using Scikit-Learn library version 1.0.2 in Python programing language version 3.9 (Pedregosa, Varoquaux, & Gramfort et al., 2011).
The training dataset were included the HCWs’ responding data from the two surveys in the medical center. We used the stratified 10-fold cross- validation method in the training set to assess the performance of different algorithms and the overall errors. In detail, the dataset was divided into 10 subsets; each was used repeatedly as the internal validation set.
Model Performance The performances of the algorithms were measured using the area under the receiver operating characteristic curve (AUC), accuracy, sensitivity (recall), specificity, positive predictive value (PPV, precision), negative predictive value (NPV), and F1-score. The best model was defined as the highest AUC by comparing various models based on the 10-fold cross validation. We analyzed the feature’s contribution (i.e., the feature’s importance) to the best model using Shapley Additive exPlanations (SHAP) values (Ning, Ong, Chakraborty et al., 2022). The SHAP results were used to select sensitive questions associated meaningfully with HCWs’ resignation or retention.
Integrating Machine Learning With Resilience Models to Assist Hospital 1207
RESULTS
Baseline Characteristics of the Survey Datasets We identified 350 resignations out of 3076 responders from PSCS in 2021–2022 and 1135 resignations out of 10727 responders from ESS in 2018-2022. Table 1 shows the features’ characteristics in the PSCS dataset, including HCWs’ demographic information and 46 survey questions; Table 2 shows the features’ characteristics in the ESS dataset, including HCWs’ demographic information and 48 survey questions. Eight questions in the PSCS dataset: Q24, Q35, Q36, Q37, Q40, Q41, Q43, Q46 have the mean less than 3.00. However, all 48 questions in the ESS dataset have a mean greater than 3.
Table 1. Features’ characteristics in PSCS dataset (N = 3076).
Job Administration 2029 (18.9) Phar., tech, etc. 1874 (17.5)
Physician 1188 (11.1) Nurse 5636 (52.5)
The Performances of Resignation Prediction Models
Table 3 shows the performance of the resignation prediction models using PSCS dataset. The highest AUC of 0.627 was observed with the logistic regression model (i.e., accuracy, 0.582; precision, 0.179; recall, 0.643; and F1-score, 0.268) compared to other models. Among the machine learning algorithms, the AUC of gradient boosting model, the multi-layer perception model, random forests, and eXtreme GB were observed as the similar second
Integrating Machine Learning With Resilience Models to Assist Hospital 1209
high. Table 4 indicates the performance of the resignation prediction models using ESS dataset. The highest AUC of 0.657 was observed with the Gradient Boosting (GB) model (i.e., accuracy, 0.612; precision, 0.169; recall, 0.647; and F1-score, 0.263) compared to other models. Among the machine learning algorithms, the AUC of the logistic regression model and the multi-layer perception model were observed as the similar highest, at 0.651 and 0.652 respectively.
Table 3. Performance of resignation prediction models using PSCS dataset.
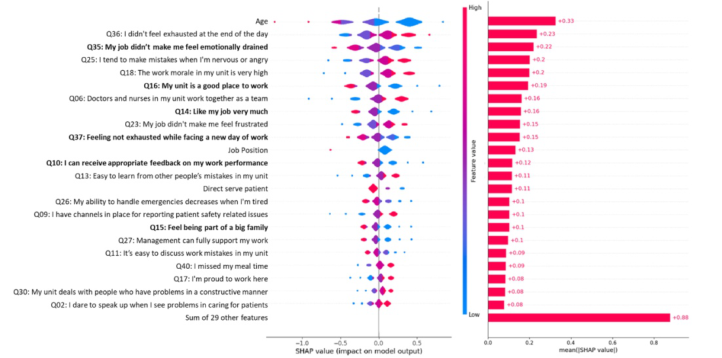
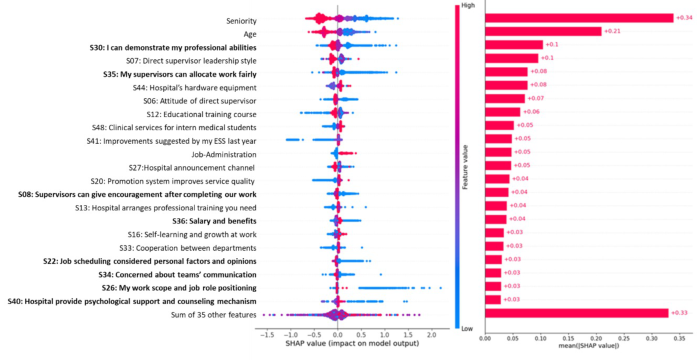
Highly Important Survey Questions for Resignation According to the SHAP values, the resignation prediction models suggest highly important survey questions for resignation from PSCS and ESS, as illustrated in Figures 1 and 2, respectively. Figure 1 shows the importance of the feature of the GB model using the ESS dataset. Figure 2 shows the feature importance of the LR model using the PSCS dataset. Figure 1 lists 23 features, while Figure 2 lists 22 features. Based on the significance and meaningfulness of the selected question for HCWs’ resignation, the research team, including the human resource manager, reviewed the 45 questions. As a result, seven of the most important questions were selected from Figure 1, and eight questions were selected from Figure 2, as shown in Table 5.
Figure 1: Feature importance of the GB model and its SHAP value to explain the resignation application by using PSCS dataset.Figure 2: Feature importance of the GB model and its SHAP value to explain the resignation application by using ESS dataset.
The Selected Questions Corresponding to Resilience Characteristics
Table 5 shows the findings of resilience characteristics matching the selected questions. It identifies five questions related to individual resilience, four for outlook on work, and one for self-efficacy and empowerment. Six questions related to the bond between individual resilience and organizational resilience. Five questions relate to organizational resilience.
Integrating Machine Learning With Resilience Models to Assist Hospital 1211
Q35: My job didn’t make me feel emotionally drained
outlook on work
Q16: This unit is a good place to work
self-efficacy and empowerment
Q37: feeling not exhausted while facing a new day of work
coping responses
Q14: like my job very much
S30: I can demonstrate my professional abilities Bond
S34: concerned about teams’ communication
Q15: feel being part of a big family
Communication
Q16: my unit is a good place to work
sense of belonging
S26: My work scope and job role positioning
shared vision
recognition of gifts
Q10: I can receive appropriate feedback on my work performance
S08: supervisors can give encouragement after completing our work Organizational resilience
S36: salary and benefits
Q27: management can fully support my work
Capital
S35: my supervisors can allocate work fairly
culture
leadership
S22: job scheduling considered personal factors and opinions
system
learning
S40: hospital provide psychological support and counseling mechanism
resources
adaptive capacity
DISCUSSION
Resignation of HCWs adversely affects healthcare effectiveness, patient safety, and hospital growth. Resilient healthcare systems that respond effectively to challenges are key (Thude et al., 2019). The study’s findings revealed that some essential survey questions could significantly influence HCWs’ intention of resignation and their corresponding resilience characteristics. Although the findings in the relationship between selected questions and resilience characteristics could be applied to strengthen hospital retention programs and resilience promotion, some arguments should be examined.
AUC is Not High Enough for Prediction Models For a decade, machine learning techniques have been popularly applied to various fields, such as molecular property prediction in drug development. However, using patient safety survey data and employee satisfaction data in machine learning analysis is rare. Besides, these data are surveyed annually. As a result, the AUC of our resignation prediction models was not high enough compared to other studies in medication or disease diagnosis prediction.
Previous studies found that many employees have not been able to obtain the required support from their organizations (Hirsch, 2021; Sheather & Slattery, 2021), which leads to job dissatisfaction and resignation. If resignation was a strong signal to healthcare organizations, then employee voices were weak signals. Theoretically, survey data are employee voices that could reflect their feeling and attitudes about the working environment. Though weak, they can be used to predict employee retention or resignation; more importantly, the ML analysis of PSCS and ESS data added value to hospital data applications.
To predict resignation, the study found 6 essential questions from the PSCS dataset and 7 from the ESS dataset. Comparing the 13 questions with a global survey report, i.e., PwC’s Global Workforce Hopes and Fears Survey (PWC, 2022), salary or rewarded financially is the top issue (71%), followed by job fulfilling (69%), I can be myself (66%), team cares (60%), these issues are also identified by this study, such as S36: salary and benefits, and others shown as in Figure 1 & 2, and Table 5. In addition, Hirsch (2021) indicated that many resigned employees have not been able to achieve work- life balance, which is similar to our findings in Q35, Q16, and Q37. Zeidner (2020) found that effective employee assistance programs are critical, which is similar to our findings in Q27, S35, S22, and S40.
Future Applications Employee resignation and retention are two sides of the same coin. Before HCWs decided to resign, there was no obvious data to tell managers who would leave. Our findings can contribute to creating early warning messages to tell high-level managers what employees are concerned about in their departments to improve the working environment proactively and increase the retention rate. However, the study’s findings possibly differed from those of other hospitals, as the data used by different hospitals may have been impacted by hospital characteristics.
CONCLUSION
Individual and organizational resilience are of practical importance for retention and healthcare performance. Our study conducted a specifically targeted investigation using a novel method. The study identified core questions and critical connection characteristics between individual and organizational resilience. The findings can support hospital managers in observing both in its totality and in its parts to reinforce employee retention programs and strengthen hospital resilience promotion activities.
ACKNOWLEDGMENT
The authors would like to acknowledge the machine learning support from Dr. Phung Anh Nguyen.
Integrating Machine Learning With Resilience Models to Assist Hospital 1213
REFERENCES
Ang, S, Uthaman, T., Ayre, T., Lim, S., & Lopez, V., (2018). Differing pathways to resiliency: A grounded theory study of enactment of resilience among acute care nurses. Nursing & Health Sciences. 21. 10.1111/nhs.12573. Denhardt, J. & Denhardt, R. (2010). Building organizational resilience and adaptive
management. In J. W. Reich, A. J. Zautra, & J. S. Hall (Eds), Handbook of adult resilience (pp. 333–349). New York/London: The Guilford Press. Goldschmidt, C. C., Paiva, K. C. M. & Irigary, H. A. R. (2019). Organizational resilience: proposition for an integrated model and research agenda, Tourism & Management Studies, 15(3), 37–46. Hirsch, L., Cowley, S., & Scheiber, N. (2021). Biden’s Vaccine Mandate Leaves
Businesses Relieved but Full of Questions. New York Times, 38. Li W., Jian S., Chen Y., Huang D..o, Li J., Li S., (2008). Reliability and validity analysis of the Chinese version of the Patient Safety Attitude Questionnaire. Taiwan Journal of Public Health 27(3): 214–222. (in Chinese) Maslach C, Jackson SE, Leiter M. (1996). Maslach Burnout Inventory. Manual 3rd
ed. Palo Alto, CA: Consulting Psychologist Press. Ning Y, Ong MEH, Chakraborty B, et al. (2022). Shapley variable importance cloud for interpretable machine learning. Patterns 3:100452. Pedregosa F, Varoquaux G, Gramfort A, et al. (2011). Scikit-learn: machine learning
in python. J Mach Learn Res.12: 2825–2830.). PwC, PwC’s Global Workforce Hopes and Fears Survey 2022, 2024 May 24 https: //www.pwc.com/gx/en/issues/workforce/hopes-and-fears-2022.html. Sexton JB, Helmreich RL, Neilands TB, et al. (2006). The Safety Attitudes
Questionnaire: psychometric properties, benchmarking data, and emerging research. BMC Health Serv Res Volume 6: 44. Sheather, J., & Slattery, D. (2021). The great resignation: How do we support and retain staff already stretched to their lLimit. British Medical Journal, 375, 2533–2534. https://doi.org/10.1136/bmj.n2533. Thude BR, Juhl AG, Stenager E, Plessen CV, Hollnagel, E. (2019). Staff acting
resiliently at two hospital wards. Leadership in Health Services 32: 445–57. Vercio C, Loo LK, Green M, et al., (2021). Shifting focus from burnout and wellness toward individual and organizational resilience. Teach Learn Med. 33 (5):568–576. Epub 2021 Feb 15. PMID: 33588654. Zielinski, D. (2020). Better Mental Health: From Virtual to Reality. HR Magazine,
65, 21–23.
LISTED IN THE AHFE DIGITAL BOOKSTORE CATALOGUE
Explore the complete digital volume
Human Factors in Design, Engineering, and Computing
Read this individual research paper free through the original publisher, or explore the full digital proceedings book.
ISBN 978-1-964867-35-9
Explore this ISBN in the AHFE Bookstore ↗Listed in the July 2026 bookstore catalogue; search by ISBN to confirm current availability · Digital book purchase optional