Alana Nagy, Scot Miller, Bruce Nagy (2024). Investigating common factors needed for consumers to trust AI\ML. In: Human Factors in Design, Engineering, and Computing. AHFE Open Access, vol. 159, pp. 118–128. https://doi.org/10.54941/ahfe1005574
Is there a set of trust factors that might apply to all Machine Learning (ML) algorithm types and domain applications, independent of behavioral variations? Can this common set of factors support a baseline standard represented by a ML trust scorecard? These questions are being investigated by The Technical Cooperation Program (TTCP) involving Australia, Canada, New Zealand, United Kingdom (UK), and the United States of America (USA). This paper describes the results of an initial investigation into whether a common set of factors allows consumers to initially trust ML in critical situations. The goal was to determine if job role variations were statistically unaffected by confounder bias by modeling causal relationships and analyzing influences. Through Qualtrics, questions containing factors derived from TP 8864 AI Level of Rigor, the document used by USA and UK governments to develop official guidance, were deployed to 81 international participants consisting of various roles with technology, specifically developers, operators, and users. Participant roles consisted of a mix of autonomous and ML Systems used in surface, subsurface and land system domains. Not all autonomous participants had ML knowledge. Introducing a Behavioral Dynamics Model (BDM) became key in designing Likert scale questions containing perception, needs, and experience grouping of related factors. This design allowed for a statistical investigation of whether causality between groups affect bias towards ML. The BDM survey grouped trust factors that mapped to a ML Scorecard design consisting of Calibration, Experience, and Fatality (CEF) categories: - Calibration (ML algorithm’s limitation and strengths – represents testing requirements): --- (Likert Scale) Perceptions factors investigated: Safety, Dependability, Reliability, Suspicion, and Comfortability. --- (Likert Scale) Needs factors investigated: Human Oversight, Performance, Development, Teamwork, Adaptation, Improve Ability of Success, and Proof. - Experience (ML Algorithm’s ability to conform to consumer paradigms – represents training requirements): --- (Likert Scale) Experience factors investigated: Positive History, Past Usage, Training Adequacy, and Expectations ML Systems Fail on First Use. - Fatality (ML technology’s ability to provide decision rationale – represents development requirements): --- Open-Ended Questions: Responses aligned to Perceptions, Needs and Experience factors with emphasis on demonstrating transparency, security, certification, and ethics. By using a statistical decomposition approach of 19 hypothesis investigated using ANCOVA, ANOVA and t-test analysis, common factors for a scorecard emerged, with one exception involving adaptation in the Calibration category. From the open-ended questions, different patterns emerged based on role variations for developer, operator, and user. The key similarity was that to establish trust, strong evidence through observation or test is needed. Differences were that developers wanted oversight and reliability of an ML system, while users and operators generally wanted ML operational capability experience. Additionally, evidence indicated that the ML system needs to be trained to replace human interaction either by conforming to the participant’s past experiences or ensuring that the participant is adequately trained to trust a new ML paradigm. The findings showed that the Behavioral Dynamics Model successfully extrapolated TP 8864 guidance into questions about trust that statistically determined a common set of factors in a CEF scorecard for ML algorithms, independent of technical roles.
Motivation Can a common set of trust factors support a baseline standard represented by a Machine Learning (ML) Trust Scorecard? Can the scorecard represent all algorithm types and domain applications, independent of behavioral variations? These questions are being investigated by The Technical Cooperation Program (TTCP) involving Australia, Canada, New Zealand, United Kingdom (UK), and the United States of America (USA). The goal is to determine if job role variations are statistically unaffected by confounder bias by modeling causal relationships and analyzing influences. This paper describes the results of an initial investigation into whether a common set of trust factors, causally related through personality contributors, can create a scorecard and potential standard.
Background
Trust can rapidly become a complex menagerie of social, economic, and personality issues (Lukyanenko, 2022), indicating a bias between the
Investigating Common Factors Needed for Consumers to Trust AI/ML 119
Artificial Intelligence (AI) to human relationship. This is due to variations in consumer personality contributors such as attitude, vulnerability, and belief. For example, the article Trust in Automation: Designing for Appropriate Reliance, states: “[an] attitude that an agent (automation or another person) will help achieve an individual’s goals in a situation [is] characterized by uncertainty and vulnerability.”(Lee & See, 2004). Another example described as the most cited definition on Trust is: “The willingness of a party to be vulnerable to the actions of another party based on the expectation that the other will perform a particular action important to the trustor, irrespective of the ability to monitor or control that other party” (Mayer, 1995, p. 712). Finally, a common definition of Trust (noun) is: “Firm belief in the reliability, truth, ability, or strength of someone or something” (Online Google Dictionary/Oxford Languages, 2024). These examples show that there is a challenge in how consumers trust AI, due to the limitations in creating credible, objective measurements.
Many research initiatives indicate that the key factor in achieving and building trust is in continued explainability of the AI decisions over time (Lukyanenko, 2022). Popular approaches to achieving and measuring trust focus on “trust trajectory” (Glikson, 2020), indicating a need to have extended time to develop a relationship. The attitude that AI “ought to be trusted” (Ashoori, 2019) is a concern, and contradicts the process of it being earned suggested in the previous definitions. Other research indicates that quality AI development is key. The Technical Pub (TP) 8864 AI Level of Rigor (LOR) document provides detailed guidelines for the acquisition and development of systems incorporating AI functions (Nagy, 2022).
The TP 8864 AI LOR provides guidelines on how to create varying degrees of confidence in the quality of the AI development cycle. The degree of confidence is determined by which of the 14 LOR tasks, focused on best practices and measurement, is applied across: (1) Requirements, (2) Architecture, (3) Algorithm Design, (4) Algorithm Code, and (5) Test and Evaluation (T&E). Each LOR task provides questions and/or measurable considerations that allow developers to objectively evaluate AI/ML function based on best practices and metrics, e.g., confusion matrix and Receiver Operator Characteristics.
This study investigated which factors would emerge to populate a common Trust Scorecard. The goal was to determine scorecard content that would improve a consumer’s ability to trust an ML algorithm upon their initial use.
RELATED WORK
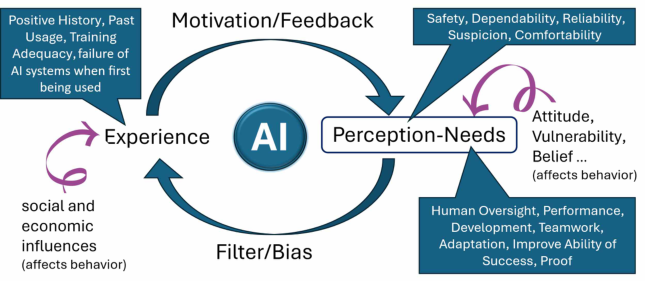
Perceptions and needs are connected from a behavioral perspective (Betancourt, 2017; Vansteenkiste et al., 2020). Perceptions and needs, driving each other, can create bias affecting and sometimes causing specific experiences. Experience can affect how motivation can increase or decrease during an action, potentially changing perceptions or needs. To take advantage of this causal relationship, we created a Behavior Dynamic Model (BDM), proposing that perception/needs shapes experience, and experience shapes perceptions/needs.
This cyclic relationship represented by the BDM is noted in various research. In the study, How previous experience shapes perception in different sensory modalities, “we perceive our environment as unified whole…our brains achieve this using prior knowledge.” (Synder et al., 2015). This claim can also be supported by Kurt Lewin’s formula for behavior: B = f(P, E) where, “behavior is a function of a person’s characteristics and his or her subjective experiences of the environment” (Kesberg & Keller, 2018). The BDM suggests that the way people perceive AI reflects their experiences. It focuses on the dynamics of experiences driving how an AI system is perceived and needed.
Figure 1: Behavior dynamic model.
Other questionnaires have been used to decipher different distinctions of trust (Lewis et al., 2018). This includes empirically derived (ED) surveys, the HRI Trust Scale, and pyramid diagrams such as IMPACTS (Hou et al., 2021, pp. 82–87, Jian et al., 2000, p. 30, Schaefer, 2016, pp. 213–214). Our approach differs by using the BDM and TP 8864 AI LOR, focusing on best practices for development and testing, to include dataset measurements (Nagy, 2021).
METHOD
Design Three statistical designs, involving exploratory analysis of bias and sample means, were executed using multiple hypotheses based on one survey collection experiment. The experiment used standard scaling questions. Participants had developer, operator, and user responsibilities involved with AI and autonomous systems. For design 1 and 2, developer, operator, and user participant types were used as independent variables. The dependent variables were participant responses involving Perception and Need factors, with the covariate being participant experience responses for confounder analysis. For design 2, analyzing sample mean comparisons, the dependent variables were Perception, Need, and Experience-based factors using all three independent variables. For design 3, independent variables were
Investigating Common Factors Needed for Consumers to Trust AI/ML 121
developers and users, developers and operators, and users and operators. These independent variables were paired together to compare sample means. The dependent variable was adaptability. A “within groups” was used for all three designs. Additionally, Open-Ended questions completed the survey and were used to validate factors and potential topics missed. Multiple responses from participants were permitted.
Participants Participants from five countries attended two events, one specific to AI-embedded products and the other to autonomous platforms. Autonomous platforms did not necessarily contain AI technology; therefore, some participants did not have an AI background. The AI-embedded products and autonomous platforms spanned air, surface, subsurface and land system domains, causing participants to have various types of knowledge specific to their technology. Our independent variables were represented by three participant types: (1) Developers – participants that directly/in- tentionally affected requirements, architecture, design, development, and/or testing of the AI tech, (2) Operators – hands-on-technology participants, having direct control of the technology’s capabilities, e.g., movement, and (3) Users – participants that take advantage of the technology’s performance or results; they did not have direct control of its capabilities (as opposed to operators). These three types consisted of consumers with varying degrees of AI technical depth and understanding. There were sufficient participant types to conduct the exploratory experiment.
Recruitment was based on QR codes with summary descriptions printed as flyers to use with iPads and iPhones to scan. Also, emails were sent with QR codes to group leaders as an awareness to share with their teams.
Materials
Qualtrics was used to create and deploy the questionnaire using the QR code feature. SPSS was used for statistical analysis. There were three questionnaires in total, one each for developer, operator, and user, acting as the independent variables. Though some questions were tailored to developer, user, and operator roles, this paper only discusses the analysis of common questions.
The survey incorporates a Likert scale, a common data collection approach used in industry (Ashoori, 2019). The Likert scale produces ordinal data that provides consistent results among different parametric statistical techniques (Warachan, 2011) (de Winter & Dodou, 2012), supporting more reliable conclusions. The survey includes questions related to AI performance and reliability, variables that are common in many studies (Bach, 2023). Our target group were people with technical knowledge to avoid bias caused by participants that lacked basic, formal education (Bach, 2023). A quarter of studies on measuring trust indirectly comes from surveys versus reacting directly with an AI system (Ueno, 2022, pp. 1–7). In using this approach, we address risk in using AI (Gilkison, 2020) potentially causing hesitation or misuse. Survey questions were based on variables derived from TP 8864
AI Level of Rigor, the document used by USA and UK governments to develop official guidance. In appreciation, Gale Lucas, from the University of Southern California, Psychology Department, provided Likert Scale survey questions that were aligned to a subset of our TP 8864 AI LOR extrapolated factors.
Following the BDM, the survey grouped factors into Perception, Need, and Experience. The factors were then categorized into a Trust Scorecard based on Calibration, Experience, and Fatality (CEF). The Calibration category represents testing requirements for ML algorithm’s limitation and strengths, including Perception factors: Safety, Dependability, Reliability, Suspicion, and Comfortability. The calibration category also includes Need factors: Human Oversight, Performance, Development, Teamwork, Adaptation, Improve Ability of Success, and Proof. The Experience category represents training requirements for ML algorithm’s ability to conform to consumer paradigms. This category is populated based on Experience factors: Positive History, Past Usage, Training Adequacy, and Expectations. The Fatality category represents factors that provide rationale for an algorithm’s recommendations that can result in loss of life. As an exploratory process, we used Open-Ended Questions, traceable to BDM factors, to determine if responses aligned to Perception, Need, and Experience factors or if other considerations were needed. Other questions pertained to: project name of AI or autonomous experiment, event attending, organization affiliation, country affiliation, date, and time of day.
Procedure A surveyor was on site to promote filling in the survey for one week out of the two for both events. For the first event, the surveyor was available for the second week of the event. For the second event, the surveyor was available for the first week of the event. The surveyor did not provide any details but focused on promoting people to investigate the survey on their own. The survey was available for all four weeks for the participants to complete. Flyers containing QR codes printed with definitions of developers, operators, and users were deployed in the main eating hall. The flyers were taped to one end of a table, and all tables had QR codes available to use with iPhones and iPads. Several times during each event, an announcement for the survey was made to voluntarily participate in the survey. When the survey opened via QR code, the definition for each group was shown. The participant then proceeded to answer the specific set of questions for their group. Participants were permitted to answer multiple times, supporting the study’s investigative and exploratory intent. Additionally, participants self-selected to answer the survey and could stop at any time.
Results
There were 81 responses from 79 participants, having 3 participants answer twice. Out of the 81, there were 68 that responded only to the Likert scale questions. Out of the 79 participants, 33 developers, 7 operators, and 18 users responded with descriptive answers for the Open-Ended Questions. Data was examined for differences in Perception and Need among the
Investigating Common Factors Needed for Consumers to Trust AI/ML 123
different levels of technical expertise. Table 1 describes the overall totals, including tallies for those with no or little AI experience out of the 79 participants.
SPSS was used to analyze designs 1, 2, and 3. During design 1, two ANCOVA analyses were conducted based on the BDM: (1) Experience factors biasing the three independent variables when answering questions related to the Need factors, and (2) Experience factors biasing the three independent variables when answering questions related to the Perception factors. However, due to the normality assumption being violated for Perception and Need factors, the ANCOVA analysis could not be reliably performed.
For design 2, we created null hypotheses 1–16, conducting multiple ANOVAs. We assumed weak normality could be tolerated, as these tests were not considered as part of a “universal null hypothesis” requiring Bonferroni corrections (Blanca et al., 2017). The various hypotheses (H0,1 to H0,16) and p-values (p-val) are shown in Table 2.
Table 2. Null hypotheses 1-16.
Table available in the original PDF paper.
Claim Developers, Operators and Users p–val
Null hypothesis 1
.500
H0,1
Analysis of perceptions with regard to feeling safe around AI.
Equations and mathematical formulas are available in the original paper PDF.
.622
H0,2
Analysis of perceptions with regard to Al dependability.
Equations and mathematical formulas are available in the original paper PDF.
.872
H0,3
Analysis of perceptions with regard to Al reliability.
Equations and mathematical formulas are available in the original paper PDF.
.828
H0,4
Analysis of perceptions with regard to as being suspicious of Al.
Equations and mathematical formulas are available in the original paper PDF.
. 981
H0,5
Analysis of perceptions with regard to comfortability with Al.
Equations and mathematical formulas are available in the original paper PDF.
.110
H0,6
Analysis of needs with regard to having Al prove itself before use.
Equations and mathematical formulas are available in the original paper PDF.
.093
H0,7
Analysis of needs with regard to having Al improve a team’s ability.
Equations and mathematical formulas are available in the original paper PDF.
.631
H0,8
Analysis of needs with regard to human oversight.
Equations and mathematical formulas are available in the original paper PDF.
.511
H0,9
Analysis of needs with regard to Al performance.
(Continued)
Table 2. Continued Claim Developers, Operators and Users p-val
Table available in the original PDF paper.
Equations and mathematical formulas are available in the original paper PDF.
.651
H0,10
Analysis of needs with regard to Al development.
Null hypothesis 11 H0,11 Analysis of needs with regard to teamwork .917 Null hypothesis 12
< .001
H0,12
Analysis of needs with regard to Al adaptability.
Equations and mathematical formulas are available in the original paper PDF.
.189
H0,13
Analysis of experiences involving knowledge of Al.
Equations and mathematical formulas are available in the original paper PDF.
.769
H0,14
Analysis of experiences involving past usage of Al.
Equations and mathematical formulas are available in the original paper PDF.
.094
H0,15
Analysis of experiences involving training adequacy with Al
Null hypothesis 16
.994
H0,16
Analysis of experiences involving failure of Al systems when first being used.
For null hypotheses 6, 7, and 12, having equality of variances violated, Welch’s Test was used to gather significance. Null hypothesis 12 (H0,12) was a noted exception (*) to other trust factors by being shown to be statistically significant at 0.05, expressed as (H0,12): F(2, 35.39) = 8.871; p < 0.001, as shown in Table 3. For design 3 (null hypotheses 17–19), further investigation on the adaptability factor using t-tests were used. Table 4 shows the hypotheses related to significances at 0.05. Null hypothesis 17 and 18, is described in Tables 5 and 6. Hypothesis 17 analysis results are (H0,17): t(34.93) = −4.021; p<.001, and hypothesis 18 analysis results are (H0,18): t(57.98) = −3.026; p<0.05. For Tables 5 and 6, normality was allowed tolerance for our two-sample t-test due to sufficient sample size (Posten, 1984) and exploratory approach.
Open-Ended Questions from design 3 indicated a focus on transparency, security, certification, and ethics were raised, affecting all three CEF categories. Different patterns of thought emerged based on roles for developer, operator, and user, but the key similarity was that to establish trust, strong evidence through observation or test is needed. Differences include developers wanting oversight and reliability when working with an AI system, while users and operators generally wanted experience while working with an AI system.
DISCUSSION
Findings The BDM causal construct made it flexible to explore using three different designs involving 19 hypotheses using ANCOVA (design 1), ANOVA (design 2) and t-test analysis (design 3). Apart from design 2’s null hypothesis 12 on adaptability being rejected, initial findings indicate that a single CEF categorized scorecard can use Perception, Need, and Experience factors. Due to the commonality between developers, users, and operators relating to these factors, a Trust Scorecard may ensure better first-time use of an AI system. From design 3’s, H0,17, H0,18 developers had different set of needs when it comes to adaptability. To the question, ‘when things go wrong, the AI needs to be capable of adapting,’ both operators and users were closer to completely agreeing, while the developers were closer to somewhat agreeing.
The findings showed that the BDM successfully extrapolated TP 8864 guidance into questions about trust. The study statistically explored a common set of factors in a CEF scorecard for ML algorithms, independent of technical roles. This also suggests that creating a metric for the adaptability factor, applied to a scorecard, could cause mistrust in an AI system, if the population consisted of consumers with varying degrees of AI knowledge. System Safety doctrine does not allow for adaptability during consumer use (Nagy, 2022). The issue is how to effectively apply guardrails during the real-time learning process.
Open-Ended Questions from design 3, although needing additional statistical verification, seem to indicate that AI needs to conform to the paradigm of the individual. This can be possible through training, or having the AI understand the person’s past interactive experiences with other people it might be replacing.
In summary, a Likert survey was successfully constructed from a BDM, based on TP 8864 extrapolated factors, representing the cyclic dynamic of perception, needs, and experience. The initial survey analysis identified a set of common factors for a CEF categorized, Trust Scorecard, and next step direction.
Limitations Our data size was limited, and our normality test was violated. The surveyor doing the promotion was not available through the entire period of events to answer questions. We assumed that the 3 people out of 81 responses that took the same test twice did not alter the results. This assumption needs to be investigated. During the two events, there were many competitive processes of other trust experiments being performed for specific AI and autonomy systems. During the first event, other QR codes were being promoted for other trust projects. During the second event, there were QR code Trust Scorecard flyers competing with sales flyers promoting autonomous commercial products. In the future, a more isolated experiment setting, or potential consolidation of the international trust experiments may be beneficial. As more participants gain access to the questionnaire, a more robust analysis of data may be possible.
Future Research This paper represents an initial step in creating a scorecard. More surveys need to be included to validate how well a factor can translate into measurements described by TP 8864 AI LOR. For example, an experiment might investigate how Confusion Matrix optimization results can be represented within the scorecard, possibly supporting needs factors of the BDM. How will metric values be captured from formal AI development and test results? Investigation of multi-media, to represent evidence of trust, might make it easier for consumers to understand the development or test measured results.
The question remains as to whether participant self-selection and optional question responses caused answer bias. Random selection of participants
Investigating Common Factors Needed for Consumers to Trust AI/ML 127
with a requirement to answer all questions of the survey is being considered. To evolve the CEF Trust Scorecard using the BDM of causality and associations, collection and understanding of data relevance is needed. Larger sample sizes, emphasizing ANCOVA analysis with post-hoc tests, e.g., Bonferroni corrections for type I errors, may discover bias relationships. Collection of multiple samples from the same participant over a designated time may provide insights into the cyclic dynamic of perceptions, needs, and experiences.
There needs to be a focus on developing a CEF Trust Scorecard. Other survey questions, such as ED, HRI Trust Scale, IMPACTS, and The Big Five, may be effective in this analysis with refining factors of trust. Continuing exploration of similarity and difference patterns that appear in current collected sets of closed and Open-Ended questions could also be beneficial. By taking these next steps, we can move towards an eventual “best case” goal in answering: How much does personal bias override technical knowledge when AI is trusted? This would provide the answer to whether there can be a scorecard as a standard for all AI.
REFERENCES
Armstrong, R. A., 2014. When to use the Bonferroni correction. Ophthalmic and Physiological Optics, 34(5), pp. 502–508. Ashoori, M. and Weisz, J. D., 2019. In AI we trust? Factors that influence
trustworthiness of AI-infused decision-making processes. arXiv preprint arXiv:1912.02675. Bach, A. T., Khan, A., Hallock, H., Beltrão, G. and Sousa, S., 2023. A Systematic Literature Review of User Trust in AI-Enabled Systems: An HCI Perspective. arXiv e-prints, arXiv-2304. Betancourt, J. R., 2018. Perception is Reality, and Reality Drives Perception: No
Time to Celebrate Yet. Journal of General Internal Medicine, 33(3), pp. 241–242. Blanca, M. J., Alarcón, R., Arnau, J., Bono, R. and Bendayan, R., 2017. Nonnormal data: Is ANOVA still a valid option? Psicothema, 29(4), pp. 552–557. doi: 10.7334/psicothema2016.383. PMID: 29048317. de Winter, J. F. C. and Dodou, D., 2019. Five-Point Likert Items: t test versus
Mann-Whitney-Wilcoxon. Practical Assessment, Research, and Evaluation, 15, Article 11. Glikson, E. and Woolley, A. W., 2020. Human trust in artificial intelligence: Review of empirical research. Academy of Management Annals, 14(2), pp. 627–660. Hou, M., Ho, G. & Dunwoody, D. (2021) ‘IMPACTS: a trust model for human-
autonomy teaming’, Human-Intelligent Systems Integration. Jian, J.-Y., Bisantz, A. M. & Drury, C. G. (2000) ‘Foundations for an Empirically Determined Scale of Trust in Automated Systems’, International Journal of Cognitive Ergonomics, 4(1), pp. 53–71. Kesberg, R. and Keller, J., 2018. The relation between human values and perceived
situation characteristics in everyday life. Frontiers in Psychology, 9. Lee, J. D., & See, K. A. (2004). Trust in Automation: Designing for Appropriate Reliance. Human Factors, 46(1), pp. 50–80. Lewis, M., Sycara, K. & Walker, P. (2018) ‘The role of trust in human-robot
interaction’, in Foundations of Trusted Autonomy, pp. 135–159.
Lukyanenko, R., Maass, W. and Storey, V. C., 2022. Trust in artificial intelligence: From a Foundational Trust Framework to emerging research opportunities. Electronic Markets, 32(4), pp. 1993–2020. Mayer, R. C., Davis, J. H. and Schoorman, F. D., 1995. An Integrative Model of
Organizational Trust. The Academy of Management Review, 20(3), pp. 709–734. Nagy, B., 2021. Increasing Confidence in Machine Learned (ML) Functional Behavior during Artificial Intelligence (AI) Development using Training Data Set Measurements, Proceedings of the Eighteenth Annual Acquisition Research Symposium, Naval Postgraduate School. Nagy, B., 2022. Level of Rigor for Artificial Intelligence Development. Naval Air
Warfare Center Weapons Division (NAWCWD), China Lake, CA, USA, April 2022. NAWCWD TP 8864. Posten, H. O., 1984. Robustness of the two-sample t-test. In Robustness of statistical methods and nonparametric statistics (pp.92–99). Dordrecht: Springer Netherlands. Schaefer, K. E. (2016) ‘Measuring Trust in Human Robot Interactions: Development
of the “Trust Perception Scale-HRI”‘, in Robust Intelligence and Trust in Autonomous Systems, pp. 191–218. Snyder, J. S., Schwiedrzik, C. M., Vitela, A. D., Melloni, L., Melloni, L. and Melloni, L., 2015. How previous experience shapes perception in different sensory modalities. Frontiers in Human Neuroscience, 9. Vansteenkiste, M., Ryan, R. M. and Soenens, B., 2020. Basic psychological need
theory: Advancements, critical themes, and future directions. Motivation and Emotion, 44, pp. 1–31. Warachan, B., 2011. Appropriate Statistical Analysis for Two Independent Groups of Likert-Type Data (Version 1). American University. Ueno, T., Sawa, Y., Kim, Y., Urakami, J., Oura, H. and Seaborn, K., 2022.
Trust in human-AI interaction: Scoping out models, measures, and methods. In CHI Conference on Human Factors in Computing Systems Extended Abstracts (pp. 1–7).
LISTED IN THE AHFE DIGITAL BOOKSTORE CATALOGUE
Explore the complete digital volume
Human Factors in Design, Engineering, and Computing
Read this individual research paper free through the original publisher, or explore the full digital proceedings book.
ISBN 978-1-964867-35-9
Explore this ISBN in the AHFE Bookstore ↗Listed in the July 2026 bookstore catalogue; search by ISBN to confirm current availability · Digital book purchase optional