Lokesh Singh, Sarvapali Ramchurn, Yi Dong (2024). Understanding Stress Responses: Exploring Facial Expressions in the Context of Individual Performance and Automated Agents. In: Human Factors in Design, Engineering, and Computing. AHFE Open Access, vol. 159, pp. 994–1003. https://doi.org/10.54941/ahfe1005666
Understanding and effectively detecting stress is paramount across various domains, including healthcare and business, where individuals often operate under pressure. This paper proposes a novel approach that employs facial expression analysis to discern stress levels during both stressful and non-stressful phases. Our study aims to understand the impact of automated agents on individual performance and how performance, in turn, influences facial expression dynamics. Utilizing facial video data, we scrutinize the facial expressions exhibited by individuals under induced stress conditions, comparing them with relaxed states. Building upon prior research in stress detection, we conduct in-person experiments to study facial expressions indicative of stress responses, examining features such as facial muscle movements, microexpressions, and overall expression dynamics. Machine learning techniques are leveraged to classify stress levels based on facial expressions extracted from video data. Preliminary findings reveal distinct patterns of facial expressions associated with stress, encompassing heightened muscle tension, altered facial symmetry, and changes in expression intensity. By contrasting these patterns between stressful and non-stressful phases, our objective is to formulate a robust model for real-time stress detection using facial analysis. This research contributes to the advancement of stress detection methodologies, offering potential applications in healthcare, psychology, and human-computer interaction. Future directions include refining the classification model and exploring additional contextual factors that influence facial expressions during stress.
The integration of automated systems across diverse sectors has led to concerns regarding their effects on human performance, particularly under induced stress. Parasuraman et al. (2000) present a model that details the types and levels of automation and their consequential impact on human performance. Automated systems often introduce performance pressure that, in conjunction with time constraints and reward-based incentives, can add to stress levels. Caviola et al. (2017) review the effects of stress, time pressure, and math anxiety on strategy selection in arithmetical tasks, highlighting how these factors disrupt cognitive processes including working memory and
problem-solving approaches. It is critical to comprehend how individuals and teams respond to these pressures to design human-centred systems that mitigate negative impacts on both performance and well-being.
In their study protocol Becker (2022) explore the biopsychological stress responses to multitasking and work interruptions in digitally demanding work environments. This research aims to investigate the relationship between stress and performance in controlled environments where participants compete against automated agents (Singh, 2023). Human Factors research focuses on incorporating human abilities, which include but are not limited to cognitive, physical, sensory, and team interactions, into system design, with the primary objective of ensuring that human capabilities are seamlessly integrated with system interfaces to maximize performance. By studying how different stressors influence human performance, human factors research aims to refine system designs to reduce stress and enhance efficiency and effectiveness (Boy, 2023). Stress is a prevalent issue affecting individuals across various domains, from healthcare to business. Understanding stress and its manifestations is crucial in areas such as healthcare, where early detection can lead to preventive care and timely treatment (Kiecolt-Glaser, 2020). In the business domain, recognizing stress indicators can facilitate the design of improved work environments and enhance employee support systems (Taris, 2006). In educational settings, identifying student stress can guide interventions to improve learning outcomes (Putwain, 2013). Moreover, in human-computer interaction, stress- aware systems can adapt to users’ emotional states, providing more intuitive and supportive user experiences (Picard, 2001). It is well-documented that prolonged stress can lead to severe health issues, including cardiovascular diseases, anxiety disorders, and weakened immune function (Cohen S. A.-D., 2007) (Segerstrom, 2004). Prior studies demonstrated that cognitive load and stress tend to increase with task complexity and time constraints, leading to impaired performance and heightened anxiety (Sweller, 1988). Stress negatively affects productivity, job satisfaction, and overall employee well- being (Stansfeld, 2006). Hence, effective detection and management of stress are critical to enhancing quality of life and improving performance in high-pressure situations. Recent advancements in technology have facilitated new avenues for stress detection, particularly through non-invasive methods such as facial expression analysis (Williams, 2018) (D’mello, 2015). Unlike traditional self-reported measures or physiological sensors, facial expression analysis offers a real-time, unobtrusive way to monitor stress levels. This method holds promise for applications in telemedicine, employee wellness programs, and human-computer interaction systems, where continuous stress monitoring can lead to timely interventions and better outcomes (Lucey, 2010). The task was designed to replicate a high-stress environment, where both time and performance pressures serve as key stressors. Participants’ facial expressions were recorded to assess stress levels, and both the Perceived Stress Scale (PSS) and NASA-TLX were used to provide subjective measurements of stress and cognitive load. Additionally, a deep learning model was developed to classify stress levels based on facial expressions, offering an objective assessment of stress throughout the task.
Proposed Approach To analyse the impact of induced stress on task performance under competitive conditions, a time-constrained task was developed utilizing Microsoft Excel and Visual Basic to enable real-time performance tracking. Participants were required to arrange numbered coloured blocks in ascending order while competing against automated agents, displayed on a secondary screen, to simulate a competitive environment. The task, lasting six minutes, was structured to apply increasing pressure by informing participants of the time remaining, thus inducing stress as the task progressed. Performance was quantified by the number of correctly arranged blocks within the time limit, with an additional reward incentive for outperforming the automated agents, further elevating stress levels. For the classification of stress, a deep learning model based on the inception V3 architecture was employed, and modified for binary classification. The model was trained on a dataset of facial expressions, with images resized to 400x400 pixels to optimize processing efficiency. This model facilitates the analyze of stress patterns during the task, revealing a marked increase in stress levels as participation approached the time limit and compared their performance against that of automated agents. By combining subjective measures of stress (PSS and NASA-TLX) with objective stress classifications from facial expressions, this study offers a comprehensive examination of stress responses in a lab-based environment driven by automated agents. The insights obtained from this research can guide the development of automated systems designed to mitigate stress and enhance human performance.
TASK DESIGN This task was designed using Microsoft Excel utilising macro and visual basics to design an automated system. One screen allowed the participant to complete the task and the second screen mimicked the task that the participant had to complete. Participant’s facial expressions and performance was recorded using a video cam. These experiments were conducted to learn the effects of automated systems on individual performance, followed by NASA-TLX and a questionnaire. perceived stress scale was used as a background measure to understand participant stress levels when participating in the study.
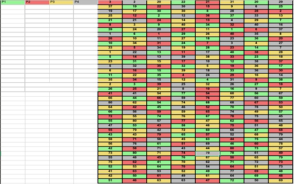
Individual Performance Measurement Task The task design employed in this study to measure individual performance under induced stress which includes time pressure, performance pressure and performance-based reward pressure (see Figure 1). 32 participants participated in the lab-based study. Each participant participated one at a time and was assigned a colour and instructed to perform their task on the assigned column. The remaining columns were assigned to three different automated agents. The performance of the automated agents was visible to each participant. The task sheet (see Figure 1) was randomly divided into blocks of four different colours, resulting in 320 blocks. Each block within a single colour category was numbered from 1 to 80, creating a set of
320 blocks in total. Participants were instructed to use the “cut” command (Ctrl+x) to remove the coloured brick assigned to them from the bundle of colours and then use the “paste” command (Ctrl+v) to place the brick in their assigned column, starting from the top and moving downward. The blocks were to be cut in ascending order, beginning with 1. The task duration was fixed at 6 minutes, during which participants were required to fill their assigned columns with as many blocks as possible within the given time frame. For instance, a participant would locate the green-coloured brick labelled ‘1’ and paste it in their P1 column.
They would then proceed to find the green-coloured brick labelled ‘2’ and continue pasting it in their column, and so on, until the time expired. Throughout the task, the participants were periodically informed about the remaining time to complete the task. Individual performance was measured by the number of blocks each participant removed within the 6-minute time limit. Participants were informed that their participation reward could increase from £10 to £20 if they outperformed the automated agents, and the highest-performing individual would receive an additional reward of £30. This setup aimed to induce performance pressure based on the potential reward. In summary, this task design involved participants performing a block-cutting and pasting task within a time-constrained environment while competing against automated agents operating at different speeds. Individual performance was evaluated based on the number of blocks removed within a 6-minute time limit.
Perceived Stress Scale The Perceived stress scale was used as a background measure to understand participant stress levels when participating in the study. The Perceived Stress Scale (Cohen S. K., 1983) is the most widely used psychological instrument for measuring the perception of stress. It measures the degree to which situations in one’s life are appraised as stressful. The PSS includes questions about feelings and thoughts during the last month. Respondents were asked how often they felt a certain way in each question. The answers are graded on a five-point Likert scale ranging from 1 (never) to 5 (often). Scores on the PSS can range from 0 to 40, with higher scores indicating higher perceived stress.
1. Scores ranging from 0–13 would be considered low stress. 2. Scores ranging from 14–26 would be considered moderate stress. 3. Scores ranging from 27–40 would be considered high perceived stress.
NASA-TLX QUESTIONS
1. How mentally demanding was the task? 2. How physically demanding was the task? 3. How successful were you in accomplishing what you were asked to do? 4. How hard did you have to work to accomplish your level of performance? 5. How insecure, discouraged, irritated, stressed, and annoyed were you?
Questionnaires
1. To what extent do you feel that time pressure at the end of the task makes you feel stressed? 2. To what extent do you become stressed while watching the performance of another automatic agent? 3. To what extent do you feel that you didn’t have enough time to compete with the agent? 4. To what extent do you feel that you had difficulty watching the other screen for the agent’s performance? 5. To what extent do you feel that this task makes you sensitive and irritable? 6. To what extent do you feel that this task makes you stressed? 7. To what extent do you believe that receiving a reward for outperforming the agents will encourage you to take the task seriously? 8. To what extent do you feel that the agents performed well in completing tasks? 9. Have you ever played or worked on a task similar to this?
METHEDOLOGY These experiments were conducted to learn the effects of automated systems on individual performance, followed by NASA-TLX and a questionnaire. perceived stress scale was used as a background measure to understand participant stress levels when participating in the study.
Participants The subject pool was made up of people from varied ethnicity and gender. A total of 32 participants were recruited through an online advertisement. Subjects who wished to participate in the study were asked to fill out a Google form containing demographic information, including name, gender, age, occupation, and ethnicity. Of the 32 participants, 13 were working professionals and 19 were students. All participants were treated ethically by the current organisation’s ethics guidelines.
Protocol The flow diagram of the experiment protocol (see Figure 2). There were 32 sessions total, each lasting about 30–40 minutes. Each participant
received an overview of the task design, an introduction to the study, and an informed consent form. The overview included a demonstration of the Google Sheets display and instructions on completing the task. Following that, the Perceived stress scale form was distributed to participants in order to assess their immediate stress levels. The task was recorded using OBS software. Participants were informed about the remaining time to induce stress during the task. After completing the task, the questionnaire and NASA-TLX forms were distributed to the participants. Each session followed the same procedure.
Figure 2: Experiment protocol.
Figure available in the original PDF paper.
RESULT
Data Processing and Feature Extraction The dataset used in this study comprises 32 participants, with 200 figures collected for each individual. Specifically, 100 frames were captured at the beginning and 100 frames near the end of the observation period for each participant. We divided the dataset into three parts: training, validation, and testing. We trained the model using 70% of the frames (4,480 frames) and used another 1,280 frames for validation. For the testing, we randomly selected 10% of the frames (640 figures across 32 participants) from the dataset and all datasets are randomly shuffled. Based on the study, cognitive load increases as tasks become more complex or as time pressure mounts, leading to increased stress and anxiety. As the cognitive demands of a task increase, the individual’s ability to cope decreases, resulting in heightened stress, especially towards the end of the task (Sweller, 1988) Time pressure is a significant stressor that impacts performance, often leading to increased stress as the task deadline approaches (Maule, 1993). Stress levels are known to increase as individuals continuously monitor their performance, especially when faced with potential failure or when nearing the end of a task (Hancock, 1989). Research has shown that facial expressions change as stress levels increase. Initially, expressions might be neutral or slightly positive, but as stress increases (due to task difficulty or time pressure), expressions may become more tense or negative (Ekman, 1997) regarding stress/non- stress labels, we labelled the initial 100 frames as NON-STRESS and the final 100 frames as STRESS. To manage computational complexity while preserving essential features, all frames were resized to 400x400 pixels. This preprocessing step ensures the balance between computational efficiency and the retention of critical visual information necessary for subsequent analysis.
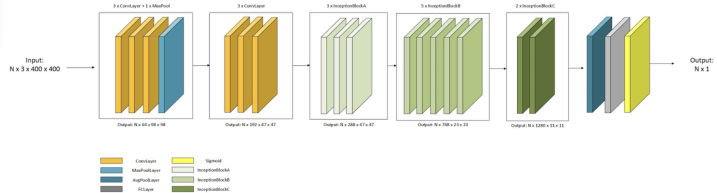
Deep Learning Technique It is a binary classification problem, so we use a V3 model (torch) in this paper, which has been applied in various binary classification applications, e.g. Railway. We loaded the Inception V3 model from the PyTorch torchvision library, utilising pre-trained weights from the ImageNet dataset. Given that the press detection task is a binary image classification problem, we modified the model’s final fully connected layer to include a linear layer followed by a Sigmoid activation function, enabling the model to output a single probability value between 0 and 1 for Class 1. The model architecture begins with several convolutional and pooling layers for initial feature extraction (Conv (3x3)→Conv (3x3)→Conv (3x3)→Max Pooling), followed by multiple Inception modules that handle feature maps through parallel paths with different-sized convolutional kernels. An auxiliary classifier, adapted for the press detection task, is integrated into the middle of the model, consisting of a linear layer and a Sigmoid activation function to provide additional gradient signals during training, aiding faster convergence and preventing gradient vanishing. At the model’s end, a global average pooling layer reduces the number of parameters by averaging all elements of each feature map, effectively summarizing the features. An illustration figure of the model (see Figure 3). The confusion matrix provides a detailed breakdown of the model’s classification performance:
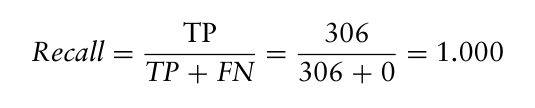
1. True Negative (TN): 306 2. False Positive (FP): 14 3. False Negative (FN): 0 4. True Positive (TP): 320 In this paper, we use following performance metrics to measure the performance of our detection model:
1. Test Accuracy: Test Accuracy measures the proportion of correctly predicted samples out of the total samples.
Equation reproduced from the original PDF.Equation reproduced from the original PDF.
2. Precision: Precision (or Positive Predictive Value) indicates the proportion of true positive predictions among all positive predictions.
3. Recall: Recall (or Sensitivity) measures the proportion of actual positives that are correctly identified.
Equation reproduced from the original PDF.
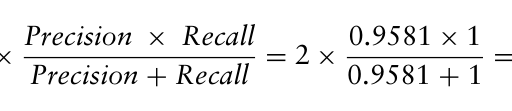
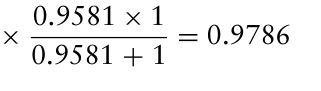
4. F1 Score: F1 Score is the harmonic mean of Precision and Recall, providing a balance between the two metrics.
Equation reproduced from the original PDF.Equation reproduced from the original PDF.Equation reproduced from the original PDF.
5. Specificity: Specificity (or True Negative Rate) measures the proportion of actual negatives that are correctly identified.
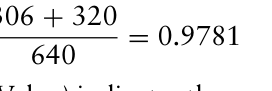
Specificity : = TN TN + FP = 306 306 + 14 = 0.9563 The trained stress classification model demonstrates strong performance across multiple evaluation metrics. It achieves an accuracy of 97.81%, indicating a high overall rate of correct predictions for both classes. The precision of the model, which measures the accuracy of positive predictions, is 95.81%. This suggests that when the model predicts an instance as positive, it is correct about 95.81% of the time. Remarkably, the model exhibits perfect recall (sensitivity) at 100%, meaning it successfully identifies all actual positive instances. The F1 score, which balances precision and recall, is 97.86%, reflecting a robust harmonic mean of the two metrics in scenarios with uneven class distribution. Finally, the specificity of the model is 95.63%, indicating a strong ability to correctly identify negative instances, further underscoring the model’s effectiveness in distinguishing between the two classes accurately.
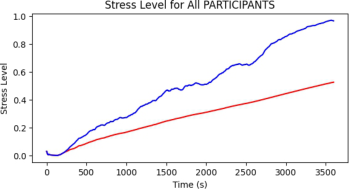
Stress Level Analysis In this section, we employed the model developed in the previous section to assess the stress levels of all participants. We begin by presenting a graphical representation of the stress trends throughout the gaming session for all participants. The red line in the graph illustrates the average stress level, calculated from the onset (0 seconds) to each subsequent time point. Meanwhile, the blue line depicts the moving average of stress levels over a 20-second horizon. (See Figure 4) reveals a gradual increase in stress levels among all participants as the game progresses. It is noticed that this analysis operates under the assumption that our model can accurately predict stress at each time point. While recognizing the challenges inherent in achieving perfect accuracy, the model demonstrated a reliability of over 97% in previous experiments. This high level of accuracy supports
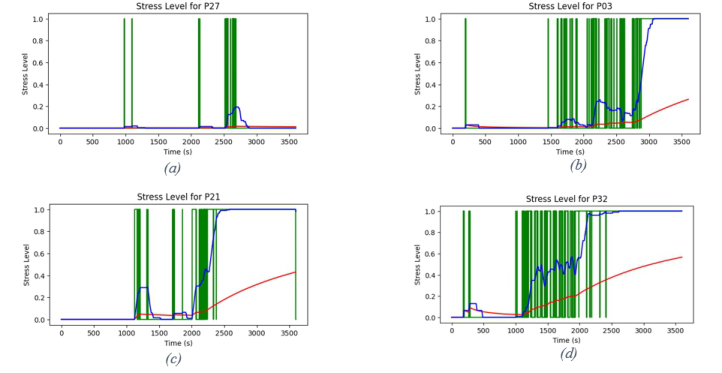
the generalizability of our results in simulating stress trends under varied conditions. At the meantime, we observe some interesting behaviours when examining certain individuals. For instance, Participant 27 remained relaxed throughout the task, (see Figure 5(a)), and according to the experimental results provided by the examiner, Participant 27’s performance was indeed above average. Additionally, several participants, such as Participants 03 (see Figure 5(b)), 21 (see Figure 5(c)), and 32 (see Figure 5(d)) exhibited a sharp increase in stress levels after receiving the reminder that 50% of the time had passed. Here, the green line represents the binary prediction results, where 0 indicates non-stressful and 1 indicates stress.
Figure 4: Stress level of all participants.Figure 5: Stress levels of some individuals.
CONCLUSION
This study demonstrated that time pressure, performance pressure, and reward-based incentives significantly amplify stress in competitive environments, particularly as participants approach deadlines and compare their performance to that of automated systems. By employing both subjective (Perceived stress scale, NASA-TLX) and Objective measure (facial expression analysis) measures of stress, the research provides valuable insights into human-automation interaction. The deep learning model’s
high accuracy in stress detection highlights its potential for real-time stress monitoring in high-stress environments. These insights can be used to design more human-centred automated systems that not only reduce stress but also improve overall performance, thereby contributing to safer and more effective human-automation collaborations.
REFERENCES
Becker, L. (2022). Physiological stress in response to multitasking and work interruptions: Study protocol. PLoS One, 17. Boy, G. A. (2023). Model-based human systems integration. In Handbook of Model-
Based Systems Engineering (pp. 471–499). Springer. Caviola, S. (2017). Stress, time pressure, strategy selection and math anxiety in mathematics: A review of the literature. Frontiers in psychology, 8, 1488. Cohen, S. a.-D. (2007). Psychological stress and disease. Jama, 298(14), 1685–1687. Cohen, S. K. (1983). Perceived Stress Scale. APA PsycTests. D’mello, S. K. (2015). A review and meta-analysis of multimodal affect detection
systems. ACM computing surveys (CSUR), 47(3), 1–36. Ekman, P. (1997). What the face reveals: Basic and applied studies of spontaneous expression using the Facial Action Coding System (FACS). Hancock, P. A. (1989). A dynamic model of stress and sustained attention. Human
factors, 31(5), 519–537. Kiecolt-Glaser, J. K. (2020). Stress reactivity: what pushes us higher, faster, and longer—and why it matters. Current directions in psychological science, 29(5), 492–498. Lucey, P. (2010). Automatically detecting pain in video through facial action units.
IEEE Transactions on Systems, Man, and Cybernetics, Part B (Cybernetics), 41(3), 664–674. Maule, A. J. (1993). State, stress, and time pressure. In Time pressure and stress in human judgment and decision making (pp. 83–101). Springer. Parasuraman, R. (2000). A model for types and levels of human interaction with
automation. IEEE Transactions on systems, man, and cybernetics-Part A: Systems and Humans, 30(3), 286–297. Picard, R. W. (2001). Toward machine emotional intelligence: Analysis of affective physiological state. IEEE transactions on pattern analysis and machine intelligence, 23(10), 1175–1191. Putwain, D. (2013). Academic self-efficacy in study-related skills and behaviours: Relations with learning-related emotions and academic success. British Journal of Educational Psychology, 83(4), 633–650. Segerstrom, S. C. (2004). Psychological stress and the human immune system: a meta-
analytic study of 30 years of inquiry. Psychological bulletin, 130(4), 601. Singh, L. (2023). The effect of automated agents on individual performance under induced stress. Stansfeld, S. (2006). Psychosocial work environment and mental health—a meta-
analytic review. Scandinavian journal of work, environment \& health, 443–462. Sweller, J. (1988). Cognitive load during problem solving: Effects on learning.
Cognitive science, 12(2), 257–285. Taris, T. W. (2006). Is there a relationship between burnout and objective performance? A critical review of 16 studies. Work \& Stress, 20(4), 316–334. Williams, J. (2018). Recognizing emotions in video using multimodal DNN feature fusion. In Proceedings of Grand Challenge and Workshop on Human Multimodal Language (Challenge-HML).
LISTED IN THE AHFE DIGITAL BOOKSTORE CATALOGUE
Explore the complete digital volume
Human Factors in Design, Engineering, and Computing
Read this individual research paper free through the original publisher, or explore the full digital proceedings book.
ISBN 978-1-964867-35-9
Explore this ISBN in the AHFE Bookstore ↗Listed in the July 2026 bookstore catalogue; search by ISBN to confirm current availability · Digital book purchase optional