Arka Dey, Sanhita Das (2023). Influence of Time Pressure on Driver’s Response Time under Stressed Conditions. In: Safety Management and Human Factors. AHFE Open Access, vol. 105, pp. 64–74. https://doi.org/10.54941/ahfe1003071
The present study attempts to understand the driver’s mental state during driving due to the imposed time pressure and prevailing traffic condition based on heart-related physiological features. A Gaussian mix model-based clustering approach was adopted in this work to classify the developed stress on three distinct levels: low, medium, and high. Further, this study applied a defuzzification methodology to transform the fuzzy representation of probability values for each sample in a crisp dataset to develop a stress index. The developed stress index is crucial for alerting the driver regarding their mental state for avoiding any risky driving behavior under stressed conditions. Finally, the current work proposed a sliding window methodology for determining the response time of the driver to any significant stress level change and investigated the characteristic of the calculated driver-specific response time which will be sensitive to driving duration based on stress level and time pressure condition.
One of the main concerns among traffic engineers in the context of global road safety and the rising rate of road accidents is human error (Highway Traffic Safety Administration & Department of Transportation, 2015), such as reduced alertness (23%), inattention (17%), excessive speed (10%), inap- propriate evasive response (13%), and internal distraction (9%) (Soehodho, 2009). Such risky driving behavior is thought to be a negative result of dri- vers’ varying mental states while operating a vehicle in both personal and professional circumstances or in the current traffic conditions, which raises serious questions among researchers about the importance of driving stress on road accidents (Lanatà et al., 2015). Researchers underlined a connection between the network topography, road geometry (Bharadwaj et al., 2021;
Influence of Time Pressure on Driver’s Response Time Under Stressed Conditions 65
Paschalidis et al., 2018), ongoing vehicular interactions (Jones et al., 2021), and stress-related erratic driving behavior like aggressive and risky driving (Matthews et al., 1998), tailgating, poor hazard detection ability (Matth- ews et al., 1998), violations (Kontogiannis, 2006), reduced gap maintenance during turning (Paschalidis et al., 2018), abrupt braking or turning (Vhaduri et al., 2014) which are the key factors contributing to the rise in road acci- dents (Qu et al., 2014; Useche et al., 2015). The researchers initially used questionnaire surveys to analyze these human factors-induced driving beha- viors, but the prevalence of self-report bias (Paschalidis et al., 2018; Wang et al., 2021) encouraged them to continue their investigation using objective methods. Human physiological indicators, particularly cardiac characteri- stics, are used as the measure for stress detection in the majority of real-time and simulator-based objective approaches (Cassani et al., 2021; Dalmeida & Masala, 2021; Koh & Lee, 2019). Additionally, the existing studies presu- med the driver’s stress levels as a function of of road geometry and traffic interaction, which comprehends a gap in the analysis outcome as it ignores the fluctuation in the stress levels even at the same network topography. Fur- thermore, there is still a dearth of research on methods for warning drivers about their mental states to reduce the likelihood of unsafe driving behavior in stressful situations. Therefore, the following objectives of the current study are designed by keeping the existing literature gaps in mind.
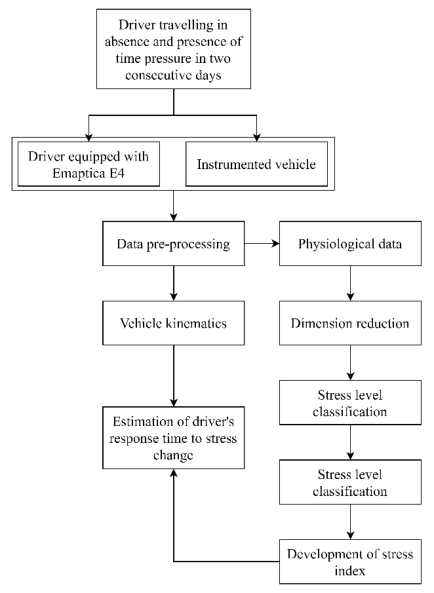
Figure 1: Schematic representation of the overall methodology adopted in the present study.
66 Dey and Das
Developing a cluster-based driver’s stress classification methodology con- sidering the physiological features under the influence of time pressure (TP) and existing traffic scenarios.
Constructing an approach for the development of a stress index which will be helpful in alerting drivers about their present mental state.
Investigating the person-specific variation of response time to stress level change in the presence and absence of time pressure (TP and NTP, respectively).
Figure 1 illustrates the thorough research methodology used in this work.
METHODS
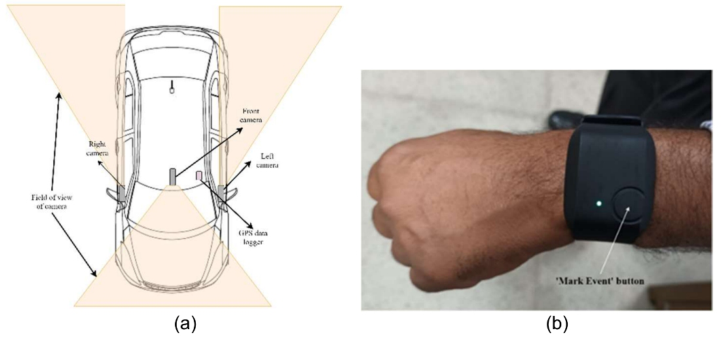
Participant Selection and Experimental Setup The subject participant for this study was a 39-year-old regular male professi- onal driver with normal blood pressure, clear eyes, and no heart or cognitive issues. The experiment was performed on a 30 km long road stretch pas- sing through different land use types, including highway, urban, and bypass sections. The selected stretch comprised of both two-lane undivided and four- lane divided road sections with different degrees of vehicular interactions. The experiment was run concurrently for two days in a row. The subject was instructed to drive through the portion without any time restrictions on the first day. However, he had to finish his driving the following day in less than 75% of the time he took on the previous day. Additionally, the driver was required to rest for an average of 25 minutes before and after each day’s experiment. To avoid any adverse effects on the driver’s mental state during his rest period, the driver was instructed about this time constraint immedi- ately following the end of his break. Further, a researcher was assigned to the driver on both days to supervise the experiment. In order to mitigate the impact of in-vehicle communication, he was under strict instructions to keep any interaction with the driver to a minimum during the experiment. More- over, the researcher was advised to record the crucial beginning and finishing times of each event, such as the starting and ending of a given highway or urban road segment, throughout the test. For this experiment, a hatchback car was chosen as the ego vehicle. It was outfitted with a video V-Box and a GPS data logger to record the vehicle’s kinematics (speed, positions, etc.). However, the driver’s heart-related physiological characteristics were moni- tored using an Empatica E4 wristband, an unobtrusive wrist-worn wearable. Figure 2 shows the instrument used in the experiment for the current study.
Data Collection and Pre-Processing A total of 8 heart rate variability (HRV)-related features, including mean time difference between two consecutive R-peaks in the QRS-curve of an electro- cardio graph (ECG) in milliseconds (mean RR), standard deviation of heart rate in beats/min (SDHR), root mean square successive difference of RR inte- rval in millisecond (RMSSD), the ratio between the number of RR intervals to the height of RR interval histogram on a scale of 1/128 s bins (RR triangu- lar index), triangular interpolation of RR interval histogram in millisecond
Influence of Time Pressure on Driver’s Response Time Under Stressed Conditions 67
Figure 2: Used instruments in the present study, (a) schematic diagram of the GPS logger attached in the instrumented vehicle, (b) Empatica E-4 wrist band.
(TINN) from time domain; total spectral power of all RR intervals up to 0.004 Hz (ms2), low frequency (0.04-0.15 Hz) to the high frequency (0.15- 0.4 Hz) ratio of the power spectral density of RR interval (LF/HF ratio) from frequency domain; and fast RR variability (SD1) to the long-term variability (SD2) of the HRV data ratio (SD2/SD1 ratio) from the non-linear domain were extracted from the collected blood volume pulse (BVP) data through Kubios software. The Hanning window (Healey & Picard, 2005) size cho- sen for this study had a length of 10s and a sliding time of 1s. To avoid any intra-personal influences on the analysis, the physiological data gathe- red throughout the driving sessions were first standardized concerning the corresponding day’s rest time. Notably, there was no difference observed in the correlation between the values of the pre and post-standardized HRV measures.
On the other hand, distance traveled, speed, and acceleration (both in late- ral and longitudinal directions) were extracted from the GPS data logger in Universal Time Co-ordinate (UTC) system, which was later converted into Indian Standard Time (IST). Due to the GPS tracker’s failure to accurately determine the ego vehicle’s position, some of the data was discovered to be missing. After re-estimating those values using the linear interpolation techni- que, the gathered dataset was smoothened using the 5-point moving average method.
Analysis Methodology The total study was carried out in three steps, beginning with a classification strategy for classifying driver stress, then a linear scale representation of the driver’s stress probabilities, and finally, an evaluation of the driver’s reaction time to a change in his stress level. All these three parts are discussed in the following sections.
68 Dey and Das
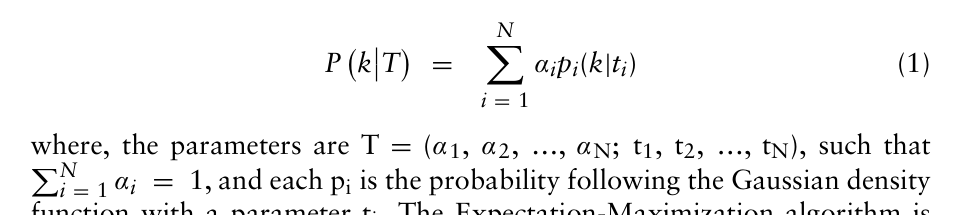
Driver’s Stress Level Classification This work used a parametric distribution-based unsupervised classification technique called Gaussian Mix Model (GMM) clustering to categorize the driver’s stress levels while taking into account various physiological variables. Equation 1 can be used to express the probability distribution function of the distribution.
Equation reproduced from the original PDF.
i = 1 αi = 1, and each pi is the probability following the Gaussian density function with a parameter ti. The Expectation-Maximization algorithm is adopted to optimize the likelihood estimation in this study for estimating the ‘T’ term.
Prior to the stress level categorization, the higher dimensional (8- dimensional) HRV characteristics were converted to a lower dimensional one using the dimension reduction method, Principal Component Analysis (PCA). In order to maximize the restored variation of the actual dataset to the mutu- ally orthogonal principal components, the Varimax rotational strategy was used in the PCA method.
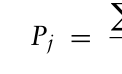
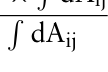
Linear Scale Representation of Driver’s Stress: Stress Index The result of the cluster modeling displays the likelihood that each sample belongs to a particular cluster level. Therefore, if the total number of esti- mated clusters is n, the classification strategy offers n number of probability values. Owing to enhanced flexibility and ease in the representation of the stress level to incorporate the same in a modeling framework, the probability values are converted to a linear scale. A defuzzification method was adopted for this purpose, where the probability values for every sample were con- sidered as the fuzzy set representation of that sample. The linear function was selected to represent the degree of membership of each sample for every cluster level. Finally, the conversion of the fuzzy dataset into a crisp one was performed by applying the centroid method. If the probability value for jth sample being in ith cluster is pij, then the converted probability value of that sample in crisp representation will be (using the centroid method) as expressed in equation 2.
R
Pn
Equation reproduced from the original PDF.Equation reproduced from the original PDF.
dAij Pn
Equation reproduced from the original PDF.
where cij is the centroid of the area under the determined probability pij value for jth sample in ith cluster (in the x-direction), dAij = pij × dx indicates a very small area portion assumed for ith cluster while estimating the crisp data representation of the jth sample, and dx is the small portion assumed in the x-direction of the membership function. The converted crisp representation of the probability value for jth sample is termed in this study as the stress index for that sample.
Influence of Time Pressure on Driver’s Response Time Under Stressed Conditions 69
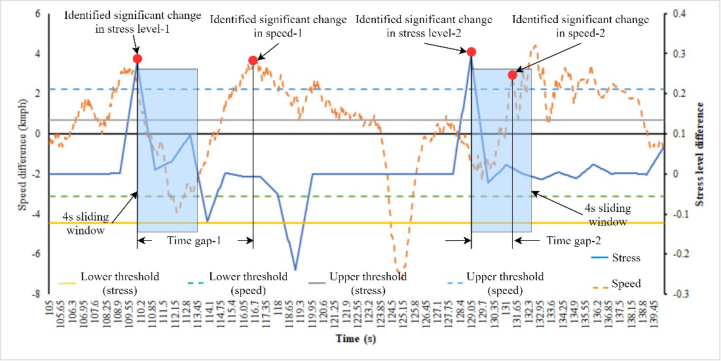
Figure 3: Estimation of response time with respect to the time gap between signifi- cant changes in stress level and speed. In this figure, time gap-1 is not considered as response time as the value is more than 4s, while time gap-2 is considered as response time.
Determination of Driver’s Response Time to Change in Stress Level Determination of the driver’s response time to any stress change was perfor- med in a two-stage method, where the notable change in the driver’s stress level was estimated initially, followed by the identification of his significant change in response (in terms of driving behavior). In this study, the change in speed was considered as the potential driver’s response to the change in his stress level. If the change in subsequent time stamp (1s interval) was more than a predetermined threshold value, the substantial change in both stress level and speed was chosen. The threshold value was calculated as the sum of the corresponding parameter’s mean and standard deviation, considering the direction of change (a different threshold value for positive and negative change in the values of stress level and speed). The response with respect to a specific stress level change was identified by sliding a window search method. The greatest observable value of the driver’s response time, accor- ding to (Paschalidis et al., 2019), was proposed to be 4s; hence the present work took it into consideration as window length. Finally, the time gap betw- een the observed speed change and the corresponding stress level change was considered as the response time of the driver to that specific change in the stress level. Figure 3 indicates the process of response time estimation in the present study.
RESULT AND DISCUSSION
Driver’s Stress Level Identification While the driver was traveling through various land use sections, the deve- loped stress level was assessed using a parametric distribution-based unsu- pervised classification strategy. Two steps were taken to complete the total
70 Dey and Das
classification: first, a dimension reduction method was used on the chosen physiological features, then a clustering strategy was applied.
The PCA methodology converted the selected 8-dimensional physiological indicators to two mutually orthogonal principal components (PC), compri- sing 69.76% and 74.84% squared loading of the actual variance of the total dataset for NTP and TP conditions, respectively. The limiting criteria for eli- minating a variable from any principal component for their diminished value in explaining the variance was 0.5 in this study. All the time domain-related features, along with total power from the frequency domain, were included in the PC-1. However, the LF to HF ratio (from the frequency domain) and SD2 to SD1 ratio (from the non-linear domain) made up the second PC.
The obtained two PCs from the PCA method were further used in the clustering-based driver’s stress level identification approach. The elbow form obtained at cluster level 3 in the presence and absence of TP suggested the optimum number cluster as 3. The developed 3-cluster stress levels were labe- led as ‘Low’, ‘Medium’, and ‘High’. This study found a negative relationship between PC values and stress levels, i.e., a decline in PC values suggested more stress. Additionally, the high-stress level of the driver was observed in the majority of the road stretches for both NTP and TP conditions; howe- ver, a comparatively lower proportion of medium and low-stress levels were obtained in TP conditions (combinedly 48% and 25% for NTP and TP con- ditions respectively). Therefore, a major inference that TP increases stress levels when driving can be made from the results obtained above.
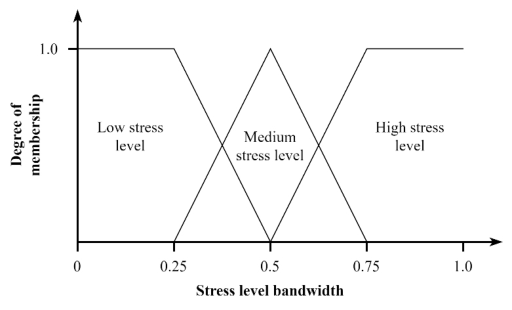
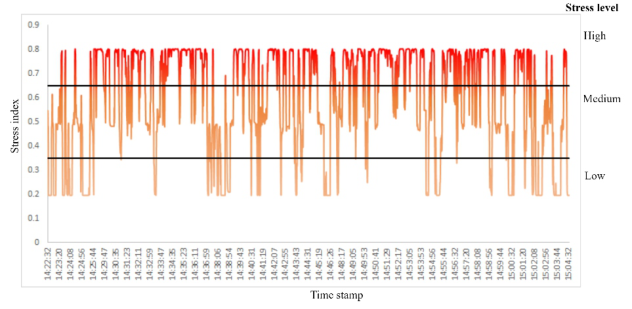
Stress Index Development For each sample of data, three separate probability values were calculated from the GMM clustering with respect to the three clusters. These probabi- lities represent the likelihood that a data point will be located at a particular cluster level. This investigation determined the final cluster level for each data point using the expectation-maximization strategy. However, the three pro- bability values for each sample are represented as the fuzzy dataset of that specific sample. A defuzzification methodology was adopted in this study to transform these probability values from a fuzzy set to a crisp set. Two types of linear membership functions were assumed for this purpose for three stress levels. A trapezoidal membership function was considered for both high and low-stress levels, while a triangular membership function was chosen for representing the medium stress level. The conversion was performed by appl- ying the centroid method of defuzzification. The crisp set values obtained from the defuzzification approach for every stress level were named as stress index and varied between a range of 0 to 1. The stress index values obtained from each sample showed a distinct separation between low-medium stress levels at 0.35 and medium-high stress levels at 0.65. Figure 4 and 5 briefly represent the assumed membership functions and the timewise distribution of the developed stress index, respectively.
Driver’s Response Time to Change in Stress Levels The driver showed a higher response time while he drove under the NTP conditions (mean = 1.28s) compared to in TP conditions (mean = 1.17s).
Influence of Time Pressure on Driver’s Response Time Under Stressed Conditions 71
Figure 4: Considered membership functions for defuzzification approach in TP and NTP conditions.Figure 5: Distribution of stress index over time under NTP conditions.
In time constraint situation, the driver was already stressed due to the pres- sure of reaching the destination in time. While under NTP conditions, the driver was free to drive at his own pace; he would be stressed only due to the change in vehicle interaction. As a result, the time difference of his change in speed for a significant variation in stress level (response time) was lower in TP compared to the NTP condition. However, this observed difference was not statistically significant. Table 1 shows the descriptive statistics of the response time to different stress level changes in both NTP and TP conditions.
The driver showed a higher response time under NTP conditions in case of stress change from medium-to-high stress level (mean = 1.33s) than from low-to-medium stress level (mean = 1.18s). On the contrary, the response time was less for a stress change from a medium-to-high level (mean = 1.18s) than that from a low-to-medium level (mean = 1.39s) in the case of the TP conditions. This behavior indicates the reduced alertness of the driver in higher stress levels in case of an inter-level stress change (low-to-medium or medium-to-high) for the NTP conditions. However, as the driver was initi- ally stressed due to the applied time limit, he increased his cautiousness under
72 Dey and Das
Table 1. Descriptive statistics (mean values with standard deviations in parenthesis) of the response time to stress level change for NTP and TP conditions.
Table available in the original PDF paper.
Change in stress level Response time (s) No Time Pressure (NTP) conditions Time Pressure (TP) conditions
the TP conditions with a lower response time for stress level change from a higher level (medium-to-high stress level compared to low-to-medium stress level).
Additionally, the driver’s response time to stress change in the same levels (intra-level stress change like medium-to-medium or high-to-high) was lower for a high-stress level (high-to-high stress level compared to medium-to- medium stress level) under NTP conditions (Table 1). In contrast, an opposite trend is observed in the case of the TP conditions, where the response time increases with the increase in stress levels (Table 1). In the intra-level stress change under NTP conditions, the driver’s cautiousness increases with the increase in stress level (from medium-to-medium to high-to-high). However, due to the presence of pre-imposed time limits, the driver’s consciousness was reduced with the increase in stress due to vehicular interaction during driving for an intra-level stress change. From the above observations, these estimated differences for both NTP and TP conditions were not statistically significant. Overall, it can be inferred that the subject driver was more cautious during an inter-level stress change than an intra-level stress change under TP conditions when he was initially at a higher stress level.
CONCLUSION
The current study tried to enlighten the impact of TP on driver stress deve- lopment along with its impact on their response nature to any significant change in mental state. Initially, the stress level of the driver was classi- fied based on the dimensionally reduced (from 8-dimension to 2-dimension) heart-related physiological features. The study revealed a positive impact of TP on developed stress levels as the proportion of higher stress level development was found more in TP than in NTP conditions. The obtained probability values (from the clustering method) of each sample were further defuzzified (by considering linear membership functions) to develop a stress index ranging from 0 to 1. Distinct segregations in three stress levels were observed at stress index values of 0.35 and 0.65 for separating the medium from low and high from medium stress levels. Finally, the driver’s response time to a significant change in stress levels was estimated by adopting a sliding window concept with a window size of 4s. The analysis outcome indica- ted that the subject driver responded quicker to stress level change in TP
Influence of Time Pressure on Driver’s Response Time Under Stressed Conditions 73
than in NTP conditions, as he was already stressed in TP conditions due to the applied time constraints. Additionally, in the TP condition, the dri- ver drove more cautiously (lower response time) when the inter-level stress change occurred from a higher initial stress state to other levels.
The present work adopted a defuzzification approach for developing a stress index which is the first step in incorporating an alerting system in vehicles to inform the drivers regarding their mental state while driving. Moreover, this index value will also be helpful in developing a micro- simulation-based approach for modeling the driver’s reaction time with respect to a traffic event in future studies. However, considering the linear membership function in the defuzzification concept is a limitation of the cur- rent work. Furthermore, inferences drawn from the analysis on the response time estimation are person-specific (depending on the driver’s demography and natural driving behavior characteristics), and they may alter with the increase in sample size and the length of the road stretch.
REFERENCES
Bharadwaj, N., Edara, P., & Sun, C. (2021). Sleep disorders and risk of traffic crashes: A naturalistic driving study analysis. Safety Science, 140. https://doi.org/10.1016/ j.ssci.2021.105295 Cassani, R., Horai, A., Gheorghe, L. A., & Falk, T. H. (2021). Predicting Driver Stress
Levels with a Sensor-Equipped Steering Wheel and a Quality-Aware Heart Rate Measurement Algorithm. Proceedings of the Annual International Conference of the IEEE Engineering in Medicine and Biology Society, EMBS, 6822–6825. https: //doi.org/10.1109/EMBC46164.2021.9630951 Dalmeida, K. M., & Masala, G. L. (2021). Hrv features as viable physiological markers for stress detection using wearable devices. Sensors, 21(8). https: //doi.org/10.3390/s21082873 Healey, J. A., & Picard, R. W. (2005). Detecting stress during real-world driving
tasks using physiological sensors. IEEE Transactions on Intelligent Transportation Systems, 6(2), 156–166. https://doi.org/10.1109/TITS.2005.848368 Highway Traffic Safety Administration, N., & Department of Transportation, U.
(2015). TRAFFIC SAFETY FACTS Crash
Stats Critical Reasons for Crashes Investigated in the National Motor Vehicle Crash Causation Survey. Jones, C., Lins Menêses, A., Askew, C., & Scott-Parker, B. (2021). The impact of courteous and discourteous drivers on physiological stress. Transportation Rese- arch Part F: Traffic Psychology and Behaviour, 82, 285–296. https://doi.org/10. 1016/j.trf.2021.08.015 Koh, D. W., & Lee, S. G. (2019). An evaluation method of safe driving for senior
adults using ECG signals. Sensors (Switzerland), 19(12). https://doi.org/10.3390/ s19122828 Kontogiannis, T. (2006). Patterns of driver stress and coping strategies in a Greek sample and their relationship to aberrant behaviors and traffic accidents. Accident Analysis and Prevention, 38(5), 913–924. https://doi.org/10.1016/j.aap.2006.03. 002 Lanatà, A., Valenza, G., Greco, A., Gentili, C., Bartolozzi, R., Bucchi, F., Frendo,
F., & Scilingo, E. P. (2015). How the Autonomic nervous system and driving style change with incremental stressing conditions during simulated driving. IEEE Transactions on Intelligent Transportation Systems, 16(3), 1505–1517. https: //doi.org/10.1109/TITS.2014.2365681
74 Dey and Das
Matthews, G., Dorn, L., Hoyes, T. W., Roy Davies, D., Ian Glendon, A., & Taylor, R. G. (1998). Driver Stress and Performance on a Driving Simulator. Paschalidis, E., Choudhury, C. F., & Hess, S. (2018). Modelling the effects of stress
on gap-acceptance decisions combining data from driving simulator and physiolo- gical sensors. Transportation Research Part F: Traffic Psychology and Behaviour, 59, 418–435. https://doi.org/10.1016/j.trf.2018.09.019 Paschalidis, E., Choudhury, C. F., & Hess, S. (2019). Combining driving simulator and physiological sensor data in a latent variable model to incorporate the effect of stress in car-following behaviour. Analytic Methods in Accident Research, 22, 100089. https://doi.org/10.1016/J. AMAR.2019.02.001 Qu, W., Ge, Y., Jiang, C., Du, F., & Zhang, K. (2014). The Dula Dangerous Driving
Index in China: An investigation of reliability and validity. Accident Analysis and Prevention, 64, 62–68. https://doi.org/10.1016/j.aap.2013.11.004 Soehodho, S. (2009). ROAD ACCIDENTS IN INDONESIA. IATSS Research, 33(2), 122–124. https://doi.org/10.1016/S0386-1112(14)60250-8 Useche, S., Serge, A., & Alonso, F. (2015). Risky behaviors and stress indicators
between novice and experienced drivers. American Journal of Applied Psychology, 3(1), 11–14. https://doi.org/10.12691/ajap-3-1-3 Vhaduri, S., Ali, A., Sharmin, M., Hovsepian, K., & Kumar, S. (2014, September 17). Estimating drivers’ stress from GPS traces. AutomotiveUI 2014 - 6th International Conference on Automotive User Interfaces and Interactive Veh- icular Applications, in Cooperation with ACM SIGCHI - Proceedings. https: //doi.org/10.1145/2667317.2667335 Wang, J., Chai, W., Venkatachalapathy, A., Tan, K. L., Haghighat, A., Velipasalar,
S., Adu-Gyamfi, Y., & Sharma, A. (2021). A Survey on Driver Behavior Analy- sis From In-Vehicle Cameras. IEEE Transactions on Intelligent Transportation Systems, 1–24. https://doi.org/10.1109/tits.2021.3126231
LISTED IN THE AHFE DIGITAL BOOKSTORE CATALOGUE
Explore the complete digital volume
Safety Management and Human Factors
Read this individual research paper free through the original publisher, or explore the full digital proceedings book.
ISBN 978-1-958651-81-0
Explore this ISBN in the AHFE Bookstore ↗Listed in the July 2026 bookstore catalogue; search by ISBN to confirm current availability · Digital book purchase optional