Tim Hulshof, Mila Chorbadzhieva, Reon Smits, Erwin Meinders (2024). Improvements in stress-detection technology to improve the quality-of-life of people with challenging behaviour. In: Human Factors in Design, Engineering, and Computing. AHFE Open Access, vol. 159, pp. 1341–1350. https://doi.org/10.54941/ahfe1005701
In this paper we present two improvements to the ongoing development of a sock garment with integrated sensors for the monitoring of physiological signals. These signals are used for stress detection in people with intellectual disabilities and dementia in a long-term care (LTC) setting. The improvements discussed in this paper are both aimed at improving the quality of the measurements and improving the quality of care, especially in the context of challenging behaviour. In this paper we briefly present the following two improvements:1.A new electrode configuration that allows for predictive maintenance of the garment-part of the system.2.A new user interface, particularly an online dashboard, providing a tool set aligned with the needs of behavioural scientists.
People with intellectual disabilities (ID) often encounter challenges in effectively communicating their emotional states, including stress levels [Smith et al., 2020]. Stress has been identified as a significant detrimental factor to their overall wellbeing, as it is associated with depression, negative attribution styles, and avoidant coping strategies [Hartley and MacLean, 2009; Scott and Havercamp, 2014]. Moreover, stress and difficulties in communicating this are often associated with challenging behaviour. This can cause harm to the affected individuals [Gur, 2018; Emerson, 2001; Bowring, 2017], and reduce their mental health and wellbeing [Bowring et al., 2019]. People with dementia have similar difficulties and challenges [van Kooten et al., 2017]. Both populations are particularly susceptible to stress due to various factors, including difficulties in understanding and
processing information, social interactions, and sensory sensitivities [Janssen et al., 2002, Doodeman et al., 2014].
Traditional methods of assessing stress in individuals with ID and dementia heavily rely on subjective observations and caregiver reports, which may not always accurately reflect the individual’s internal state [Bramston and Fogarty, 2000]. However, recent advancements in technology offer promising avenues for more objective and reliable stress assessment.
Changes in stress and arousal levels can be effectively monitored through various physiological signals, with two prominent indicators being Electrodermal Activity (EDA) and Heart Rate Variability (HRV). EDA reflects sympathetic nervous system activity and is highly sensitive to emotional arousal [Boucsein, 2012], while HRV provides insights into autonomic nervous system regulation and emotional regulation processes [Ziegler, 2012]. Wearable sensors have proven to be a reliable method to measure the physiological signals of stress in real time, especially EDA and HRV [Alberdi et al., 2016].
The HUME system is specifically designed for this purpose, with persons with ID and dementia in mind: the sensors are not placed in a wrist-band – the most common wearable design – but are integrated in a sock, so that the sensors can be worn unobtrusively, comfortably, and invisibly, in a garment that most people in the target user groups are already familiar with. Integration in a sock has the added benefit that the soles of the feet are considered better measurement sites than wrists for EDA [Boucsein, 2012]. The sock form factor has been validated in various studies, e.g., [Kappeler- Setz et al., 2013, Fortes Ferreira et al., 2022, Korving et al., 2022, Leborgne et al., 2023].
The effectiveness of the HUME system as an assistive tool for stress monitoring has been corroborated through a series of validation studies. Both laboratory experiments and real-world observational studies have demonstrated that the system can detect stress-related physiological changes with a weighted average precision of over 80% [de Vries et al., 2022; van der Nulft et al., 2023; Hesselmans et al., 2023], which is on par with comparable research designs in the scientific literature [Taylor et al., 2017]. However, these studies have also highlighted areas for improvement, including signal quality optimization and refinement of behavioural analytics interfaces: Signal noise is one of the most challenging aspects of stress detection via wearables, especially for EDA measurements [Posada-Quintero and Chon, 2020]. Various things can cause signal noise, from poor contact between the sensor and skin, movements of the wearer, atmospheric changes, and interference from nearby electrical appliances. Most wearables come equipped with a variety of different methods to combat this signal noise, including additional sensors such as accelerometers and thermometers, and specially designed machine learning algorithms [Matton et al., 2023].
Improvements in Stress-Detection Technology to Improve the Quality-of-Life of People 1343
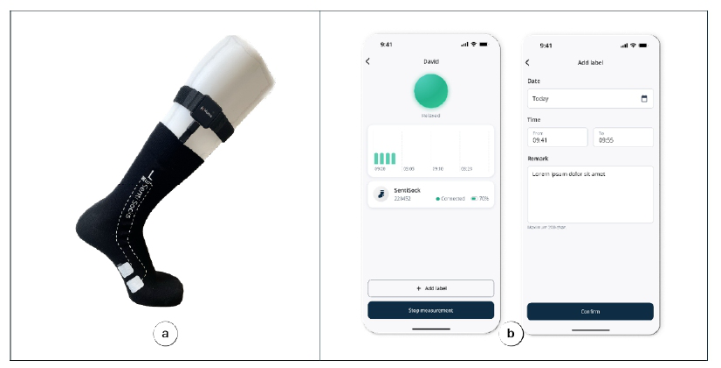
Figure 1: (a) A HUME system sock with integrated EDA sensor. EDA measurements are taken at the white electrodes at the foot sole and processed and transmitted from the processor unit at calf-height. (b) The HUME mobile app, with screens for real time monitoring of stress predictions (left) and event labelling functionality (right).
This paper presents two key innovations in stress monitoring for individuals with intellectual disabilities or dementia. Firstly, the paper discusses a recent hardware improvement aimed at enhancing signal quality: A 4-electrode configuration designed to facilitate predictive maintenance of the socks, preventing unnecessary down-time of the system.
The second improvement is algorithmic: Translating observational data about a topic as multi-faceted as stress predictions is a challenging task. Many care facilities employ behavioural scientists with specialist training to give an in-depth analysis of client behaviour, with the aim of identifying triggers for stress and the moments of severe psychological distress that many individuals with ID regularly experience [Bramston and Fogarty, 2000]. To assist in their process, another improvement to the HUME system discussed in this paper is a new analytics tool, the myHUME dashboard, which, together with the HUME mobile app provides a collection of tools and a workflow that is specifically tailored to behavioural analysis. The dashboard provides behavioural scientists with a set of tools to identify causal connections to measured stress signals, facilitating more comprehensive assessments of stress dynamics in individuals with ID.
A 4-Contact Configuration to Detect Degradation of the EDA Sensor Background and motivation. EDA sensors measure the electrical conductance of the skin, which is influenced by sweat gland activity (see [Boucsein 2012] for a comprehensive overview). A typical EDA sensor has two electrodes that are placed on the skin, often on the fingers, hand palms, or feet soles. These electrodes measure the electrical properties of the skin. When a person experiences emotional or physiological arousal, such as stress or excitement, the activity of the sweat glands increases in these areas, leading to localised changes in skin conductance.
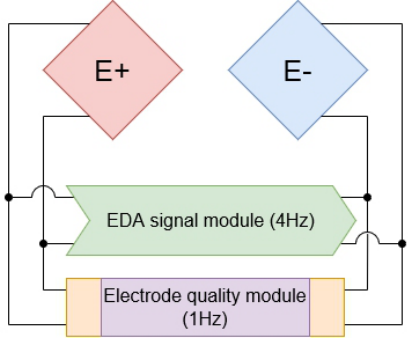
Figure 2: A schematic of the four-contact configuration: In the normal operating procedure, both leads to the contact pads are used simultaneously as the signal carrier. An excitation signal of 4 Hz with an amplitude of 3.3V peak to peak is applied to one of the two electrodes, and the EDA signal module measures the signal. The electrode quality module simultaneously measures the resistance across the two connectors of each of the electrodes. These measurements are performed in isolation for both electrodes. The quality module operates at 1Hz, out of phase with the first signal. This allows for continuous monitoring of both signal and signal quality.
The HUME system has the EDA sensor integrated into an ordinary cotton sock (see Figure 1(a)). This is achieved by screen-printing flexible electrodes and attaching these to the inside of the sock. As these socks are worn and washed, the screen-printed sensor wears down, however, and the resistance gradually but randomly increases. Given that higher resistance corresponds to lower current flow, and since EDA is a measurement of current flows, it becomes increasingly difficult to analyse the EDA signal for signs of stress or arousal, as the electrode wears down. Therefore, it is important to detect degradation of the electrodes before the signal quality drops below the quality threshold.
Description. A predictive maintenance design was implemented. Instead of using only the two (primary) electrodes, two secondary electrodes were included which connect to the same contact patches, creating a circuit around each electrode that is specifically intended to measure the degradation of the primary electrodes.
The EDA measurement circuit (see Figure 2) can measure both skin conductance and primary electrode conductance. Further details about the schematics are given in the next section and Figure 3 below.
When the signal quality falls below a predetermined threshold, the caregiver operating the HUME system receives an automated notification on the HUME mobile app that the sock needs to be replaced soon.
An Analytics Toolkit for Behavioural Scientists Background and motivation. Behavioural analysis of individuals with disabilities and individuals with dementia provides a valuable tool for
Improvements in Stress-Detection Technology to Improve the Quality-of-Life of People 1345
improving their quality of life, particularly in context of long-term care [Hapogian and Jennett, 2008, Aggio et al., 2018]. Understanding stress dynamics over time can aid in this process. It not only aids in identifying longer-term patterns but may also help design and measure the efficacy of interventions and treatments [Buchanan et al., 2011]. However, the existing process of analysing stress predictions often proves cumbersome for behavioural scientists, requiring significant time and effort with disparate tools and non-standardized methods.
To streamline and standardize this analytics process, an online dashboard was developed for the HUME system. This dashboard aggregates data gathered by measurement and observations from caregivers and behavioural scientists. It offers data manipulation and visualization features, tailored to the workflow of behavioural scientists. The aim of these features is to reduce their workload and enhance the reliability of their analyses, and the reproducibility of their workflow.
Description. Systems measuring physiological responses to external events produce complex data that contain both numerical data (e.g., stress prediction probabilities, heart rates) and categorical data (e.g., written observations from caregivers about events, day-of-the-week, holidays). While the numerical data is constrained by the device’s capabilities for measurement, the categorical data is typically much less structured, and typically includes ad-hoc text-based data generated by the caregiver or behavioural scientist. Categorical data is then often associated with the numerical data at a particular moment or interval of time as labels. These systems thus produce labelled time sequence data. This kind of data is notoriously difficult to visualize and analyse, and much research has been devoted to best practices for this, especially in the setting of healthcare [van der Linden et al., 2022, Magallanes et al., 2021, Gotz and Stavropoulos, 2014]. One significant difficulty with visualising labelled data lies in effectively displaying the sequential nature of the data while also conveying the associated labels accurately. Traditional visualization techniques like line plots or scatter plots may struggle to capture both the temporal aspect and the categorical labels simultaneously, leading to cluttered or ambiguous visualizations. Additionally, maintaining the readability and interpretability of the visualization becomes challenging as the length of the time sequence increases or as the number of unique labels grows. Ensuring that the visual representation effectively communicates patterns, trends, and relationships within the data while preserving the temporal and categorical information requires careful design and consideration of visualization techniques tailored to the specific characteristics of labelled time sequence data.
Methodology. The myHUME dashboard was designed according to established design principles for temporal event visualisation and its development was guided by the principles of the Design Thinking methodology [Auernhammer & Roth, 2021]. This is a human-centred approach to problem-solving and innovation which involves five main phases: empathising with users to understand their needs and challenges, defining the problem, ideating potential solutions, prototyping and testing
those solutions, and iterating based on feedback. Following this method, product adjustments unfold iteratively. This ongoing process facilitates continuous creation and enhancement of the myHUME dashboard, closely involving the end users.
To identify end user needs and challenges, research questions were defined to gain insights into how behavioural scientists approach and carry out their analyses in practice; how they interact with data; what specific requirements they might have for the development of a web dashboard; and which time periods hold significance within the context of care and determining the level of granularity required in the data. Semi-structured interviews with behavioural scientists and internal stakeholders were conducted based on these questions. Necessary parameters to control data granularity were discussed, such as the utilisation of temporal divisions (e.g., weekdays and weekends, hourly breakdowns) to derive meaningful insights. Understanding the various analysis approaches was important to determine optimal features and default presets for the dashboard that could streamline the analysis process.
Data visualisation. The outcome of this process was a design that closely follows the desired workflow of the behavioural scientists, and automatically generates the graphs and statistics that are most relevant for their research purposes. A key requirement that was identified in the interviews was the possibility to perform exploratory investigations of the data, and to be able to view the labelled data in a graphical format, rather than only as a list of labels and statistics. Scatterplots and line plots were deemed to be too difficult to interpret, and kernel density estimation plots to exhibit a too high variance in shape as a function of the parametrisation, relative to the underlying dataset. The choice was made to represent the data as rescaled histograms, showing the relative percentages of predicted stress per time interval. The histogram bin sizes were chosen to represent the relevant minimal time intervals and can be chosen by the user (e.g., quarter, half an hour, hour, day). To aid the user and to avoid limitations on the data, the system automatically selects an appropriate bin size, and the user is restricted from choosing a bin size that is so small that it would result in too noisy histograms, following established heuristics for this [Zdraveski et al., 2015].
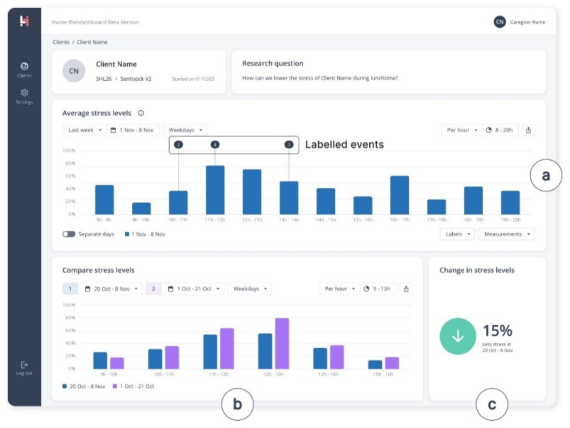
Evaluation. One of the central outcomes of this investigation was the inclusion of dynamic labelled histograms in the dashboard. Prior to the development of the web dashboard, a HUME mobile app was created tailored for caregivers (see Figure 1(b)). Its primary function is to provide real-time updates on clients’ stress levels, aiding caregivers in making informed decisions. Additionally, caregivers can label events, providing context to the historical stress data accessible to behavioural scientists via the web dashboard. Initially, these annotations were available as separate text files. To streamline the analysis process and help behavioural scientists uncover patterns and meaningful insights from the stress data, the labelled events are now applied directly in the histograms of the web dashboard (see Figure 4(a)).
Improvements in Stress-Detection Technology to Improve the Quality-of-Life of People 1347
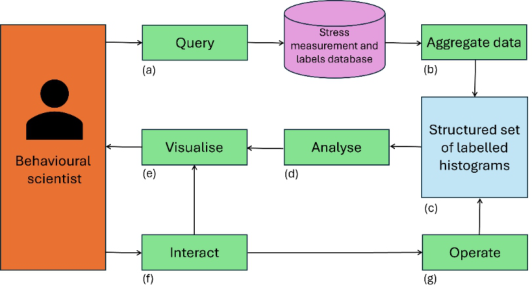
Figure 3: Behavioural scientists using the myHUME dashboard first (a) make a query on the database of stress measurements and labels using a simple GUI (e.g., select a person, period(s), type of labels). The dashboard then (b) aggregates this data into a set of (c) structured and labelled histograms. These histograms are then used to extract various statistics and (e) visualised. (f) The behavioural scientist can interact with the data for exploratory analysis, or (g) interact with the data at histogram level, which triggers reanalysis of the histograms. (After [Gotz and Stavropoulos, 2014]).Figure 4: A screenshot of the myHUME dashboard: (a) a dynamic histogram showing the average stress levels of a client for a custom period with labelled events (submitted through the mobile app), (b) a pair of histograms to compare two different periods, and (c) a dynamic display of the change in stress levels between the periods selected in (b).
These histograms aggregate on-line stress predictions over the desired timescale, and show the relative locations of labelled events, providing researchers with a simple but comprehensive overview of stress patterns and their possible triggers. By dynamically adjusting to different time scales (e.g., a day, a week, or a year), these histograms offer flexibility in exploring
stress dynamics that are often central to their research questions. This enables researchers to delve deeper into temporal trends and cycles.
Another notable addition is the ability to compare stress levels over different time periods (see Figure 4(b)). This feature allows researchers to assess the impact of interventions or external factors on stress patterns systematically. By facilitating direct comparisons, it enhances the researchers’ ability to discern meaningful insights from the data, aiding in hypothesis testing and decision-making.
CONCLUSION
This study reports on two improvements to wearable stress-detection technology that have been made with people with ID and dementia in mind: (a) predictive maintenance feature on the wearable sensors, and (b) an analytics environment specifically designed for behavioural scientists working with the target groups.
ACKNOWLEDGMENT
The authors would like to thank Maya Gencheva for her contributions to the sensor development. MC would like to thank Y. Blok, I. v. Hees, L. Makkenze, K. Rosbender, and S. Tonjann for their participation in the interviews that were used as input for the design of the myHUME dashboard.
REFERENCES
Aggio, Natalia M., Mariana Ducatti, and Júlio C. de Rose. “Cognition and language in dementia patients: Contributions from behavior analysis.” Behavioral Interventions 33.3 (2018): 322–335. Alberdi A, Aztiria A and Basarab A (2016) Towards an automatic early stress
recognition system for office environments based on multimodal measurements: A review. Journal of biomedical informatics 59: 49–75. Auernhammer, Jan, and Bernard Roth. “The origin and evolution of Stanford University’s design thinking: From product design to design thinking in innovation management.”Journal of Product Innovation Management 38.6 (2021): 623–644. Boucsein, Wolfram. Electrodermal activity. Springer Science & Business Media,
2012. Bowring, Darren L., et al. “Challenging behaviours in adults with an intellectual disability: A total population study and exploration of risk indices.” British Journal of Clinical Psychology 56.1 (2017): 16–32. Bowring DL, Painter J and Hastings RP (2019) Prevalence of Challenging Behaviour
in Adults with Intellectual Disabilities, Correlates, and Association with Mental Health. Current Developmental Disorders Reports 6(4): 173–181. Bramston P and Fogarty G (2000) The assessment of emotional distress experienced by people with an intellectual disability: A study of different methodologies. Research in developmental disabilities 21(6): 487–500. Buchanan, Jeffrey A., et al. “The role of behavior analysis in the rehabilitation of
persons with dementia.” Behavior therapy 42.1 (2011): 9–21.
Improvements in Stress-Detection Technology to Improve the Quality-of-Life of People 1349
De Vries S, Smits R, Ronckers, M van der Pol M, van Oost F, Adam E, Smaling H, Meinders E (2022) Accurate stress detection from novel real-time electrodermal activity signals and multi-task learning models, Cognitive Computing and Internet of Things, Vol. 43, 2022, 111–117. Doodeman, Tanja WM, Carlo Schuengel, and Paula S. Sterkenburg. “Expressions
of stress of people with severe intellectual disabilities and sensitive caregiving to regulate stress: A qualitative study.” Journal of Intellectual & Developmental Disability 47.4 (2022): 308–317. Emerson E (2001) Challenging behaviour: Analysis and intervention in people with severe intellectual disabilities. Cambridge, UK: Cambridge University Press. Ferreira, Afonso Fortes, et al. “Feasibility of Electrodermal Activity and Photoplethysmography Data Acquisition at the Foot Using a Sock Form Factor.” Sensors 23.2 (2023): 620. Gotz, David, and Harry Stavropoulos. “Decisionflow: Visual analytics for high-
dimensional temporal event sequence data.” IEEE transactions on visualization and computer graphics 20.12 (2014): 1783–1792. Greco, Alberto, et al. “Skin admittance measurement for emotion recognition: A study over frequency sweep.” Electronics 5.3 (2016): 46. Gur A (2018) Challenging behavior, functioning difficulties, and quality of life
of adults with intellectual disabilities. International Journal of Developmental Disabilities 64(1): 45–52. Hagopian, Louis P., and Heather K. Jennett. “Behavioral assessment and treatment of anxiety in individuals with intellectual disabilities and autism.” Journal of Developmental and Physical Disabilities 20 (2008): 467–483. Hartley, Sigan L., and William E. MacLean Jr. “Depression in adults with mild
intellectual disability: Role of stress, attributions, and coping.” American Journal on Intellectual and Developmental Disabilities 114.3 (2009): 147–160. Havercamp, Susan M., and Haleigh M. Scott. “National health surveillance of adults with disabilities, adults with intellectual and developmental disabilities, and adults with no disabilities.” Disability and health journal 8.2 (2015): 165–172. Hesselmans, Sep, et al. “Effect of stress-based interventions on the quality of life of
people with an intellectual disability and their caregivers.” (2023): 1–9. Janssen, C. G. C., C. Schuengel, and J. Stolk. “Understanding challenging behaviour in people with severe and profound intellectual disability: a stress-attachment model.” Journal of Intellectual Disability Research 46.6 (2002): 445–453. Kappeler-Setz, Cornelia, et al. “Towards long term monitoring of electrodermal
activity in daily life.” Personal and ubiquitous computing 17 (2013): 261–271. Korving, Helen, et al. “Development of an AI-enabled system for pain monitoring using skin conductance sensoring in socks.” International journal of neural systems 32.10 (2022): 2250047. Leborgne, François, et al. “The development of a washable and durable smart textile
to measure electrodermal activity for early stress recognition.” Intelligent Human Systems Integration (IHSI 2023): Integrating People and Intelligent Systems 69.69 (2023). Magallanes, Jessica, et al. “Sequen-c: A multilevel overview of temporal event sequences.” IEEE Transactions on Visualization and Computer Graphics 28.1 (2021): 901–911. Martinsen, Ø. G., S. Grimnes, and O. Sveen. “Dielectric properties of some
keratinised tissues. Part 1: Stratum corneum and nail in situ.” Medical and Biological Engineering and Computing 35 (1997): 172–176.
Matton, Katie, et al. “Contrastive Learning of Electrodermal Activity Representations for Stress Detection.” Conference on Health, Inference, and Learning. PMLR, 2023. Pabst, Oliver, et al. “Comparison between the AC and DC measurement of electrodermal activity.” Psychophysiology 54.3 (2017): 374–385. Posada-Quintero, Hugo F., and Ki H. Chon. “Innovations in electrodermal activity
data collection and signal processing: A systematic review.” Sensors 20.2 (2020): 479. Smith M, Manduchi B, Burke É, et al. (2020) Communication difficulties in adults with Intellectual Disability: Results from a national cross-sectional study. Research in developmental disabilities 97: 103557. Taylor, Sara, et al. “Personalized multitask learning for predicting tomorrow’s mood,
stress, and health.” IEEE Transactions on Affective Computing 11.2 (2017): 200–213. van der Linden, Sanne, et al. “A survey of visualization techniques for comparing event sequences.” Computers & Graphics (2023). Van Der Nulft, Vera, et al. “Impact of Real-Time Stress Monitoring in People With
an Intellectual Disability.” Cognitive Computing and Internet of Things 73.73 (2023). van Kooten, Janine, et al. “Pain, Neuropsychiatric Symptoms, and Quality of Life of Nursing Home Residents With Advanced Dementia in The Netherlands.” Alzheimer Disease & Associated Disorders 31.4 (2017): 315–321. Zdravevski, Eftim, et al. “Robust histogram-based feature engineering of time series
data.” 2015 Federated Conference on Computer Science and Information Systems (FedCSIS). IEEE, 2015. Ziegler MG (2012) Psychological stress and the autonomic nervous system. Primer on the autonomic nervous system. Elsevier, pp. 291–293.
LISTED IN THE AHFE DIGITAL BOOKSTORE CATALOGUE
Explore the complete digital volume
Human Factors in Design, Engineering, and Computing
Read this individual research paper free through the original publisher, or explore the full digital proceedings book.
ISBN 978-1-964867-35-9
Explore this ISBN in the AHFE Bookstore ↗Listed in the July 2026 bookstore catalogue; search by ISBN to confirm current availability · Digital book purchase optional