Yaxuan Xu, Yuxuan Tian, Yun Chen (2024). Exploring the subjective response of keyboard key sounds on individuals' and susceptibility to interference and sensitivity to noise. In: Ergonomics In Design. AHFE Open Access, vol. 129, pp. 96–106. https://doi.org/10.54941/ahfe1004815
This study, rooted in the discipline of human factors engineering, endeavors to investigate the threshold of decibel variance in tolerable interference across diverse activity states by scrutinizing individual subjective responses to keyboard keystroke sounds. The overarching goal is to furnish a more human-centered framework for keyboard design.Study One undertakes a meticulous analysis of 321 questionnaires and 66 noise sensitivity scales, revealing a noteworthy positive correlation between individuals' susceptibility to interference and their sensitivity to noise. The broad spectrum of individuals exhibiting heightened noise sensitivity validates the generalizability of the experimental findings, thereby reinforcing the significance of the research endeavor.Study Two adopts a multifaceted approach involving a first-round controlled experiment and randomized controlled trials encompassing 52 subjects, alongside a subsequent round of scenario simulation tests involving 18 subjects. This comprehensive methodology is employed to assess the impact of varied activity states and keyboard decibel levels on individual susceptibility to interference. Data processing and statistical analysis employ advanced techniques such as fuzzy mathematics and rank-scale methods. Utilizing a stepwise estimation methodology, the study delineates the thresholds of decibel variance in interference tolerance across distinct states: 59.98 dBA for highly concentrated states, 60.79 dBA for moderately concentrated states, 62.91 dBA for lightly concentrated states, and 59.61 dBA for sleep states.Study Three further validates the findings through rigorous Ridit analysis, affirming the reliability of the data provided and positioning it as a valuable reference for pertinent domains.Furthermore, the research findings exhibit a high level of reliability and applicability. These results pave the way for further exploration of additional factors impacting keyboard design, thereby broadening the research domain and enhancing both user experience and health perception. Consequently, this study offers a solid foundation for practical design and management decisions. In conclusion, this study not only addresses theoretical gaps in relevant fields but also provides valuable reference points for keyboard design in practical applications, underscoring its promising prospects and potential for real-world impact.
Exploring the Subjective Response of Keyboard Key Sounds 97
INTRODUCTION
At present, physical environmental pollution is becoming more and more common, and the threat of noise pollution to the well-being and public health of urban residents is increasing (Ising and Kruppa, 2004). The impact of a sound environment on human health has become a growing concern around the world (Tong, 2022). According to the World Health Organiza- tion (WHO), exposure to noise levels above 24 dB for more than 70 hours may impair human hearing sensitivity, causing adverse health effects (Qingg, 2016) and long-term exposure to noise can lead to hearing loss (Parsons, 2000). Existing surveys of noise in open work environments in China show that noise is a significant impact and is one of the most annoying sounds (Parsons, 2000).
We analyzed the current research hotspots in the field of keyboards, and found that most of the studies focused on the user experience of keyboard users and the structure of the keyboard itself, the former focusing on the psy- chological and physiological aspects of user comfort, posture, muscle activity, and trauma (Catherine, 2004), and the latter focusing on the structure and key layout of the keyboard (Hugh, 2009), and the comprehensive research of the two is the impact of keyboard design on users, such as the impact of key spacing on typing results (Pereira, 2013) and the impact of keyboard design on typing activities (Sauter, 1997) and so on. Through keyword search, it was found that it is currently classified as external noise with ventilation systems and office equipment (Mei, 2012), and the research environment has strong limitations.
In this paper, control and control experiments are set up by using ques- tionnaires, explanatory mathematical statistics, fuzzy language sets, etc., to obtain the decibel difference threshold that people in different activity states can not be disturbed. The results are helpful for the R&D side to carry out more reasonable design, and the management strategy to better formulate and implement, and provide a basis for creating a better sound environment.
EXPERIMENTAL DESIGN In order to explore the impact of different keyboards on people with differ- ent activity states in real use scenarios, this paper selects 17 commonly used keyboards for experiments. The experiment consisted of three steps: ques- tionnaire design and distribution, recruitment of experimenters, experimental equipment and environmental testing, the first round of experimental control experiments and randomized controlled trials for a total of five days, and the second round of scenario simulation experiments after the authenticity test of the first round of experimental data. Finally, the data is processed and analyzed, conclusions are drawn and recommendations are made for future keyboard design.
Questionnaire Design A comprehensive questionnaire was distributed before the experiment to col- lect information such as how users feel when using the keyboard as a user
and the degree of interference when they are disrupted. The collected ques- tionnaire data will be quantitatively analyzed. Using statistical software such as SPSS, we will analyze and synthesize the data to obtain objective data and quantitative results on the perception and impact of keyboard key sounds.
Questionnaire Recovery A total of 350 questionnaires were distributed and 321 were recovered, with a recovery rate of 91.71%. 90 copies of the noise susceptibility scale were distributed and 66 copies were recovered, with a recovery rate of 73.33%. The reliability coefficient value was 0.722, which was greater than 0.7, indi- cating that the data reliability quality was very good, and the KMO value was 0.722, ranging from 0.7 ∼0.8, indicating that the data was suitable for information extraction.
Table 1. Cronbach’s reliability analysis.
Table available in the original PDF paper.
Cronbach’s Reliability Analysis
Number of Items Sample Size Cronbach’s Alpha Coefficient
22 66 0.722
Table 2. KMO and Bartlett’s test.
Table available in the original PDF paper.
KMO and Bartlett’s Test KMO Value 0.722
Bartlett test of sphericity Approximate chi-square 2405.467 df 231 p-value 0
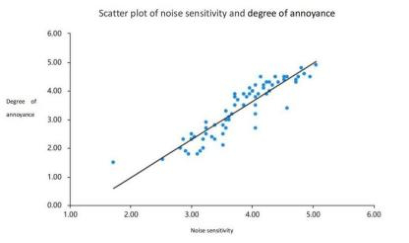
Questionnaire Analysis The questionnaire was linearly fitted to the parts of the noise sensitivity scale, and the formula was: disturbance degree = −1.686 + 1.329 * noise sen- sitivity, and the R square value was 0.833. There is a significant positive correlation between the degree of nuisance and noise sensitivity.
Figure 1: Scatter plot of noise sensitivity and annoyance levels.
Exploring the Subjective Response of Keyboard Key Sounds 99
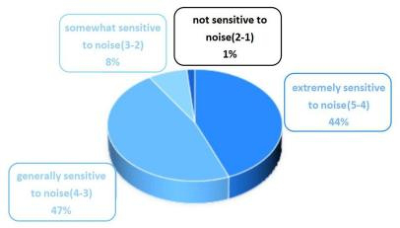
It was found that 99% of people have varying degrees of sensitivity to noise. In addition, most people are more sensitive to noise and have a high sensitivity, which verifies the necessity of the experiment.
Figure 2: Noise sensitivity ratio analysis.
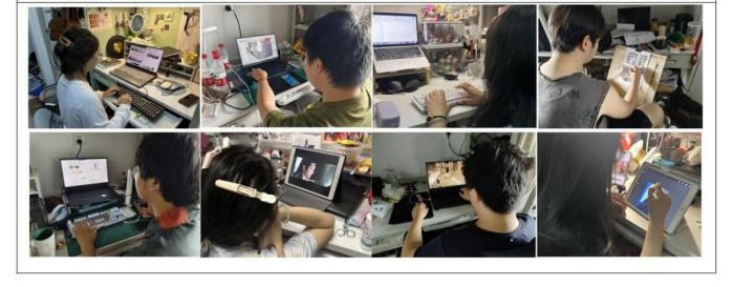
Experimental Methods and Procedures Control experimental methods. Each team was asked to test five keyboards with different decibel levels over a five-day period. Administrators are to record the level of keyboard and time period of use, and subjects are to be able to live a normal life and record the current activity and degree of interference when they perceive key sounds.
Figure 3: Controlled and randomized controlled trial records.
Randomized controlled trial methods. The control group was randomly issued with a record sheet and compared with the data of the control experiment to verify the rationality of the control experiment.
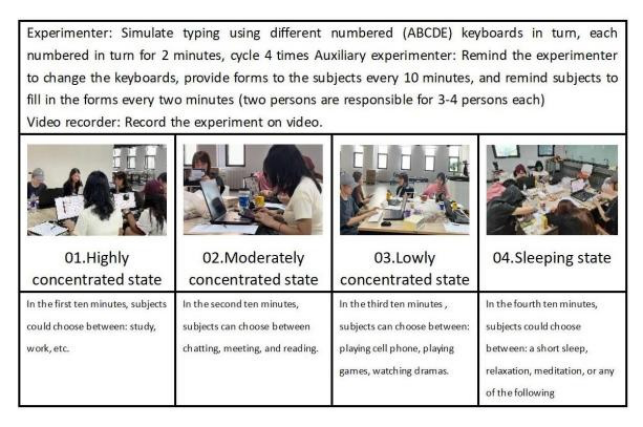
Scenario simulation experimental method. The experiment simulated four different concentration states, and the simulation was performed every ten minutes. The experimental data can be combined with comparative veri- fication statistics to obtain the most authentic and effective experimental data.
Figure 4: Scenario simulation test record.
Participants on Measurements In this study, teachers and students of Beijing Institute of Technology were used as experimental subjects, and all of them obtained and signed informed consent. The task is to test the influence of keyboard key sounds in the envi- ronment in different set states, and the independent and dependent variables are shown below.
Table 3. Description of independent variables.
Table available in the original PDF paper.
Independent Variable Number of Levels Explanation State level 4 Lowly concentration state, Moderately concentration state, highly concentration state, sleep state Key tone decibel level 5 Level A (35∼50db), Level B (50∼55db), Level C (55-60db), Level D (60∼65db), Level E (65∼70db)
Table 4. Dependent variable description.
Table available in the original PDF paper.
Independent Variable Number of Levels Explanation Interference level 5 “No interference” 0-1, “Slight interference” 2-3, “Moderate interference” 4-5, “Severe interference “ 6-7, “Extreme interference” 8-10 Noise sensitivity 5 Very insensitive, insensitive, generally sensitive, sensitive, very sensitive
Exploring the Subjective Response of Keyboard Key Sounds 101
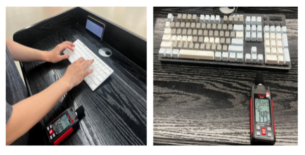
Apparatus and Procedures Before the experiment, a decibel meter was used in a silent chamber to test and classify according to the average decibel value.
Figure 5: Equipment and procedure test preparation.
Research Results and Analysis Psychological studies have shown that the limit of people’s ability to distin- guish information levels is 7±2, so the AHP method uses a maximum nine- percentile scale when evaluating the relative importance of each indicator (Li et al., 2004). By using the rating scale method, the degree of interference is divided into five levels: “no interference”, “slight interference”, “moder- ate interference”, “severe interference”and “extreme interference”. Based on subjective experience, the subjects made judgments according to the level and filled in the questionnaire.
A total of 108 valid experimental forms were recovered (4 invalid forms were removed), and a total of 205 valid experimental records were recorded. The results of mathematical statistical processing are shown in the following table.
Table 5. Statistics of subjective responses to the degree of disturbance.
Table available in the original PDF paper.
Keyboard Type i A B C D E Average sound level Li 42.5 52.5 57.5 62.5 67.5
Highly concentrated state
No interference 9 7 1 2 3 Slight interference 1 5 4 2 3 Moderate interference 1 1 2 5 5 Severe interference 0 0 3 3 4 Extreme interference 1 0 0 1 1 Sum of frequencies ni 12 13 10 13 16 Moderately concentrated state
No interference 5 3 2 0 0 Slight interference 1 2 1 1 1 Moderate interference 0 2 0 3 2 Severe interference 0 1 2 1 1 Extreme interference 0 0 0 0 0 Sum of frequencies ni 6 8 5 5 4 (Continued)
Table 5. Continued Keyboard Type i A B C D E
Table available in the original PDF paper.
Lowly concentrated state
No interference 12 13 9 4 3 Slight interference 1 3 4 6 7 Moderate interference 0 0 1 3 5 Severe interference 0 0 0 2 2 Extreme interference 0 0 0 0 1 Sum of frequencies ni 13 16 14 15 18 Sleeping state No interference 4 1 1 1 0 Slight interference 2 2 0 2 1 Moderate interference 1 2 1 3 1 Severe interference 0 2 0 3 2 Extreme interference 0 3 0 0 5 Sum of frequencies ni 7 10 2 9 9
Calculation of Difference Threshold Differential Threshold (Differential Sensory Threshold): Also known as the minimum perceptible difference, it refers to the value of the stimulus that can cause differential sensation in 50% of the number of experiments.
Disturbed Affiliation Function The subjects are highly confident in their judgment of “no interference” and “extreme interference”, so the affiliation degree of “no interference” is set to 0, the affiliation degree of “extreme interference” is set to 0, and the affiliation degree of “extreme interference” is set to 0. Therefore, the affil- iation degree of “extreme interference” is set to 1, and the confidence level of “slight interference”, “moderate interference”, and “severe interference” is low. Accordingly, the affiliation function of the subjective response to the keyboard noise is given by the step-by-step estimation method as follows:
Equation reproduced from the original PDF.
+ 1.0/extreme interference (1) Probability of Being Disturbed
Keyboard noise’s subjective reflection of the information fed back in the survey not only includes ambiguity, but also there is a great deal of ran- domness, and this ambiguity and randomness can be interpenetrated. The annoyance probability of each center sound level reflects all the informa- tion of the subjective psychological response of the respondents, and the annoyance probability is calculated by the following formula:
Pi =
(2)
P µjnij P nij
Exploring the Subjective Response of Keyboard Key Sounds 103
Where Pi is the probability of annoyance for the keyboard type of the serial number i, nij is the frequency of the occurrence of the jth evaluation level under the ith sound level, and µj is the degree of affiliation of the jth evaluation level to the degree of interference.
Table 1 substitution data into the (2) formula to find the probability of the subject’s degree of annoyance to different types of keyboard sound in each state is listed in Table 6 below:
Table 6. Interference probability of each average sound level in each state.
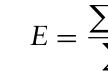
Differential Threshold of Disturbance The disturbed probability for each average sound level combines all the infor- mation about the subjective response of the subject at that sound level. The disturbed difference threshold value should fully reflect this information and is calculated by the following formula:
Equation reproduced from the original PDF.
(3)
P LiPi P Pi
Where E is the average sound level corresponding to the annoyance thresh- old of keyboard noise; Li is the ith center sound level; and Pi is the probability of annoyance at the ith center sound level.
Due to the “highly concentrated state” and “sleep state” under the E-type keyboard annoyance probability being too large, in order to maintain the accuracy and validity of the results, these two states of the E-type key- board data are not included in the calculation process. Substitute the relevant parameters in Table 2 into formula (3), and the thresholds of the annoyance difference in each state of the interference are: 59.98dBA in the highly con- centrated state, 60.79dBA in the moderately concentrated state, 62.98dBA in the lowly concentrated state, and 59.61dBA in the sleep state, respectively.
Ridit Test Ridit analysis is a hypothesis testing method for comparing the comparison group with the standard group of grade data, which has the advantages of simplicity, clarity, and quantification [15] .
The standard group was selected as the standard group with the same fre- quency number of the name level and the group with a certain frequency of each evaluation grade, and the high to low grades E, B, E, and B were
respectively, and the Ridit value of each standard group was calculated.
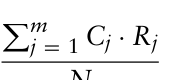
Pm
Equation reproduced from the original PDF.
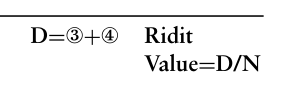
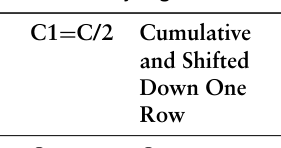
Where: Cj is the total number of cases of j evaluation level, that is, the frequency of the jth level occurrence; N is the total frequency; Rj is the Ridit value of each level. The Ridit value is obtained by adding half of the frequency number of each level of the standard group and the cumulative fre- quency number (shifted to the next line), and dividing it by the total frequency number, and the calculation of Rj is shown in Table 7 .
Table 7. Ridit value calculation table for each judgment level.
Table available in the original PDF paper.
Equation reproduced from the original PDF.
Interference Level Total Number C
Equation reproduced from the original PDF.
x y z { | } No interference 80 40 0 40 0.1951 Slight interference 49 24.5 80 104.5 0.5098 Moderate interference 38 19 129 148 0.7220 Severe interference 26 13 167 180 0.8780 Extreme interference 12 6 193 199 0.9707 Total N 205 - - - -
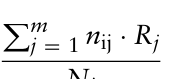
From equation (4), the average R-value of each standard group can be derived, and also, the average R-value of each comparison group is demanded with the following formula:
Pm
Equation reproduced from the original PDF.
(5)
Ri = Ni
Where: nij is the frequency number of evaluation grade j under the center sound level of the sequence number; Rj is the Ridit value of each grade; Ni is the total frequency number under the ith average sound level.
Since the theoretical basis of the Ridit test is to transform the original dis- tribution into a uniform distribution from 0 to 1 after R-value conversion, the standard error of the uniform distribution is 1/12. Therefore, the 95% confidence limit of the average Ridit value of each comparison group can be derived from the following equation (6): 95% confidence limit = Ri + 2/√12ni = Ri + 1/√3ni (6)
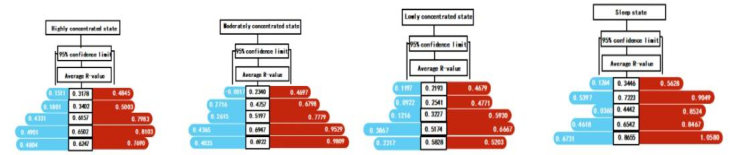
The obtained average R-value and 95% confidence limit calculation results are summarized as a whole in Table 4 below .
The average R-value in the table has the significance of the probability of interference. The R-values of the standard groups in the four states were 0.6247, 0.4757, 0.5828 and 0.7223, respectively.
Exploring the Subjective Response of Keyboard Key Sounds 105
Figure 6: Average value and confidence limit of each average sound level R.
CONCLUSION AND RECOMMENDATIONS This study aims to investigate the effects of different decibel keyboard noise on people in different activity states. Multiple experiments were conducted to arrive at a recommended shortcut noise limit that could be undisturbed by others. Finally, through data analysis and calculation, it was concluded that the difference threshold of disturbance of people in different states was 59.98 dBA in the highly concentrated state, 60.79 dBA in the moderate con- centrated state, 62.91 dBA in the low concentration state, and 59.61 dBA in the sleep state.
REFERENCES
Catherine, Cook. Robin, B. L. and Shona, Papalia. (2004). The effect of upper extremity support on upper extremity posture and muscle activity during key- board use, Volume 35, Issue 3, pp. 285–292. Hugh, E. M., Melissa, Jacobson. Peter, Clark. Ryan, Opina. Chau, Hegg and
Peter, Johnson. (2009). Design and evaluation of a curved computer keyboard, Volume 52, No. 12, pp. 1529–1539. Ising H., Kruppa B. (2004). Health effects caused bynoise: Evidence in the literature from the past 25 years. Noise & Health, Volume 6, No. 22, pp. 5–13. Li, Guochun. (2004). The Application of SPSS Programming in Ridit Analysis.
Evidence based medicine, Volume 4, No. 1, pp. 51–53. Mei, Zhang. Jian, Kang. Fenglei, Jiao. (2012). A social survey on the noise impact in open-plan working environments in China, Science of The Total Environment, Volume 438, No. 1, pp. 517–526. Meng, Zhaolan. ed. (1997). General Psychology. Beijing: Peking University Press. Naomi, G. Swanson, Traci L. Galinsky, Libby, L., Cole, Christopher, S., Pan, Steven, L., Sauter. (1997). The impact of keyboard design on comfort and productivity in a text-entry task, Applied Ergonomics, Volume 28, Issue 1, pp. 9–16. Parsons, K. C., (2000). Environmental ergonomics: A review of principles, methods
and models, Applied Ergonomics, Volume 31, Issue 6, pp. 581–594. Pereira, A., Lee, D. L., Sadeeshkumar, H., Laroche, C., Odell, D. and Rempel, D.
(2013). The Effect of Keyboard Key Spacing on Typing Speed, Error, Usability, and Biomechanics: Part 1. Human Factors, Volume 55, No. 3, pp. 557–566. Qing, Li. Fengxiang, Qiao and Lei, Yu. (2016). Impacts of pavement types on in-vehicle noise and human health, Journal of the Air & Waste Management Association, Journal of the Air & Waste Management Association, Volume 66, pp. 87–96.
Tong, H. (2022). Urban planning and public health: A sound environment perspective with a data-driven approach. Doctoral thesis (Ph. D.), University College London. Zhang, Bangjun. Xu, Chao and Zhai, Guoqing. (2004). AHP calculation method for
fuzzy membership function of subjective response to noise. Chinese Environmen- tal Science 2004, Volume 24, No. 3, pp. 364–366.
LISTED IN THE AHFE DIGITAL BOOKSTORE CATALOGUE
Explore the complete digital volume
Ergonomics In Design
Read this individual research paper free through the original publisher, or explore the full digital proceedings book.
ISBN 978-1-964867-05-2
Explore this ISBN in the AHFE Bookstore ↗Listed in the July 2026 bookstore catalogue; search by ISBN to confirm current availability · Digital book purchase optional