Yue Wu, Siqi Zhang, Yuqing Zhang, Yun Chen (2023). Human- centered Design Research of Visualization Approaches to Health Popularization. In: Human-Centered Design and User Experience. AHFE Open Access, vol. 114, pp. 484–494. https://doi.org/10.54941/ahfe1004267
With the improvement of people's health consciousness and the development of new media, the visual representation of health science based on media has flourished. However, the current visualization cannot meet people 's emotional needs. This article conducted literature research and in-depth case studies on types of visualization for health science popularization, questionnaire survey and comparative analyses were carried out between the existing visualization methods of health science popularization. The article then discusses the design strategy for building a suitable visual html five(H5) for health science popularization. The results of practical verification show that the html five quiz game can guide people to actively think about and understand how to use medicine correctly, optimize the user's experience when acquiring knowledge. This research offers an insight into human-centered design of visualization of health science popularization.
Science popularization, or popular science, involves spreading scientific knowledge to the wider public. Reach has increased along with expenditure in science popularization, especially when using multimedia and new media. By 2019-2020, the scientific literacy of citizens has increased to 10.56%. In 2022, a national plan was proposed to raise scientific literacy to over 15% by 2025 (Ministry of Science and Technology of the People’s Republic of China, 2021), encouraging science popularization alongside technological innovation and a platform for science popularization creation and research.
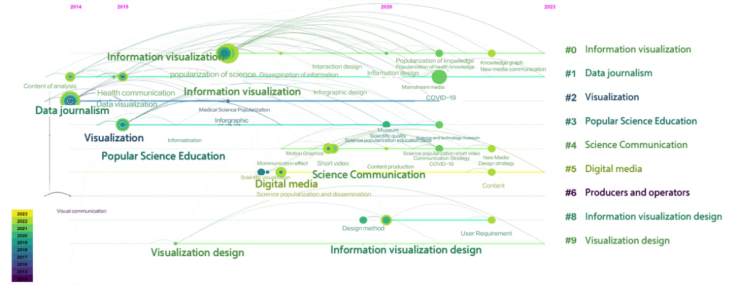
Visualization involves using technologies to convert target objects into graphics or images for interactive processing. This study used the CNKI database to search for documents related to “science popularization visu- alization” from January 1, 2013, to March 7, 2023. After filtering, 230 valid documents were analyzed using CiteSpace, yielding four clusters. Cluster (0) is information visualization, highlighting the increased focus on health science popularization and its growing relationship with new media dis- semination since the epidemic outbreak. Cluster (1) is data journalism, emphasizing content analysis, interactive design, and information presenta- tion in science popularization. Cluster (4) is science communication, with
Human-Centered Design Research of Visualization Approaches 485
recent research concentrating on short videos and communication strategies, predicted to continue focusing on dynamism and strategic thinking. Clus- ter (5) is digital media, where research has shifted from media dissemination effects to content production, suggesting that future science popularization will prioritize content screening and production.
Health popularization, also known as health science knowledge popu- larization, refers to the dissemination of health-related laws and policies, scientific health concepts, reasonable diets, disease prevention, and promo- tion of traditional Chinese medicine culture (Chishtie et al., 2022). Health popularization encompasses spreading health-related information, including policies, concepts, diets, and disease prevention. It has transitioned from tra- ditional methods to visual media on platforms, fostering increased health awareness and attention to health issues.
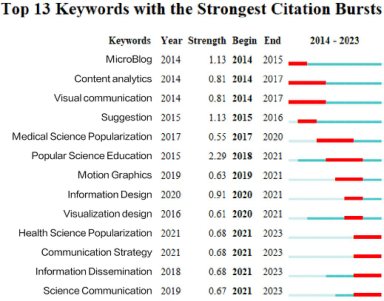
Figure 1: Timeline of keywords related to health science popularization visualization.Figure 2: Top 13 keywords with the strongest citation bursts in health science popular- ization visualization.
Human-centered Design (HCD) is a design process that focuses on under- standing and meeting the wants, preferences, and circumstances of users. HCD may generate engaging, intuitive graphics that aid user interpretation of proper health information in health popularization visualization. Some
existing science visualization methods, however, have drawbacks such as monotony, poor engagement, and a lack of emotional response. This research analyzed current science visualization methods through literature research, case studies, and user evaluations. This research then developed a human- centered H5 design with strategies for health science visualization to enhance active reading, knowledge comprehension, and positive emotional feedback. The research employs an interactive quiz format in the H5 design, trans- forming dense text into appealing illustrations, aiming to improve public retention of pharmaceutical knowledge. This approach seeks to support healthy lifestyles in the post-pandemic era through popular science education.
RESEARCH Literature Research: Demand Analysis of Health Science Popularization
There has been an extraordinary amount of public interest in health science popularization since the COVID-19 pandemic epidemic. Clarify users’ expec- tations for popularization content and forms, identify issues with present popularization forms, and optimize popularization propaganda to raise pub- lic health literacy to establish effective health science popularization in this new context.
The general public is the target audience for health science popularization, which aims to promote information sharing, innovation, and public health literacy. According to pertinent study literature, the following specifications should be taken into account while designing for this domain: 1) Reli- able information. For health science to be widely understood, data sources, authors, and information visualizations must be accurate and trustworthy. 2) Dissemination is simple. Content should be prepared for online distribu- tion in the information era. 3) Readability and visual attractiveness. Visually appealing, legible, and intelligible material improves people’s engagement with and understanding of information because the target audience is the general public.
Case Study: Types of Visualization for Health Science Popularization Visualizing complicated health science knowledge is referred to as “popu- larizing health science.” The general population is the target audience for popularizing health science. The public can more easily acquire and under- stand abstract health science knowledge when it is translated into visually appealing and digestible formats using techniques like charts, graphics, ani- mations, and films. For the purposes of case studies, this article splits health science popularization visualization into two categories: dynamic and static.
Static Visualization for Science Popularization Static health science visualization is typically based on online articles, mag- azines, newspapers, and cartoons, and it is published on a variety of media platforms. It has a large readership and numerous distribution methods. The language style is fundamental and vivid, and the visualization is clear.
Human-Centered Design Research of Visualization Approaches 487
Table 1. A survey of current literature on the popularization of health science.
Table available in the original PDF paper.
Research Conclusion
Health science popularization service providers must focus on the differences between public demands and improve the connotation of health science services.
Yaxin Gao etal.(2021). Health Communication and Popularization in the Context of Epidemic Era: Preferences of the Chinese General Population, 24 September 2021, PREPRINT (Version 1) available at Research Square
Visualization in health has strong historical roots, with an upward trend in the use of these methods in population health and HSR.
Chishtie, J. etal.(2022). Interactive Visualization Applications in Population Health and Health Services Research: Systematic Scoping Review. Journal of Medical Internet Research, 24(2), e27534.
People have high expectations but low trust in obtaining science popularization information through mobile networks.When using mobile networks, users prioritize visual articles and short videos to obtain scientific knowledge.
Zhang, L., & Ran, H. (2019). Research on the Current Status of Public Science Popularization Demand in Southwest China: Based on a Survey and Analysis of 3757 Questionnaires. Higher Education of Architecture, 28(6), 171–182
The top three health science communication topics that community residents consider “comparatively” and “extremely” necessary are food safety, disease prevention and control, and rational use of medication.
Huang, M. etal. (2023). Research on the Demand for Health Science Popularization and Its Influencing Factors Among Community Residents. Chinese General Practice, 26(4), 426–433 Li, W. etal. (2021). Research on the Status Quo and Demand of Science Popularization for Smart Community Residents: An Analysis Based on 849 National Questionnaires. Higher Education of Architecture, 30(3), 171–180
The top five science communication platforms (mediums) that residents consider to be the best are WeChat subscription accounts, WeChat Moments, Weibo, short video apps, and online education platforms.The satisfaction level of residents with community science platforms is at an average level.
Xu, N. 2022. Advantages of applying information visualization design in health science popularization. Hunan Packaging,
1. There are currently very few studies on communicating health science visually. 2. Staff should pay closer attention to the cognitive background and knowledge structure of the audience while designing layouts and information visualization. 3. The major objective is to encourage knowledge innovation and dissemination among the populace.
Dynamic Visualization for Science Popularization. Dynamic health science visualization primarily includes short videos and the emerging H5 method. H5, a newer medium, offers both dynamic and static science popularization, engaging users with interactive artistic representa- tions of topics. It not only satisfies visual needs but also enhances interest and user experience. Compared to static visualization, dynamic approaches have a more defined length, making them more comprehensible for readers.
Table 2. Types, characteristics, and cases of static science visualization (Folds et al., 2008).
Table available in the original PDF paper.
Types Characteristics Cases WeChat Official Account
1. Shared via links or public posts on chat platforms like WeChat; 2. Brief, around 1,500 words, in accessible language; 3. Reading time of 2–5 minutes; 4. Includes photos, charts, and illustrations for clarity; 5. Highly topical, often tied to seasons or current events.
Figure 3. “What do you know about polycystic ovary syndrome?”
Figure available in the original PDF paper.
Social platform science posts
1. Focused on Q&A platforms like Zhihu and Jianshu, shared via links; 2. Longer, informative articles, typically 3,000-5,000 words; 3. Reading time of 3–6 minutes; 4. Includes images like experiment photos or data charts to reinforce content credibility; 5. Specialized content with logical structure and terminology, requiring some professional knowledge for readers.
Figure 4. “Depression and brain fog: how the new coronavirus damages the brain”
Figure available in the original PDF paper.
Cartoons / Posters
1. Focus on photo-centric platforms like Little Red Book and WeChat Public; 2. Moderate length with substantial information; 3. Reading time of 4–7 minutes; 4. Illustrated with textual explanations of medical knowledge; 5. Readable content, using cartoons and simple text to clarify professional knowledge. Figure 5. “About diabetes”
COMPARATIVE ANALYSIS OF FORMS OF HEALTH SCIENCE POPULARIZATION VISUALIZATION This section builds on the research field and related case studies from the pre- vious section of the study, comparing and analyzing the benefits, drawbacks, and aspects of various visualization techniques, summarizing and concluding that the dynamic type is superior to static in terms of communication effect, but there are issues with weak interactivity and low user participation, thus innovatively proposing health science propaganda through H5 and creating an H5 design.
User Evaluation During the research phase, the authors discovered some common issues in current health science popularization visualization types: strong subjectiv- ity, reliance on the creator’s professional skills and knowledge reserves, poor interactivity, and cognitive cost required for science popularization articles. As a result, designers gathered the visualization aspects from the prior part and created a score questionnaire on five dimensions: production difficulties, comprehensibility, aesthetics, information volume, and interaction. The questionnaire used a five-point scale rating form.
Human-Centered Design Research of Visualization Approaches 489
Table 3. Types, characteristics, and cases of dynamic science visualization (Folds et al., 2008).
1. Spread on regular video platforms. Colloquial videos are easily accepted by users; 2. The length of the video is usually in the range of 1–2 minutes; 3. Expert appearances to explain relevant medical knowledge, adding credibility to the video; 4. Highly targeted. The content is closely linked to the expert’s field of study and has a high degree of professionalism.
Figure 7. “How the new coronavirus damages the brain”
Figure available in the original PDF paper.
MG animations 1. Focused on short video platforms; 2. Videos are 5–10 minutes, providing extensive content with detailed explanations; 3. The visual style is relaxed and lively, using drawing/modeling, narration, and music to convey medical knowledge vividly; 4. Highly adaptable. Voiceovers and subtitles can be easily changed for use in different languages and regions.
Figure 8. “Women’s menstrual knowledge”
Figure available in the original PDF paper.
H5 1. Shared on social platforms like WeChat via web links or QR codes; 2. Flexible content length tailored to specific design needs; 3. Typical experience duration of 3–5 minutes; 4. Adaptable style with simple dynamic effects for engaging visuals; 5. High interactivity, using gamification to guide users through health knowledge.
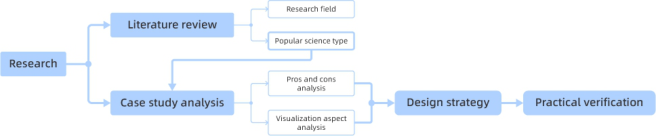
Figure 9: Research approach.
The questionnaire was distributed through the media and received 77 valid responses. The majority of the participants were design students aged 18 to 25, with a male-to-female ratio of 1:3. The reliability of the questionnaire data was examined using SPSS. Cronbach’s coefficient was in the 0.7-0.8 range, indicating high reliability. As shown in Table 4, this questionnaire’s Cronbach’s coefficient was 0.788, indicating good data reliability and quality that can be used for future research.
Table 5 displays the results of calculating the average score for each item. A score closer to 5 is defined as having lower production complexity, ease of comprehension, higher aesthetics, richer information, and stronger interaction. According to the data, the main flaws of present static science popularization visualization kinds are poor interaction and challenging to
understand. Despite their extremely high development difficulty and certain creative thresholds, dynamic science popularization visualization styles are often more understandable, aesthetic, and educational than static types. H5- type visualizations, on the other hand, have the potential to be a technique for popularizing health science because they can rely on already rich H5 creative websites, lowering production hurdles while retaining quality and aesthetics.
Table 4. Reliability analysis results of the questionnaire.
Table available in the original PDF paper.
Cronbach’s reliability analysis
Number of items Sample size Cronbach’s α coefficient
26 77 0.788
Table 5. User evaluation rating result.
Table available in the original PDF paper.
Type
Dynamic Static Motion Graphics Expert Explanation Video H5 Public Account Article Science Popularization Post on Social Platform Comic/ Visualization Poster
Design Strategy Establishment Visualization is not simply a method or technique for transforming informa- tion into graphics, but rather a comprehensive system of related dimensions. This system is composed of narrative style, degree of realism, style expres- sion, transition effects, and time duration. An in-depth comparative analysis is conducted on the five dimensions of visualization production, as shown in the Table 6.
Narrative style refers to the presentation structure, perspective, and lan- guage style used to describe a series of information. The most commonly used narrative style currently is the single-line structure based on cognitive logic. The degree of realism refers to the degree of fit between the visualized object and the object in the real world. Generally speaking, the higher the degree of realism, the more conducive it is to the popular science audience’s understanding of the content. Style expression refers to a form that is formed by combining visual elements such as points, lines, faces, and colors. Tran- sition effects refer to the switching methods used between different content in the work. Dynamic types of popular science have transition dimensions, while static types do not. Different transition effects will produce different subjective feelings and behavioral guidance for users. The length of videos is defined in two ways in the industry. The first is defined by Youku Video, which sets short videos at no more than 30 seconds and long videos at no
Human-Centered Design Research of Visualization Approaches 491
more than 20 minutes. The second is defined by the First Video Network, which sets the length of short videos between 3–5 minutes.
The aforementioned research conclusion indicates that H5 can make up for the limited user engagement in current systems in terms of information transfer and user interaction. In light of the five dimensions, the H5 design strategy is as follows: 1. Narrative style based on cognitive logic single-line structure; 2. Low degree of realism; 3. Memphis or BME style; 4. Smooth and rhythmic animation effects; 5. Time duration within 1–3 minutes.
Table 6. Comparative analysis of the facets of health science popularization visualization design type.
Table available in the original PDF paper.
Type
Dynamic Static Motion Graphics H5 Public Account Article Posts on Social Platform Expert Explanation Video Comic/ Visualization Poster
Live-action Flat style Memphis style Flat style BME style etc.
Flat style Minimalist style None
Transition effect Fade in/out, Push
Fade in/out, Geometric shapes etc.
Fade in/out, Smooth, Dissolve, Reverse etc.
Duration(minutes) 1∼2 5∼10 3∼5 2∼5 3∼6 4∼7
PRACTICAL VALIDATION OF DESIGN STRATEGIES Medication Safety
People are paying more attention to medication safety as a result of the evo- lution of contemporary medical models and the improvement of self-care awareness. The improper use of some medications can render them inef- fective and delay the onset of their effects, even putting lives in danger. According to statistics, between 11% and 26% of the prescription drugs taken in China are used unreasonably. Over 190,000 individuals die each year as a result of using the wrong prescription, and at least 2.5 million patients treated each year need to be hospitalized as a result of poor drug reactions (Chen et al., 2022). It is crucial and vital to raise public understand- ing of safe pharmaceutical practices and to popularize medical knowledge. Sustained-release and controlled-release tablets are used as examples in this H5 design.
Design Positioning Multiple question-and-answer H5 experiences were subjected to a summary analysis with placement from the four categories of purpose, logic, graphics, and interactivity. This design uses an H5 interactive quiz-style that converts
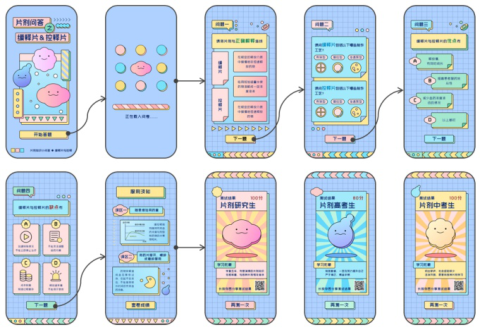
tablet knowledge into understandable questions so users can learn while hav- ing fun. The logic behind the experience is as follows: “theme page > loading page > answering questions > transition reading > ending poster.” The design uses a single-line cognitive narrative to address the experience and aesthetic requirements of the user. A low-fidelity method reduces complicated con- cepts due to the complexity of tablets, allowing users to better understand the science material. The chosen Memphis aesthetic uses highly saturated hues. Users are kept interested by the vibrant and rhythmic animations. To prevent user weariness and a sense of forced learning, the experience is purposefully maintained under 1.5 minutes.
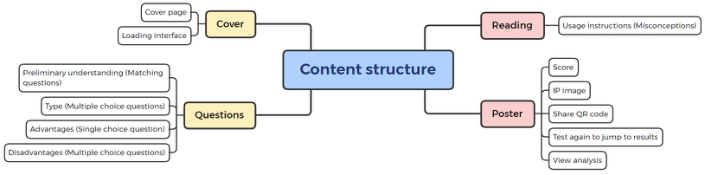
Practice Process First, the popular scientific article’s major information is retrieved. It is then divided into four sections, “Cover-Questions-Reading-Poster”, as illustrated in Figure 10. Second, to produce a uniform and harmonious visual style, the breakdown process of sustained-release tablets is abstracted into geometric shapes and rebuilt into an IP shape.
After that, the interface design is made, as seen in Figure 11. By visit- ing the topic page, users can experience more about the Q&A concerning controlled-release and extended-release tablets. We designed four questions to introduce slow-release pills and controlled-release tablets in detail, respec- tively, in order to help users fully understand these types of tablets. Finally, three results are matched in accordance with the answer circumstance after the backend registers the score for the replies. If every question is correctly answered, the test score is 100, signifying a thorough comprehension of pills. The test score is 80 points if 70–80% of the questions are correctly answered, demonstrating some knowledge of pills. If 0–60% of the ques- tions are properly answered, taking into account the user’s emotions, the test score is 60 points, indicating a low level of comprehension of the medication method.
In the final step, the flat file is then imported into the Epub360 production platform for H5. The animation effects are output, and the interaction logic is built to meet the requirements for simple and smooth interactive expe- riences. Positive feedback on fascinating question formats and innovative styles.
Figure 10: Content structure for medication safety h5 design.
Human-Centered Design Research of Visualization Approaches 493
Figure 11: Interactive flowchart for medication safety h5 design.
SUMMARY AND DISCUSSION Health science popularization has emerged as a significant method for the general public to learn about health issues in light of the quick development of multimedia technology and the rising demand for citizen health, and there are an increasing number of application scenarios and spaces for health science popularization visualization.
In order to comprehend the present state of pertinent research disci- plines, this work adopts a literature review methodology. Case studies and questionnaire surveys are then used to compare and contrast the strengths and weaknesses of contemporary science popularization visualization tech- niques from various angles. The use of quiz H5 as a creative design process for science popularization visualization is suggested, and workable design solutions are built from the five visualization dimensions and validated through design practice. The design increases the impact and effectiveness of health popularization by encouraging emotional engagement and behavioral change.
In future practice, a series of scientific popularization H5 products for health sectors such as drug safety can be introduced. It is hoped that more theoretical research and design practices related to health science populariza- tion H5 design will be developed in the future, and that the combination of health science popularization visualization and H5 will increasingly appear in people’s daily lives, raising societal health awareness.
REFERENCES
Chen, B., Shin, S., Wu, M., & Liu, Z. (2022). Visualizing the Knowledge Domain in Health Education: A Scientometric Analysis Based on CiteSpace. International Journal of Environmental Research and Public Health, 19, 6440. https://doi.org/ 10.3390/ijerph19116440 Chen, Y., Jiang, J., & Xie, B. (2006). Reflections on the Social Responsibility of
Community Hospital Pharmacists. China Pharmacy, 17(11), 873–874.
Chishtie, J., Bielska, I. A., Barrera, A., Marchand, J., Imran, M., Tirmizi, S. F. A., Turcotte, L. A., Munce, S., Shepherd, J., Senthinathan, A., Cepoiu-Martin, M., Irvine, M., Babineau, J., Abudiab, S., Bjelica, M., Collins, C., Craven, B. C., Guilcher, S., Jeji, T., Naraei, P., & Jaglal, S. (2022). Interactive Visualization Applications in Population Health and Health Services Research: Systematic Scoping Review. Journal of Medical Internet Research, 24(2), e27534. Huang, M., Zeng, L., Pu, G., Min, H., Huang, X., Wang, Y., & Wu, Y. (2023).
Research on the Demand for Health Science Popularization and Its Influencing Factors Among Community Residents. Chinese General Practice, 26(4), 426–433. Li, W., Zhang, L., & Xiang, L. (2021). Research on the Status Quo and Demand of Science Popularization for Smart Community Residents: An Analysis Based on 849 National Questionnaires. Higher Education of Architecture, 30(3), 171–180. Ministry of Science and Technology of the People’s Republic of China. (2021,
September 24). Health Communication and Popularization in the Context of Epi- demic Era: Preferences of the Chinese General Population [Preprint]. Research Square. https://doi.org/10.21203/rs.3.rs-895623/v1 Song, H. (2017). MG Animation Market Application Prospect Analysis. China Market, 2017(24), 74–75. Xu, N. (2022). Advantages of Applying Information Visualization Design in Health
Science Popularization. Hunan Packaging, 37(4), 70. Zhang, L., & Ran, H. (2019). Research on the Current Status of Public Science Popularization Demand in Southwest China: Based on a Survey and Analysis of 3757 Questionnaires. Higher Education of Architecture, 28(6), 171–182.
LISTED IN THE AHFE DIGITAL BOOKSTORE CATALOGUE
Explore the complete digital volume
Human-Centered Design and User Experience
Read this individual research paper free through the original publisher, or explore the full digital proceedings book.
ISBN 978-1-958651-90-2
Explore this ISBN in the AHFE Bookstore ↗Listed in the July 2026 bookstore catalogue; search by ISBN to confirm current availability · Digital book purchase optional