Weilin Su, Jie Ling (2023). Real-time visualization design of electronic music based on immersion theory. In: Human-Centered Design and User Experience. AHFE Open Access, vol. 114, pp. 102–113. https://doi.org/10.54941/ahfe1004227
In the context of the current multi-cultural integration, people are eager to obtain multi-sensory experience in music aesthetics. According to the definition and classification of electronic music, this paper analyzes its different characteristics from different angles, and discusses the immersive design of music visualization performance and performance space based on the author's works as an example; puts forward the problems and corresponding solutions in existing electronic music performances ;Aiming at the characteristics of electronic music that are different from traditional music performance, the corresponding mapping rules, technical means, and expression methods are proposed to realize the visualization of music.
In order to meet the needs of the future, cross-media design integration has become the direction of public art expansion, with the aim of expanding art- works from the initial media to more media, thus forming a diverse design perspective and audience identity. Music visualization is a typical cross-media creation, and it is a discipline specializing in music-related disciplines, whose research includes music feature extraction, emotion detection, and image processing, etc. The focus of music visualization is on visual and auditory interaction, transformation, and expression. It has been shown that when visual aids are provided during the performance of music, the emotions expressed can be better identified, leading to a deeper understanding of the sound by the audience.
REAL-TIME VISUALIZATION OF MUSIC Real-time music performance visualization is an art form that combines music with visual elements. In this form, by converting various parameters of music into images, animations, and other visual elements in real time through a programming system, the audience can experience the artistic charm of music through both visual and auditory senses. Real-time visualization is an advanced form of music performance visualization. It refers to the conver- sion of various parameters of music, such as rhythm, pitch, volume, etc.,
Real-Time Visualization Design of Electronic Music Performance 103
into animation elements in real time, thus creating a visual echo and reso- nance with the melody and rhythm of music. These animated elements can be lines, shapes, colors, light and shadow, etc., which can change with the music, forming a dynamic visual effect closely connected with the music.
Real-time interaction is another important form of visualization for real- time music performance. It refers to changing the expression of music real-time performance visualization through the interactive behavior of the audience. For example, the audience can control the movement and form of the visualization elements on the screen by means of gestures and sounds. This interactivity not only increases audience participation and creativity, but also creates more diverse and personalized visual effects. In real-time music performance visualization, real-time animation and real-time interaction can be combined with each other to create a richer and more interesting visual effect. This form of artistic expression can be used not only for music perfor- mance, but also in various art fields, such as visual arts, dance, and theater. It can provide a richer and more diversified means of expression for these art forms, allowing the audience to have a more comprehensive experience in both visual and auditory senses.
IMMERSIVE EXPERIENCES “Immersive Experiences” is similar to the psychological term “flow,” which refers to the intense focus of an individual’s attention on a specific behavior. Flow theory was developed by scholar Mihaly Csikszentmihalyi to describe a fully engaged, focused, and satisfying state of mind that people expe- rience when they engage in a particular activity. According to mind-flow theory, when people achieve a balance between skills and challenges, they feel a sense of flow in which mind and body are united and time disap- pears. In a mind-flow state, the individual’s sense of self is reduced, while focus and engagement with the task are at their highest point. Mihaly Csik- szentmihalyi believes that by pursuing a mind-flow experience, people can achieve greater personal satisfaction and positive psychological experiences, which in turn enhance their quality of life and well-being (Csikszentmihalyi, 1990).
ELECTRONIC MUSIC Electronic music is a genre of music that is created using electronic instru- ments, digital instruments, or circuit-based music technology. It utilizes devices such as electronic oscillators, synthesizers, and electronic sound syn- thesis to produce unique electronic sounds. Electronic music encompasses a wide range of styles and forms, including electronic dance music, experimen- tal electronic music, ambient electronic music, and more. It is characterized by its innovative, experimental, and multimedia nature, providing listen- ers with rich musical experiences through electronic techniques and creative approaches. Electronic music has a significant global influence and has become an integral part of contemporary music culture.
104 Su and Ling
Electronic Music Mapping In the visualization of electronic music, a detailed analysis of the style of electronic music in terms of style is first required to determine the specific type of style that generates the corresponding image. This analysis process can consider aspects such as the rhythm, tempo, emotion and the way the music elements are used. Through this analysis, the overall atmosphere, mood and creative approach of electronic music can be understood, thus providing guidance for the subsequent visualization creation.
Based on the unique characteristics of electronic music, such as the sense of energy, rhythm and repetition, visual effects corresponding to the images can be generated based on these musical elements. Fast movements, pulsating patterns or dynamically changing elements can be used in the visualization to show the energy and rhythm of the music.
The melodic direction and mixing details of electronic music can also be used in visual compositions. By analyzing the melodic structure and mixing treatments of electronic music, such as reverb, distortion, delay, compression and special effects, these musical elements can be translated into correspond- ing visual variations. For example, the humidity and dryness of reverb can be used to create ethereal or three-dimensional visual effects, while the intensity of distortion and delay can give the image a unique texture and sense of time and space.
As electronic music producers, they not only explore and innovate vari- ous sounds and sound effects, but also produce unique musical experiences through structural arrangements. This musical structure and orchestration can also be translated into visual elements in visual compositions to present the ebb and flow, climaxes and transitions of the music.
Therefore, the visual composition of electronic music needs to take into account many comprehensive factors such as musical style, energy, rhythm, repetition, melodic direction, mixing details and structural arrangement in order to generate visual symbols and visual experiences corresponding to the music. Such a creation process will fully demonstrate the uniqueness of elec- tronic music, as well as the creator’s understanding and expression of music and visual art (Lima et al., 2021).
PROBLEMS WITH ELECTRONIC MUSIC VISUALIZATION Music Visualization Mapping Type
Music visualization mapping type is an important concept in music visual- ization, which refers to the ways and methods of mapping the sound features of music onto visual elements. According to the current research and schol- ars’ classification, he author classifies audiovisual mapping into four types, such as natural mapping, integrated mapping, stylistic mapping, and logical mapping.
Natural Mapping Visualization design can use physical mapping to enhance the immersion and musical experience of the audience. Physical mapping is a form of expression
Real-Time Visualization Design of Electronic Music Performance 105
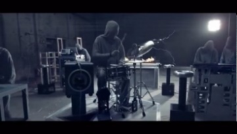
in music visualization that allows the audience to directly feel the intensity, vibration and energy of the music by transforming its physical properties into visible physical changes or effects. On the physical level, physical changes in reality are induced by the vibrations generated by the input source. For exam- ple, New Zealand composer Nigel Stanford’s 2014 music work “Cymatics”, in this music MV work, the use of drum vibrations to affect the movement of water, the frequency of the piano to control the change in the height of the fire, the use of synthesizers to generate the Krani graphics, visual Tesla coil discharge effect, etc.. The dynamics of each track in the music in this music video maps the physical visual form, a total of six different types of vibra- tion changes can be seen (CYMATICS: Science Vs. Music - Nigel Stanford - YouTube, n.d.).
Table 1. Problems with electronic music visualization. (Constructed by the author, 2023).
Table available in the original PDF paper.
Existing Problems Solutions
Design using relevant programming interaction software, such as Processing, Touch Design, VVVV, Max/MSP/Jitter, to achieve real-time interaction between music and visuals in the performance.
Mostly ready-made animated shows Few real time operations to generate Mostly simple audio-visual mapping Few extracted features mapping
The specific characteristics of the music - style, rhythm, emotion, rhythm, storytelling - are clearly listed, and the visual elements such as color, change, special effects, dot, line, dimension, figuration, abstraction, etc., are corresponding through the law of mapping, so as to present a more detailed, rich and multi-layered visual expression of the music.
Mostly single media solution Few integrated media presentation
The sound characteristics of the music are transformed into visual elements, such as graphics, colors and animations, which are organically combined with stage performances, lighting effects, projection images and other multi-media. And on top of that, audience participation and interactivity are added. Through interactive graphic interface, virtual reality technology and other innovative means, the audience can interact with the music visualization performance, for example, through gestures to control the change of images, participate in the stage performance and so on. This interactive design enables the audience to become part of the performance and create a unique musical visualization experience together with the artist.
Mostly mechanical interaction mapping Few audiovisual emotional resonance
Based on rational correlation mapping technology, correlation software technology, and channel linking technology, we use correlation emotion theory to make the emotions of both music on the input side and visual on the output side match based on emotional emotion and subjective sensibility.
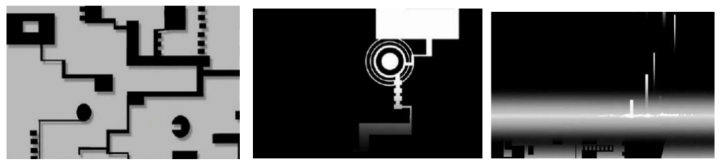
Style Mapping The creator creates a mapping of the picture according to his knowledge of the music style, such as the overall style of the music corresponds to the visual tendency of the thematic elements of the picture, the mapping of the psycho- logical theory of color to the color rules of the picture, the correspondence between the musical story cues and the narrative of the picture, and the corre- spondence between the psychological characteristics generated by the sound and the psychological characteristics generated by the picture. For example: animation director Michel Gagné’s work “Sensology (Sensology)”. visualizes an album produced by jazz musicians Barry Guy and Paul Plimley in 1995. The music’s dynamic notes, jumping rhythms, and the rise and fall of various emotions are better reproduced visually. This is an experimental animation full of stream of consciousness, with contrasting black and white images and simple dotted line elements, but it restores the ups and downs and emotions of the music, as if we can see the melody become a vivid life, swinging out vibrant lines and postures (Michel Gagné - Animation, n.d.).
Figure 2: Michel gagné — sensology. (Link source: https://www.youtube.com/watch? v=UVWKtXDvr04).
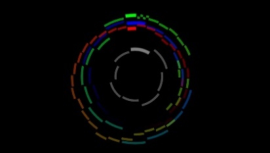
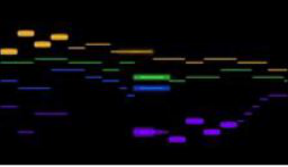
Logic Mapping The properties of digital signals such as MIDI signals, frequency, amplitude, velocity, loudness, speed, etc. are transformed according to the mapping logic rules for the corresponding properties of the picture. For example, Stephen Anthony Malinowski’s basic mapping model consists of multiple sets of variables of both music and graphics together. He wrote a corresponding mapping program according to the characteristics of classical music works, and the corresponding visual video can be output automatically by inputting MIDI notes. The input and output source relationships of the mapping cor- respond to the sound part and the shape of the graphic; the note time value of the music and the length of the graphic line; the chord properties of the
Real-Time Visualization Design of Electronic Music Performance 107
music and the color of the graphic; the pitch of the sound and the vertical height position of the graphic; and the sequence of notes and the horizontal position of the graphic (Smalin - YouTube, n.d.).
Figure 3: Pachelbel, Canon in D (Chromadepth 3D). (Link source: https://www.youtub e.com/watch?v=2PFpgXym4T8).Figure 4: Ricercare XIV, by Johann Jakob Froberger. (Link source: https://www.youtub e.com/watch?v=6fJNH903qpM).
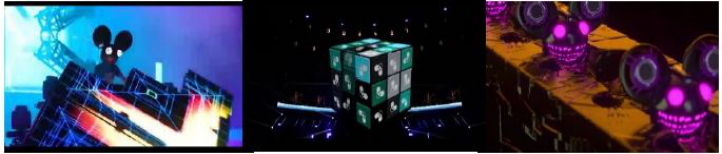
Integrated Mapping Different mapping types are fused and iterated, and multiple mapping types are fused and involved with each other to present a special multi-dimensional and multi-level sensory effect. For example, the CUBE V3 installation in Deadmau5’s electronic music performance, a giant Rubik’s Cube installa- tion in the middle of the stage, the installation can change in many forms according to the performance situation. Inside the installation, the artist Deadmau5 performs a live electro-acoustic performance. The stage visual effects program was built by TouchDesigner and linked through the stage’s touch components. Live lighting, screen images, and DJ performances are all processed in real time and involved in the audiovisual performance of elec- tronic music, giving the audience a multi-level stimulating sensory experience (Cube v3 Tour, n.d.).
SPACE DESIGN Spatial design is also a means of creating artistic value that can combine art, technology and design to create artworks with unique creative and aesthetic value, enhancing the artistic and ornamental qualities of the work. Therefore, for real-time visualization performance of electronic music, a special physi- cal space to match the work is also one of the elements to create a sense of immersion (Lakatos, 2020).
Physical Space In the design of the physical space, such as the Karma Fields offline per- formance, Karma Fields as a DJ will be covered in a hexagonal container, which is actually a translucent screen, through which we can vaguely see the DJ, but when the music starts, the screen will start flashing visual effects of waveforms, codes, and particles, perfectly immersing people in the music and the “source” code universe. The “source” code universe of the mystery.
Virtual Space Virtual scenes are the existence of the self in the virtual world that is uncov- ered in a specific environment using various unique perceptual abilities, such as hearing, seeing, tasting, and smelling. At the same time, people use their subjective consciousness to interact naturally with the space around them to get more realistic sensations back. Such a representation can create an envi- ronment that may be objective, even beyond time and space, in which people can become engrossed and have the desire to create control to some extent. In other words, a virtual scene with a certain operating space is constructed from multidimensional data, and its main purpose is to simulate reality and human-machine interaction.
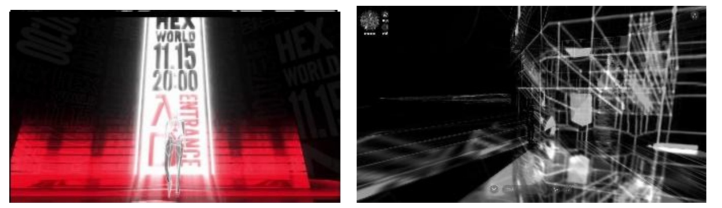
March 2023 “ECHO SPACE” works, is the world’s first immersive and interactive music video, the so-called immersive and interactive music video, that is, the user is not one-way through the screen, to feel the music and the story behind the music, the user is able to manipulate the virtual image to explore the space inside, to explore and experience the artist’s ideas and emo- tions. The abstract emotions expressed in electronic music are transformed into virtual spaces and artistic assets (architecture, shapes, lines and colors, etc.), using the shaping of the entire space to map out the music style, and as players explore different spaces, the music changes as well. Th e work visual- izes electronic music introduced from the virtual interactive level to improve the immersion of online players.
Real-Time Visualization Design of Electronic Music Performance 109
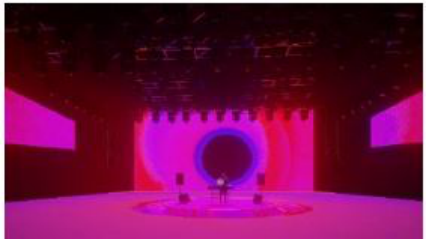
The title of the work is “Back To Square One”. Using Trance-style music as a mapping source to generate visual images in real-time visualization, it utilizes the interactivity between music and visuals to map the emotion and rhythm of the music directly onto the visual elements, thereby enhancing the immersion and emotional resonance of the audience. Through the way of overall visual changes, the energy and emotion of the music is expressed so that the audience can feel the emotional ups and downs of the music more intuitively.
Figure 8: Overall effect of the work (constructed by the author, 2023).
Concept of the Work This work uses an abstract black circle as the visual center, and the circle also has a symbolic meaning. The circle is a form that represents completeness and infinity. In philosophy, the circle is often used to explore the nature of existence and the nature of the universe. The infinitely extended nature of the circle is also considered to be the nature of the universe, as the universe appears to have no boundaries, but rather extends infinitely. Circles also rep- resent continuity and cycles, which are the basis for many phenomena in the universe. In culture and religion, the circle is seen as a symbol of wholeness, unity, eternity and sacredness. The intention is to reinforce the connection between music and visuals and to create a strong sense of atmosphere.
110 Su and Ling
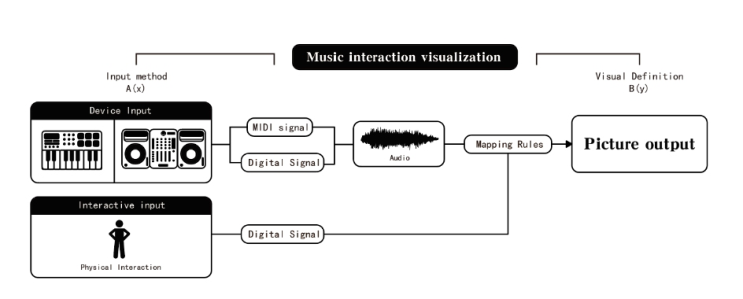
Figure 9: Input and output channel diagram. (Constructed by the author, 2023).
Production Ideas This work was created using TouchDesigner software, using a spherical model for particle deconstruction, controlling the diffusion trajectory of par- ticles, introducing gradient color changes, and then adjusting through delay, edge, blur and other effects to finally integrate multiple lines together to form the visual effect. On top of this visual basis, audio information is extracted and mapped to the corresponding visual elements. Join the interactive system, use the sensor to sense people’s position in the scene, collect people’s posi- tion information, and produce the visual effect of ripples on the trajectory of people walking.
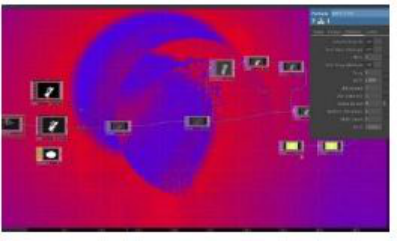
Figure 10: Project screenshot of TouchDesigner. (Constructed by the author, 2023).
Audio Extraction To introduce the visual impact of music, we need to extract the information of music first. Add “Audio File In”component to import the audio signal; add “AudioAnalysis” component to analyze and load the audio high frequency, mid frequency, low frequency, loudness, waveform and other information; through “Select”component to filter out the information you want to extract the mapped audio signal, the data of the visual elements in the single signal mapping screen is adjusted to the target, and data processing components such as Math and Filter can be added to fine-tune the data to meet the overall screen requirements.
Real-Time Visualization Design of Electronic Music Performance 111
Style Mapping The work is based on a stylistic mapping of the electronic music genre Trance, which is characterized by a very fast tempo, usually between 120 and 160 beats per minute. A large number of repetitive elements are often used, such as continuous chords, melodies and drums, which makes it ideal for dance and gives it a hallucinogenic feel. Trance music often has a long track structure, usually over 6 minutes, which gives it plenty of time to build and develop themes.
In response to the above musical style characteristics, the overall visual style is a good fit. On a visual level, the highly abstract black circular sphere at the center of the visuals is evocative. The circle is a classic geometric shape with many unique characteristics and meanings, and it has no angles or edges, which makes it comfortable and calming. In nature, many objects take on a circular shape, such as the sun, moon, stars, etc., making the circle an important symbol for people to think about the universe and the laws of nature. The circle constantly inhales and exits fluid, giving people a sense of immersion and illusion. Trance elements and passages repeat and change, and the visuals are guided by the black archetype, and the circle has the meaning of continuous cycle and repetition.
Logical Mapping Audio signals have high data processability and can be used to extract spe- cific elements of the signal through various algorithms and techniques. The author extracts information for the audio signal in the internal machinery of the software, the author extracts the loudness of the audio, high frequency signal, the rhythm of the bottom drum, and the rhythm of the military drum information to map the circle size, color saturation, fluid change, and light flicker elements of the picture respectively.
Audio Signal Mapping rules Visual elements Circles Loudness Extract the audio loudness signal and map it to the size of circular shapes according to the loudness level
Color High Frequency Signal The amount of high frequency signal to map the fluid color saturation changes
Fluid Base drum rhythm Extract the rhythm of the bottom drum to map the speed of the visual fluid movement
Light and dark
Snare drum rhythm Extract the rhythm of the bottom drum to map the change of visual light and darkness
Integrated Mapping The work is not only from the visual level alone, but also adds the elements of interaction and live space layout to present a comprehensive, using top sen- sors to intervene and collect people’s location signals, which are transmitted
112 Su and Ling
back to the software to generate ripple effects based on location information. and flexibility.
In the center of the DJ stage, a circular sinking platform is designed, echo- ing the black circle in the background. The black circle seems to be a black hole, constantly sucking in matter, so the center of the stage is also designed with a declining trend, participating in the expression of the moral of the work in the space design.
Figure 11: Interaction effect. (Constructed by the author, 2023).
CONCLUSION
In this paper, the visualization of electronic music performance can be based on electronic music style, music characteristics, music arrangement, music details targeted visual mapping; propose the main problems in the current visualization and the corresponding preliminary solutions to improve the immersion of the audience; summarize the four mapping methods “natural mapping “, “stylistic mapping”, “integrated mapping” and “logical mapping “The design of space can be divided into Physical Space and Virtual Space, and the linkage between space and music can enhance the immersion of the audience accordingly; finally, the author’s work is used as an example to integrate the relevant points of the article into the design of the work.
Visual design has an important role in electronic music performance that cannot be ignored, and can add more visual layers and artistic feelings to the performance, thus improving the quality and viewing value of the per- formance. In the visual design realization of electronic music performance, several steps such as selection of visual elements, development and realization of design scheme, adjustment and optimization of visual design are needed according to the theme, atmosphere and style of the performance in order to achieve the best artistic effect. In the visual design and realization of the visual work of electronic music performance, the relationship between musical ele- ments and visual elements needs to be fully considered to create a unified and organic art work. At the same time, it is also necessary to combine the characteristics of the performance and the needs of the audience to design suitable interaction methods and visual effects to make the audience more immersed in the performance.
ACKNOWLEDGMENT
I would like to express my sincere gratitude to my supervisor, Jie Ling, for their invaluable guidance, support, and mentorship throughout the course of this research. Their expertise, patience, and encouragement have been
Real-Time Visualization Design of Electronic Music Performance 113
instrumental in shaping the direction and quality of this work. I am truly grateful for their insightful feedback, constructive criticism, and unwaver- ing belief in my abilities. I would also like to thank Zhongkai College of Agricultural Engineering Student Innovation Fund Science and Technology Project “Visualization of real-time performance of electronic music based on immersion theory <Synapse>” (2023CX07) for supporting this research.
REFERENCES
Csikszentmihalyi, M. (1990). Flow: The Psychology of Optimal Experience. Cube v3 tour. (n.d.). Retrieved 6 July 2023, from https://deadmau5.com/video/5-da ys-nights-with-the-la-horde/ CYMATICS: Science Vs. Music—Nigel Stanford—YouTube. (n.d.). Retrieved 6 July
2023, from https://www.youtube.com/watch?v=Q3oItpVa9fs Lakatos, M. (2020). Sights and Sounds of Big Data: Ryoji Ikeda’s Immersive Installations. Acta Universitatis Sapientiae, Film and Media Studies, 18(1), 109–129. https://doi.org/10.2478/ausfm-2020-0006 Lima, H., Santos, C. G. R., & Meiguins, B. S. (2021). A Survey of Music Visualization
Techniques. ACM Computing Surveys (CSUR), 54, 1–29. Michel Gagné—Animation. (n.d.). Retrieved 6 July 2023, from https://www.gagneint.com/Final%20site/Animation/Sensology/Sensology.html smalin—YouTube. (n.d.). Retrieved 6 July 2023, from https://www.youtube.com/us er/smalin
LISTED IN THE AHFE DIGITAL BOOKSTORE CATALOGUE
Explore the complete digital volume
Human-Centered Design and User Experience
Read this individual research paper free through the original publisher, or explore the full digital proceedings book.
ISBN 978-1-958651-90-2
Explore this ISBN in the AHFE Bookstore ↗Listed in the July 2026 bookstore catalogue; search by ISBN to confirm current availability · Digital book purchase optional