Anna Gelich, Jefferson Ellinger (2023). Towards Smart Building: Visualization of Indoor CO2 Concentration. Adapting Modern Computational Tools for Informing Design Building Decisions. In: Human Interaction & Emerging Technologies (IHIET 2023): Artificial Intelligence & Future Applications. AHFE Open Access, vol. 111, pp. 71–79. https://doi.org/10.54941/ahfe1004011
Carbon dioxide (CO2) is part of the indoor air. According to the American Environmental Agency (EPA), one of the world's worst polluted places are indoor spaces where we spend more than 90% of our time (U.S.EPA, 1989). It has been shown that excessive CO2 indoor concentration can cause different health problems, including allergies, lung cancer, induced asthma, and respiratory infections like Covid-19 virus. Health problems often occur in poorly ventilated space that allows CO2 to increase beyond acceptable levels due to inefficient air circulation. To better understand the dynamics of this condition requires a fine grain model of how CO2 builds up and moves through space. In our study we developed a CO2 sensor network to record CO2 data and to visualize CO2 spread through a typical classroom to monitor air quality and to inform engineering and design building decisions to eliminate health risks. The CO2 sensor network is deployed inside 16 equally divided parts of the classroom. Each part is equipped with one sensor node for CO2 concentration monitoring. Collected data is visualized using modern computational tools and AI data-driven techniques. The results show that the increase in the quantity of classroom occupants as well as the time which they spend indoors directly impacts the level of CO2. Higher occupancy in the room triggers a higher value of CO2 concentration. Sensors in close proximity to people have higher CO2 readings. One of the data visualization charts shows readings from sensors installed in the different sections of the classroom. It visualizes approximately 5000 seconds of the readings done every second and shows the minimum and maximum indoor CO2 value. Another visualization is a three-dimensional model that spatially represents different CO2 concentrations in the equally divided parts of the classroom. Additionally, the airflow circulation analysis conducted in the classroom sheds light on how to adjust ventilation rates, to change the ventilation setup, or to adjust the building geometry. Personalized knowledge-based recommendation systems can be built to monitor indoor air quality inside the various classrooms at the university.
Carbon dioxide is part of the indoor air. According to the World Health Organization (WHO, 2018), air pollution causes 58% of deaths that relate to cardiovascular and one-fifth of lung problems. According to the EPA,
one of the world’s worst polluted places are indoor spaces where we spend more than 90% of our time (U.S. EPA, 1989). Research suggests that indoor and outdoor air pollution are closely linked, however, indoor air pollution levels are typically 2–5 times higher than outdoor pollution levels. The EPA states that indoor levels of pollution can become up to 100 times higher than outdoor, being one of the top five environmental public health risks (Seguel et al. 2016). It can cause short-term problems, including lack of focus, pro- ductivity, and more dangerously respiratory infections and Covid-19 virus (allergies strike 1 out of 4 Americans) (WHO, 2018), and long-term health problems, including lung cancer, induced asthma. Indoor air pollution can increase human emotional stress levels and negatively influence the work- flow and cognitive function (Satish et al. 2012, Kajtar et al. 2006, Fisk et al. 2013). High CO2 levels may expose occupants to hypoxia (Pastor-Fernández et al. 2022). The health problems often occur in poorly ventilated space that allows CO2 to be increased beyond acceptable levels due to inefficient air cir- culation. Understanding the dynamics of this condition requires a fine grain model of how CO2 builds up and moves through space. One of the main objectives of this study relates to the question: Can CO2 sensor data visual- ization inform design building decisions to improve indoor air quality? The key hypotheses of this study are that by setting up a CO2 sensor indoor net- work and adapting modern computational tools for CO2 data and airflow visualizations, architects can make informed decisions to improve indoor air quality, occupants comfort level and reduce occupants’ health risks connected to air quality and airborne transmission of Covid-19. CO2 sensor network studies and human occupancy patterns became especially important during the pandemic. Many countries established policies to improve air comfort. In the context of Covid-19, CO2 concentration can be used to indicate the virus. Studies suggest that the distribution of the Covid-19 virus monitoring is connected to the CO2 monitoring (Lapuente et al. 2022). CO2 sensor pre- dictors are the best to predict human occupancy patterns (Arief-Ang et al. 2018, Arief-Ang et al. 2016). The ideal CO2 indoor concentration should be close to 350 parts per million (ppm) in space with special requirements. In normal activity environments −500 ppm where 400 ppm can be assumed as the general outdoor concentration (Pastor-Fernández et al. 2022). Effective visualization can help architects to improve building characteristics. Adapt- ing modern computational tools can help in visualization of data sets to inform the design decisions at the schematic level (Tufte, 2001). The ulti- mate objective of this research is building a decision-support tool that shows three-dimensionally the correlation between CO2 concentration distribution in an assigned space calculated from a fewer number of sensors and people’s schedule.
RELATED WORK
Data visualization. Visualization is the way to communicate data informa- tion using various means for better results. (Andrienko et al. 2010) discussed visual analytics in terms of GIScience and geovisualization. (Tufte, 2001) included a summary of statistical graphics-tables and charts analysis to
Towards Smart Building: Visualization of Indoor CO2 Concentration 73
display quantitative information. (Pettit et al. 2013) presented an online HTML5/WebGL based 3D visualization tool. The tool supports biological datasets visualization but not spatial visualization. (Andrienko et al. 2010) provided a tutorial (tomviz) on visualization of 3D volumetric biological datasets which have outline and volume. (Lather et al. 2017) presented a prototype for spatial data visualization which uses data from different sen- sors linked with BMS and BMI. (Middel et al. 2008) proposed an open-source tool for multidimensional data visualization to explore complex data sets and to examine relationships between different aspects of information patterns in urban environments. Visualization of temporal or time-related data and its methods of visualization in the context of cartography and GeoVisual Ana- lytics discussed in (Andrienko et al. 2016). CO2 sensor networks (Spachos et al. 2016) explored the potential of a real-time wireless ad hoc sensor net- work system for indoor CO2 monitoring. (Bazant et al. 2021) developed a mathematical model that predicts the airborne transmission risk based on real-time CO2 tracking measurements. (Pastor-Fernández et al. 2022) invented a low-cost CO2 measurement device to monitor air quality remotely. Airflow ventilation analysis CO2 distribution connected to the air dynamics. (Postolache et al. 2009) presented a network for air quality (indoor and out- door) control. In (Di Gilio et al. 2021) the CO2 levels monitoring is explored inside of the classroom in order to reduce the risk of Covid -19 transmis- sion. (Lapuente et al. 2022) focused on CO2 sensors application to obtain occupancy patterns and air renovation rates. Using CO2 sensor data (Arief- Ang et al. 2018) presented a method to estimate indoor human occupancy within one room. (Holmberg et al. 2003) explored ventilation system design, where air supply and return conditions play a crucial role in airflow distri- bution in order to minimize airborne particles spread inside of the breathing zone. Impact of natural ventilation and meteorological conditions on Covid- 19 distribution indoor and semi-indoor public spaces explored in (Rivas et al. 2022). Passive ventilation scenarios of CO2 indoor concentration in terms of the residential passive buildings were simulated in (Cakyova et al. 2021). The assessment of indoor air quality in a school space was studied in (Ekren et al. 2017). CFD ventilation scenario modeling was created to assess the best airflow pattern in a classroom and to increase awareness of the occu- pants of the environments. Models included the student figures inside of the room and checking the air velocity around their head areas. (Cheng et al. 2021) conducted CFD indoor airflow study in a multiple zone environment with various boundary conditions. Tests showed that the CO2 concentration is the highest on the occupant nose level. In particular, it is higher below the nose level than above the nose. In (Mou et al. 2022) demand control ventilation (DCV) ventilation strategies were investigated. Despite the impor- tance of the problem there are limited studies and experiments related to wired CO2 sensor networks inside of the single typical classroom with the specific schedule and occupancy patterns and high density of CO2 sensors setup.
74 Gelich and Ellinger
METHODS
Our methodology included four phases. 1. CO2 sensor classroom network setup and CO2 cases development. 2. Data collection. 3. A review of data visualization strategies and developing scenarios of CO2 spatial-temporal data visualizations 4. Airflow ventilation simulation.
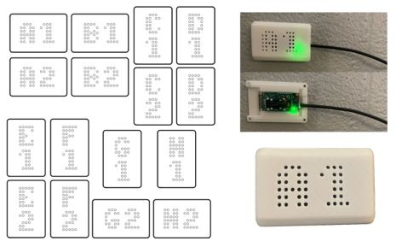
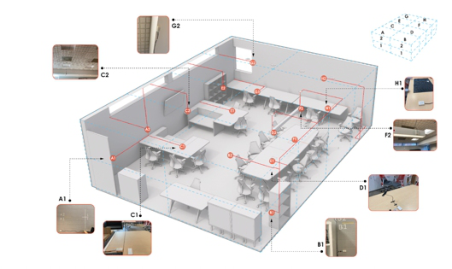
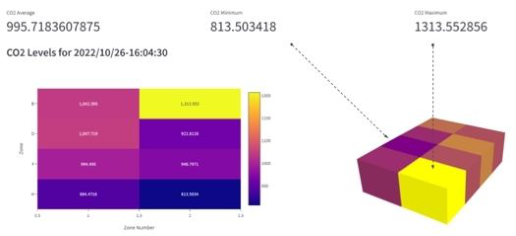
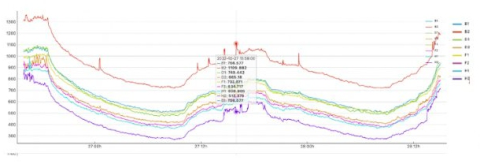
1. Usually, the air quality has been monitored using conventional methods, however, with the improved access to sensing equipment such as Internet of Things (IoT) and AI techniques, the sensor network can be set up with the help of the “connected devices”. The overall structure of the CO2 sensor net- work consisted of a microcontroller Raspberry Pi zero connected to a MUX I2C Channel and identical SCD30 sensors. SCD30 is a NDIR sensor with integrated temperature and humidity sensor, dual-channel detection, with measurement range: 400 ppm – 10,000 ppm, accuracy: ± (30 ppm + 3%). CO2 sensor cases were developed taking into consideration design guide- lines in sensirion.com. Sensor cases were named A1, A2…according to the 16 parts grid to help to articulate data collection (Fig. 1). The classroom where the CO2 sensor network was installed relates to one of the univer- sity buildings. The dimensions of the classroom (∼31 ft x ∼23 ft). The classroom was divided into 16 equal parts (∼12 ft x ∼8 ft). Inside of each part the CO2 sensor was installed. Total 16 sensors. Each part of the classroom was examined for CO2 distribution based on the scheduled classes inside of the classroom (Fig. 2). 2. CO2 monitoring was running the period from Sep.-Dec., 2022 continuously. Measurements have been recorded every second. Sensor data is used in CSV format. 3. 4. To visualize col- lected data and conduct airflow analysis following programs and software were explored: Streamlit, Orange, Grasshopper, Autodesk CFD, Houdini- 3D. Streamlit (Fig. 3) represents our attempt to visualize the temporal data and simulate a real time environment. It visualizes one day of our data col- lected from 8 sensors, approximately 5000 seconds-every change per second (https://agelich-co2-co2-q99mj5.streamlit.app/). Using Orange, we analyzed a sample of data (Fig. 4). On Thursday there is a smaller number of students in the studio, the min. level of CO2 was about 500 ppm. and the max. level of CO2 is about 1100 ppm. On Wednesday there are more students in the studio, the min. level of CO2 is about 800 ppm. and the maximum level of CO2 is about 1360 ppm. There are spikes when the number of people in the corresponding section of the room is the highest.
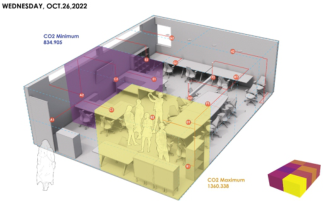
Grasshopper is used to visualize our data three-dimensionally. Simple script allows us to analyze the correlation between CO2 level and schedule. On Wednesday the number of students is the highest (according to schedule there are two groups on this day in the classroom), thus, the CO2 level is the highest. On Thursday there is no class scheduled in the classroom (there are only random students present in the classroom), thus, the CO2 level is the lowest. On Friday there is one group class scheduled in the room, thus, we can see that the CO2 level was higher on Wednesday and lower on Thursday (Fig. 5).
Visualization of the current airflow distribution inside of the classroom which has four ceiling supply air units, two ceiling return air units is shown
Towards Smart Building: Visualization of Indoor CO2 Concentration 75
built using Grasshopper script. Airflow velocity decreases downstream while the airflow circulates in the classroom before it approaches the return air. Large turbulent airflow exists in the area close to the supply and return air units. Five tests conducted using Autodesk CFD: Test 1 simulates existing ventilation conditions with four supply air units and two return air units without a diffuser. Test 2 simulates airflow with ten supply air units and five return air units. Test 3 simulates airflow with twelve supply air units and six return air units, two of supply units and one return unit located at the wall, the rest - at the ceiling. Test 4 shows the existing ventilation with four supply air units and two return air units which have a diffuser and represents the exact existing classroom ventilation condition. Test 5 analyzes the venti- lation conditions with four supply air units and two return air units which have a diffuser but are not located at the central part of the ceiling. Analysis showed that the diffuser influences the airflow intensity. The higher number of the supply air units and return air units increase the airflow circulation pre- senting the better performance. Air units at the wall increase air circulation and change airflow direction.
(https://youtu.be/puxzWFxbq6M) presents a visual concept to combine both spatial and temporal CO2 data visualization in order to monitor CO2 concentration in the classroom.
Figure 1: CO2 sensors and sensor cases.Figure 2: Studio CO2 sensor network. Digital model.
76 Gelich and Ellinger
Figure 3: Streamlit visualization.Figure 4: Orange visualization.Figure 5: Grasshopper CO2 sensor data visualization. Wednesday. Thursday.
CONCLUSION
The experiments expose CO2 concentration distribution in various parts of the classroom with a dense CO2 sensor network setup. The visualization techniques include spatial and temporal CO2 data visualization, and airflow analysis. It presents a strategy to combine spatial and temporal data visu- alization using modern computational tools familiar to architects. Higher occupancy in the room triggers a higher value of CO2 level. Sensors in close proximity to people have higher readings of CO2 level. An increase in the quantity of occupants as well as the time which they spend indoors directly impacts the level of CO2 that can be tracked. Airflow analysis indicates that
Towards Smart Building: Visualization of Indoor CO2 Concentration 77
larger turbulence exists in the area close to the supply and return air units. There is dependence of air circulation from the number of return/supply air units and their location inside of the classroom. The study was conducted inside of existing educational infrastructure with the usual student’s sched- ule. The experiment includes all phases of the CO2 study - CO2 sensor setup, design development of CO2 cases, data collection and data visualization. Data collection and monitoring CO2 spikes inside of the classroom make it possible, knowing the schedule, to predict and control CO2 spikes for fur- ther actions. Our further questions are: how CO2 data visualization can help to control CO2 spikes to improve ventilation and air quality? Can we take actions to improve air quality on the schematic level of design? Can CO2 data analysis inform design building decisions on ventilation or space geometry? Can we visualize alerts in terms of CO2 spikes? Can we build a recommen- dation system for these alerts? Other discussion points to consider: 1. CO2 levels related to the metabolic user’s activity. 2. Correlation between stu- dents’ working activity and CO2 levels. Occupancy patterns. 3. How the use of additional devices like 3-D printers, heating influences the CO2 concentra- tion. Personalized knowledge-based recommendation systems can be built to monitor indoor air quality inside of the various classrooms at the university.
ACKNOWLEDGEMENT
We greatly appreciate the support, encouragement, and guidance received from all team members of the Gresham Smith Architecture and Engineering Firm.
REFERENCES
Andrienko, G., Andrienko, N., Demsar, U., Dransch, D., Dykes, J., Fabrikant, S. I., Jern, M., Kraak, M.-J., Schumann, H., Tominski, C. (2010) Space, time and visual analytics, International Journal of Geographical Information Science, 24:10, 1577–1600. https://doi.org/ 10.1080/13658816.2010.508043 Arief-Ang, I., Salim, F. D., Hamilton, M. (2016). Human occupancy recognition with multivariate ambient sensors. IEEE International Con- ference on Pervasive Computing and Communication Workshops, 1-6. https://doi.org/10.1109/PERCOMW.2016.7457116 Arief-Ang, I. B., Hamilton, M., Salim, F. D. (2018). A Scalable Room Occupancy
Prediction with Transferable Time Series Decomposition of CO2 Sensor Data. ACM Trans. Sen. Netw. 14, 3–4, Article 21, 28 pages. https://doi.org/10.1145/ 3217214 Bazant, M., Kodio, O., Cohen, A., Khan, K., Gu, Z., Bush, J. (2021). Monitoring carbon dioxide to quantify the risk of indoor airborne transmission of COVID-19. Flow, 1, E10. https://doi.org/10.1017/flo.2021.10 Cakyova, K., Figueiredo, A., Oliveira, R., Rebelo, F., Vicente, R., Fokaides, P.
(2021). Simulation of passive ventilation strategies towards indoor CO2 concen- tration reduction for passive houses, Journal of Building Engineering, Volume 43, 103108, ISSN 2352–7102. https://doi.org/10.1016/j.jobe.2021.103108. Cheng, J. C. P., Kwok, Alison, H. H. L., Li, T. Y., Tong, J. C. K., Lau, A. K. H.
(2021). Sensitivity analysis of influence factors on multi-zone indoor airflow CFD simulation, Science of The Total Environment, Volume 761, 143298, ISSN 0048- 9697. https://doi.org/10.1016/j.scitotenv.2020.143298.
78 Gelich and Ellinger
Di Gilio, A., Palmisani, J., Pulimeno, M., Cerino, F., Cacace, M., Miani, A., de Gennaro, G. (2021). CO2 concentration monitoring inside educational buildings as a strategic tool to reduce the risk of Sars-CoV-2 airborne transmission. Environ- mental research, 202, 111560. https://doi.org/10.1016/j.envres.2021.111560 Ekren, O., Karadeniz, J. L., Atmaca, I., Ugranli-Cicek, T., Sofuoglu, S. C., Toksoy,
M. (2017) Assessment and improvement of indoor environmental quality in a pri- mary school, Science and Technology for the Built Environment, 23:2, 391–402. https://doi.org/10.1080/23744731.2016.1251288 Fisk, W. J., Satish, U., Mendell, M. J., Hotchi, T., Sullivan, D. Is CO2 an Indoor Pollutant? Higher Levels of CO2 May Diminish Decision Making Performance. (2013). Indoor Environment Group, Lawrence Berkeley National Laboratory, State University of New York Upstate Medical University. Holmberg, S., Chen, Q. (2003). Air flow and particle control with different
ventilation systems in a classroom, Indoor Air, 13, 200–204. Kajtar, L., Herczeg, L., Lang, E., Hrustinszky, T. and Banhidi, L. Lang, E. (2006).
Influence of carbon dioxide pollutant on human wellbeing and work intensity. Healthy Buildings, Vol. 1, Lisbon, Portugal, 85–90. Lapuente, C. S., Herrada, H., Jiménez, M. J., Sánchez, M. N. (2022). Long-Term Assessment of a Set of CO2 Concentration Sensors in an In-Use Office Building. Sensors 2022, 22, 9403. https://doi.org/10.3390/s22239403 Lather, J. I., Amor, R. Messner, J. I. (2017). A Case Study in Data Visualization
for Linked Building Information Model and Building Management System Data. Computing in Civil Engineering 2017: Information Modeling and Data Analytics. Levin, B. DA., Jiang, Y., Padgett, E., Waldon, S., Quammen, C., Harris, C., Ayachit, U., Hanwell, M., Ercius, P., Muller, D. A., Hovden, R. (2018). Tutorial on the Visualization of Volumetric Data Using tomviz, Microscopy Today, Volume 26, Issue 1, 12–17. https://doi.org/10.1017/S1551929517001213 Middel, A., Guhathakurta, S., Olech, P.-S.t, Höpel, F, (2008). Visualizing Future
3-Dimensional Neighbourhoods in Phoenix: An Application Incorporating Empir- ical Methods with Computational Graphics. Mou, J., Cui, S., Khoo, D. W. Y. (2022). Computational fluid dynamics modelling of airflow and carbon dioxide distribution inside a seminar room for sensor placement, Measurement: Sensors, Volume 23, 100402, ISSN 2665-9174. https://doi.org/10.1016/j.measen.2022.100402. Pastor-Fernández, A., Cerezo-Narváez, A., Paz Montero-Gutiérrez, P., Ballesteros-
Pérez, P., and Otero-Mateo, M. (2022). Use of Low-Cost Devices for the Control and Monitoring of CO2 Concentration in Existing Buildings after the COVID Era. Applied Sciences 12, no. 8, 3927. https://doi.org/10.3390/app12083927 Peng, Z., Jimenez J. L. (2021). Exhaled CO2 as a COVID-19 Infection Risk Proxy for Different Indoor. Environments and Activities. Environmental Science & Technology Letters 8 (5), 392–397. https://doi.org/10.1021/acs.estlett.1c00183 Pettit, J. B., Marioni, J. C. (2013). bioWeb3D: an online webGL 3D data visualisation
tool. BMC Bioinformatics 14, 185. https://doi.org/10.1186/1471-2105-14-185 Postolache, O. A., Dias Pereira J. M., Silva Girao, P. M. B. (2009). Smart Sensors Network for Air Quality Monitoring Applications, in IEEE Transactions on Instrumentation and Measurement, vol. 58, no. 9, 3253–3262. Rivas, E., Santiago, J. L., Martín, F., Martilli, A. (2022). Impact of natural ven-
tilation on exposure to SARS-CoV 2 in indoor/semi-indoor terraces using CO2 concentrations as a proxy, Journal of Building Engineering, Volume 46, 103725, ISSN 2352–7102. https://doi.org/10.1016/j.jobe.2021.103725. Satish, U., Mendell M. J., Shekhar K., Hotchi T., Sullivan D., Streufert S. and Fisk W. B. (2012). Is CO2 an Indoor Pollutant? Direct Effects of Low-to-Moderate
Towards Smart Building: Visualization of Indoor CO2 Concentration 79
CO2 Concentrations on Human Decision-Making Performance. Environmental Health Perspect, 120(12), 1671–1677. https://doi.org/10.1289/ehp.1104789 Seguel, J. M., Merrill, R., Seguel, D., and Campagna, A. C. (2016). Indoor air quality.
Am. J. Lifestyle Med. 11(4), 284–2895. Spachos, P., Hatzinakos, D. (2016). Real-Time Indoor Carbon Dioxide Monitoring Through Cognitive Wireless Sensor Networks, IEEE Sensors Journal, vol. 16, no. 2, 506–514. https://doi.org/10.1109/JSEN.2015.2479647. Tufte, E. R. (2001) The visual display of quantitative information. Cheshire, Conn.:
Graphics Press, 2nd edition. U. S. Environmental Protection Agency. (1989). Report to Congress on indoor air quality: Volume 2. EPA/400/1-89/001C. Washington, DC. https://www.epa.gov/ report-environment/indoor-air-quality. World Health Organization. Ambient (Outdoor) Air Quality and Health. (2018). http://www.who.int/news-room/factsheets/detail/ambient-(outdoor)-air- quality-and-health (accessed on 5 March 2021)
Read this individual research paper free through the original publisher, or explore the full digital proceedings book.
ISBN 978-1-958651-87-2
Explore this ISBN in the AHFE Bookstore ↗Listed in the July 2026 bookstore catalogue; search by ISBN to confirm current availability · Digital book purchase optional