Alexander Trende, Ina Krefting, Lars Weber, Andreas Lüdtke, Jochem Rieger, Martin Fränzle (2023). Investigation of Graphical User Interfaces for Online Driving Style Customization of Highly Automated Vehicles. In: Human Interaction & Emerging Technologies (IHIET 2023): Artificial Intelligence & Future Applications. AHFE Open Access, vol. 111, pp. 526–535. https://doi.org/10.54941/ahfe1004059
Technological progress in the field of autonomous vehicles may lead to the introduction of such vehicles into traffic in the upcoming decades. However, user acceptance of the technology is an important factor besides the technical possibility of the introduction of the technology. Since driving is a complex task and people drive differently, they may prefer different driving styles of an autonomous vehicle. Giving the users the possibility to adjust and personalize the driving style of their autonomous vehicle might help with the user acceptance and adoption of the technology. For this purpose, we conducted a driving simulator study wit N=11 participants to investigate whether the participants would like to have the possibility to adjust driving style parameters through a graphical human-machine interface. During the experiment the participants experienced a simulated ride in a fully automated vehicle in a dynamic driving simulator and had the possibility to change driving style parameters like the speed or time-headway of the simulated automated vehicle. After the experiment the participants filled out a questionnaire with items about technology acceptance. Overall, the results of the questionnaire suggest that the participants found the HMIs beneficial. Overall, there was an above average rating of 4.38/5.00 that such driving style personalization HMIs are going to support the driver during the vehicle use. By analyzing the experimental data, we found that most of the participants were able to find a suitable set of driving style parameters before the end of the experiment. We hypothesize that the possibility for a user to adjust some driving style parameters may help the adoption of the technology and its user acceptance.
The field of automated driving has made great progress in the last decades, which hints at a wider introduction of automated cars into our traffic in the upcoming decades. But the technological progress and promised safe functi- oning of highly automated vehicles (HAVs) is not the only relevant factor for the widespread integration into traffic. Users also need to adopt the tech- nology, which means that they also have to feel comfortable and safe while
Investigation of Graphical User Interfaces for Online Driving Style Customization 527
using the technology. Drivers may have distinct preferences regarding their preferred driving style (Sagberg et al., 2015). A driving style consists of a set of parameters to describe the driving dynamics of a vehicle. Examples are the preferred time headway, acceleration, deceleration or the desired driving speed on a given road type (Yusof et al., 2016). So far, different groups of drivers and their preferred driving styles have been investigated in a great variety of studies (e.g. (Hartwich et al., 2018), (Yusof et al., 2016)). Previous studies suggest that some participants prefer a similar HAV driving style to their own. (Hartwich et al., 2018) conducted a driving simulator study to investigate driving comfort, enjoyment, and system acceptance with respect to the driving automation’s driving style and the age of the participants. The results of the study suggest that a HAV driving style similar to their own incre- ases all three factors, namely comfort, enjoyment, and system acceptance for younger drivers. (Sun et al., 2020) conducted a study with 36 participants to evaluate user comfort and user trust for manual driving, non-personalized and personalized automated driving. The researchers found that the parti- cipants rated user trust and user comfort higher for personalized automated driving. Several researchers have investigated the effect and usefulness of gra- phical user interfaces to foster trust and acceptance of HAV (e.g. (Krefting et al., 2021), (Beggiato et al., 2015), (Hartwich et al., 2021)). Based on an expert focus group, (Beggiato et al., 2015) found that information presented in HAVs “should provide transparency, comprehensibility, and predictability of system actions”. Given these studies we assume that adjusting the driving style of the autonomous vehicle to the user’s preference can be a possible solution to avoid uncomfortable situations and accelerate the adoption of the technology. (Yusof et al., 2016) has suggested that driving styles could be customized by the user via a graphical user interface (GUI). A similar appro- ach was described in (Trende et al., 2019). The authors describe a graphical user interface to personalize driving style related parameters for HAVs. In this project we conducted a driving simulator study to test two different graphi- cal human-machine interfaces (HMIs) that allow users to customize driving style parameters during the use of HAVs. For this study we focused on car- following and overtaking manoeuvres on rural roads. The HMIs allowed the participants to adjust several driving style parameters related to these manoeuvres in real-time during the experiment. We wanted to investigate the technology acceptance of such GUIs and their purpose. Furthermore, we wanted to study the way the users interact with the presented HMIs.
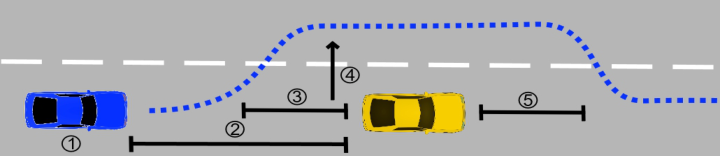
Pre-Study: Driving Simulator Study for Driving Style Derivation In order to derive driving styles and associated parameter ranges we perfor- med a driving style study with N = 25 (33.6 ±12.03y, 10 female). During a 15-min drive the participants performed different manoeuvres such as over- taking a slower vehicle or following a vehicle on the same lane. Although more manoeuvres have been performed during the study, we decided to focus on car-following and overtaking manoeuvres for the rest of this pro- ject. We defined driving styles based on a set of specific parameters for each manoeuvre (s. Fig. 1). From here on these three driving styles, will be called
Figure 1: Overview over the adjustable parameters of the HAV (blue) and the over- taking manoeuvre. 1. The speed of the HAV. 2. The Time-Headway (THW) during car-following. 3. The THW when the overtaking manoeuvre is initiated. 4. The late- ral acceleration during the overtaking manoeuvre. 5. The distance to lane-change after the subject vehicle has overtaken the vehicle in front (yellow).Table 1. Overview over the defined driving style parameters for the simulated overtaking manoeuvre.
“Defensive”, “Relaxed”, and “Sport”. Furthermore, we used the results to define the lower and upper bounds of the adjustable parameters for the gra- phical human-machine interface and the automation of the simulated vehicle. The parameters are listed in Table 1.
MATERIAL AND METHODS In this project we wanted to investigate whether users would like to adjust driving style parameters of a simulated HAV via a graphical human-machine interface (HMI). Furthermore, we are interested in the way the participants interacted with the HMI and what driving styles they configured during the study. We designed two variants of the HMI to adjust the parameters during an experiment. Afterwards, we conducted a driving simulator study to inve- stigate the user interaction with the HMIs and their preferences regarding the HMI.
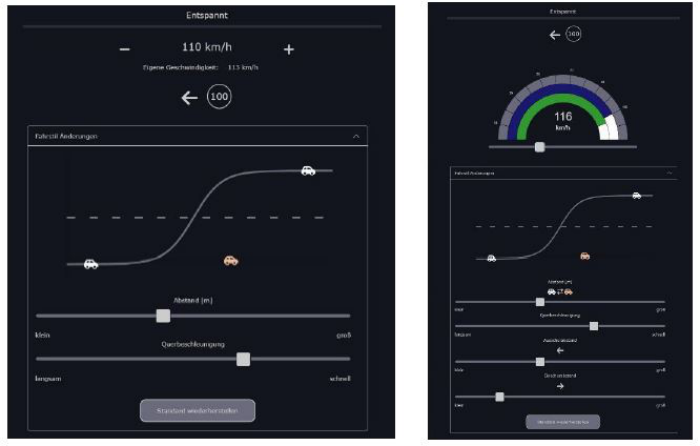
Graphical Human-Machine Interface Two different graphical human-machine interfaces (HMIs) were designed for this study. Both HMIs gave the user the ability to change driving style related parameters of the simulated vehicle’s driving dynamics. The two HMIs differ in the number of parameters they could change during the study (s. Fig. 2) and how detailed the speed of the vehicle is displayed. The “simple”HMI allowed the users to adjust speed, Time-Headway (THW) and lateral acceleration for overtaking. The “complex” HMI allowed the users to additionally adjust the THW for initializing the overtaking manoeuvre and the distance for merging after the overtaking. Both HMIs showed a simple interactive sketch regarding the overtaking manoeuvre to visualize the changes that the users made.
Investigation of Graphical User Interfaces for Online Driving Style Customization 529
Figure 2: (a) The basic HMI allows the users to adjust the THW and lateral acceleration during an overtaking manoeuvre; (b) the complex HMI also gives the users the possi- bility to change the THW for initiating the overtaking manoeuvre and the distance for initiating a lane-change to complete the overtaking manoeuvre. Furthermore, it shows a more complex speed display and allows the users to change the desired speed with a slider.
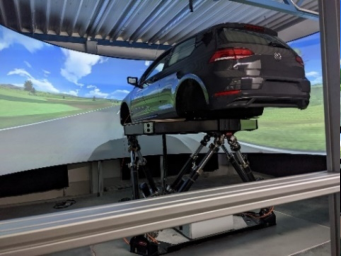
Driving Simulator Study for HMI evaluation The second study was performed in a dynamic driving simulator (s. Fig. 3). The driving simulator is based on a Golf 7 (2018) with fully functional inte- rior, mounted on a MOOG motion system (MB-E-6DOF/26/1800), active steering, visualization for all 3 mirror displays, 210
visualization (3*Barco FL40-4K) on a curved projection screen. Two full HD touchscreens in por- trait mode are present in the centre console of the car. The HMIs were presented on the upper touchscreen display. The driving simulation was per- formed using the SILAB driving simulation software1. In the beginning, the participants filled out a first questionnaire about demographics and their sub- jective driving style. The participants were asked about their age, gender and driving experience. Furthermore, the questionnaire featured items about their subjective driving style as presented in (Taubman, 2004). The first ride with the simple HMI was performed after the participants read a written introdu- ction to the study. The participants had the opportunity to pre-select one of the three predefined driving style for the HAV. Afterwards, the participants experienced a 15min long drive on rural roads. The speed limit varied during the ride between 100 km/h, 120 km/h and 130 km/h. The current speed limit was communicated to the participants through speed limit signs next to the road and was also displayed in the HMI. Several other vehicles drove in both
1Fahrsimulation und SILAB. (o. D.). https://www.wivw.de/silab
Figure 3: (a) The dynamic driving simulator used in the study; (b) image of the interior of the car. The larger touchscreen display in the centre was used for the graphical user interface.
directions of the rural road, which lead to overtaking manoeuvres by the simulated vehicle. During the ride the users had the possibility to change the driving behavior of the simulated HAV via the HMI presented on the touch- screen. The only difference in the second drive was that complex HMI was presented to the users. After the two drives the participants were given a que- stionnaire featuring items about user acceptance of the HMIs. To evaluate the two different HMIs, we used the questionnaire presented in (Cho, 2017), which was designed for technology acceptance based on user experience for autonomous vehicles. We selected 24 items which are grouped into the eight factors: Performance Expectancy, Effort Expectancy, Self-Efficacy, Perceived Safety, Anxiety, Trust, Affective Satisfaction and Behavior Intention. These 24 items were rated for each HMI individually. Additionally, the participants answered six qualitative questions about preferences and remarks regarding the HMIs.
RESULTS
Driving Simulator Study for HMI Evaluation – HMI Interactions 11 participants (26.92y ± 8.43; seven female, 4 male) participated in the second study for the evaluation of the two HMIs. The participants filled out a questionnaire with items about their subjective driving style before the actual experiment in the driving simulator. The mean score for the factors corre- sponding to a “Relaxed” driving style was significantly higher than the other two. “Relaxed” had a mean rating of 4.83, “Defensive” 1.99 and “Sport” 1.64. At the beginning of the driving simulator experiment the participants had the possibility to choose from one of the predefined driving styles that were defined during the analysis of the first study. Every one of the eleven par- ticipants chose the “Relaxed” driving style for their drive. This also matches the results of the driving style questionnaire before the experiment, where items regarding the “Relaxed” driving style received the highest mean score. During the second study we recorded all the interactions between the partici- pants and the HMIs. Table 2 shows the results for all eleven participants, the
Investigation of Graphical User Interfaces for Online Driving Style Customization 531
Table 2. Overview over the finale parameters values selected by the participants during the experiment.
Table available in the original PDF paper.
Parameter HMI Mean Standard deviation
Percentual change to initial value
Simple 1.72 0.08 +22.86%
Time Headway [s] Simple 1.80 0.37 +12.25% Complex 1.60 0.38 0.00% Maximum lateral Acceleration parameter
two HMIs and every one of the five parameters that were adjustable during the experiment. The mean and standard deviation was also calculated for each data point. The simple HMI did not offer the possibility to adjust the variables “THW initialize overtaking” and “Merging distance after overta- king”. Furthermore, we calculated the percentual changes between the initial values given by the chosen “Relaxed” driving style and the calculated mean values.
Overall, the participants increased the THW, the parameter regarding the lateral acceleration, and the THW for initializing the overtaking manoeuvre. Just the distance to initializing the lane-change after the overtaking manoeu- vre was reduced. The changes made corresponded to percentual changes to the initial values in the range of 12% to 25% percent. The second step of analysing the user interactions was to calculate the number of changes made by the participants during the experiment. Table 3 shows the mean number of changes to the parameters per participant and HMI. All parameters were changed around four to five times in average during the experiment. We also calculated the time from the start of the experiment until the last change was made to each parameter. The participants made the last changes to the para- meters after 6 to 9 minutes in the experiment. Both number of changes and time until the final change are slightly lower for the complex HMI.
The next part of the analysis of the HMI interactions was to count the num- ber of participants who seem to have settled on a specific set of driving style parameters before the end of the study. We calculated the mean time until the final adjustment over all five parameters for each participant. We deci- ded that a participant has settled on a final parameter set if this mean value was lower than the length of the experiment minus two minutes. According to this definition, eight of the eleven participants found a specific set of para- meters for the simple as well as the complex HMI. Whereas, in both cases three participants changed the parameters until the end of the experiment.
Table 3. Overview over means and standard deviations for mean number of changes and time until last adjustment during the experiment both per parameter and HMI.
Table available in the original PDF paper.
Parameter Number of changes Time to make final adjustment [min] Simple HMI Complex HMI Simple HMI Complex HMI
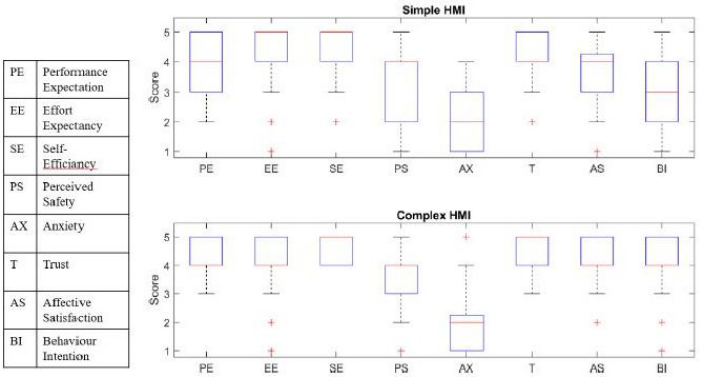
Driving Simulator Study for HMI Evaluation – Questionnaire Results The participants filled out a questionnaire with items related to their prefe- rences regarding the HMI design after the driving simulator study. Overall, on a scale of five the participants rated the item “Are the HMIs going to support the driver during the vehicle use?” with an average score of 4.38. Furthermore, ten out of the eleven participants preferred the complex HMI over the simple one. Only one person didn’t like either of the two. The par- ticipants also filled out the user acceptance questionnaire based on (Cho, 2017) for each of the two HMIs. We calculated the mean for all items and factors (s. Fig. 4). Items regarding Performance Expectancy were rated higher for the complex HMI (3.85 vs. 4.38) as well as Behavior Intention (3.28 vs. 4.00). Furthermore, both Trust and Affective Satisfaction were rated slightly higher for the complex HMI (4.15 vs. 4.49 and 3.80 vs 4.07). The remaining
Figure 4: Boxplots for the factors of the technology acceptance questionnaire for the simple (top) and complex (top) HMI.
Investigation of Graphical User Interfaces for Online Driving Style Customization 533
factors, namely Anxiety, Self-Efficacy and Perceived Safety were rated near equally for both HMIs.
DISCUSSION
In this project we investigated preferences and interactions regarding the online personalization of driving styles of HAVs. Therefore, we conducted a driving simulator study to record the participant’s interactions with two different HMIs to adapt the driving style of a simulated HAV in real time. We first determined the final values that the participants chose during the ride and calculated the mean differences with respect to the initial parame- ters that were set before the study. The participants increased the THW, the THW to initialize the overtaking manoeuvre and the distance to change lane after the overtaking manoeuvre was performed. All these increases indicate that the participants were not satisfied with the initial values which may be not safe enough for the participants preferences. We counted the num- ber of parameter adjustments done by each participant during the study and calculated the mean values and standard deviations (s. Table 3). Both for the simple and complex HMI eight out of the eleven participants seem to have found a fitting set of parameters before the end of the study. After the expe- riment the participants filled out a questionnaire with general quantitative and qualitative items about their preferences regarding the tested HMIs. Fur- thermore, the participants rated 24 items grouped into eight factors about technology acceptance for each of the two proposed HMIs. All quantitative items were rated on a 5-point scale. Over-all, there was an above average rating of 4.38 that such driving style personalization HMIs are going to sup- port the driver during the vehicle use. Giving the user more information and more agency during human-machine cooperation will most likely help user acceptance and foster trust (Chiou et al., 2021) The results of the user acce- ptance questionnaires complement similar studies regarding the use of HMIs in HAVs to increase user acceptance and trust ((Krefting et al., 2021), (Beg- giato et al., 2015), (Hartwich et al., 2021)). With respect to the comparison between the two HMIs all positive factors were rated above average with a score of 3.86 for the simple HMI and 4.07 for the complex HMI, which supports the conclusion that the participants found the HMIs beneficial in general. Items regarding Performance Expectancy were rated higher for the complex HMI (3.85 vs. 4.38) as well as Behavior Intention (3.28 vs. 4.00). The ratings for Performance Expectancy suggest that the participants would prefer the more complex HMI due to its richer configuration possibilities which might help them to find their ideal set of driving style parameters. The results for Anxiety (2.02 and 1.95) indicate that the participants felt confi- dent and not anxious while using the HMIs. This is additionally supported by the above average scores for Trust (3.80 and 4.07). The items related to the Trust, Perceived Safety and Anxiety indicate that the participants felt that the HMI was reliable and safe during the experiment. Effort Expectancy was the only factor rated higher for the simple HMI. This was expected since the simple HMI offered less configuration possibilities and featured fewer visual elements overall. The study presented here has some limitations: first
the sample size of eleven participants is rather small to produce significant results about driving style preferences. Comparable studies (Hartwich et al., 2019) or datasets (Jensen et al., 2020)(Bock et al., 2020) have a much lar- ger sample size to investigate research questions regarding preferred driving styles. A greater sample size will not just lead to more significant results, but also a greater variety in preferred driving styles. Furthermore, we just inve- stigated overtaking and driving behind a car. Due to the complexity of traffic and the number of manoeuvres necessary users have to adjust a lot of dif- ferent parameters in total. Especially users with low technical affinity will most likely not be interested in adjusting many parameters. Thus, predefi- ned driving styles as initial settings may still be the best option. Especially, given the correlation between the results of the subjective driving style que- stionnaire (s. Table 2) and the chosen pre-set driving style. We defined the possible bounds for the parameter configurations before the second study. It has to be ensured, that no parameter sets exist that may create safety-critical situations for the user. HAVs will have a great impact on our society and can potentially reduce safety-critical situations. A fast and smooth adoption of the technology is desirable. To achieve such an adoption the users should feel safe and comfortable during the use of these HAVs. Giving the users the possibility to adjust the HAV’s driving style to their liking may help the wide adoption and acceptance of the technology.
ACKNOWLEDGMENT
This work was supported by the Deutsche Forschungsgemeinschaft (DFG) under grant numbers RI 1511/3-1 to JR, LU 1880/3-1 to AL and FR 2715/4-1 to MF.
REFERENCES
Beggiato, M., Hartwich, F., Schleinitz, K., Krems, J., Othersen, I., & Petermann- Stock, I. (2015). What would drivers like to know during automated driving? Information needs at different levels of automation. In 7. Tagung Fahrerassi- stenzsysteme. Bock, J., Krajewski, R., Moers, T., Runde, S., Vater, L., & Eckstein, L. (2020,
October). The ind dataset: A drone dataset of nat-uralistic road user trajecto- ries at german intersections. In 2020 IEEE Intelligent Vehicles Symposium (IV) (pp. 1929–1934). IEEE. Chiou, E. K., & Lee, J. D. (2021). Trusting automation: Designing for responsivity and resilience. Human factors, 00187208211009995. Cho, Y., Park, J., Park, S., & Jung, E. S. (2017). Technology acceptance modeling
based on user experience for autonomous vehicles. Journal of the Ergonomics Society of Korea, 36(2), 87–108. Hartwich, F., Beggiato, M., & Krems, J. F. (2018). Driving comfort, enjoyment and acceptance of automated driving–effects of drivers’ age and driving style familiarity. Ergonomics, 61(8), 1017–1032. Hartwich, F., Witzlack, C., Beggiato, M., & Krems, J. F. (2019). The first impression
counts–A combined driving simulator and test track study on the development of trust and acceptance of highly automated driving. Transportation research part F: traffic psychology and behaviour, 65, 522–535.
Investigation of Graphical User Interfaces for Online Driving Style Customization 535
Hartwich, F., Schmidt, C., Gräfing, D., & Krems, J. F. (2020, July). In the passenger seat: Differences in the perception of human vs. automated vehicle control and resulting HMI demands of users. In International Conference on Human-Computer In-teraction (pp. 31–45). Springer, Cham. Hartwich, F., Hollander, C., Johannmeyer, D., & Krems, J. F. (2021). Improving
passenger experience and Trust in Automated Vehicles through user-adaptive HMIs: “The more the better” does not apply to everyone. Frontiers in Human Dynamics, 38. Krüger, H. P., Grein, M., Kaussner, A., & Mark, C. (2005, November). SILAB-A task-oriented driving simulation. In Driving Simulation Conference. Krefting, I., Trende, A., Unni, A., Rieger, J., Luedtke, A., & Fränzle, M. (2021,
September). Evaluation of graphical hu-man-machine interfaces for turning mano- euvres in automated vehicles. In 13th International Conference on Automotive User Interfaces and Interactive Vehicular Applications (pp. 77–80). Sagberg, F., Selpi, Bianchi Piccinini, G. F., & Engström, J. (2015). A review of research on driving styles and road safety. Human factors, 57(7), 1248–1275. Sun, X., Li, J., Tang, P., Zhou, S., Peng, X., Li, H. N., & Wang, Q. (2020). Exploring
personalised autonomous vehicles to influence user trust. Cognitive Computation, 12(6), 1170–1186. Taubman-Ben-Ari, O., Mikulincer, M., & Gillath, O. (2004). The multidimensional driving style inventory—scale construct and validation. Accident Analysis & Prevention, 36(3), 323–332. Trende, A., Gräfing, D., & Weber, L. (2019, September). Personalized user profi-
les for autonomous vehicles. In Proceedings of the 11th International Conference on Automotive User Interfaces and Interactive Vehicular Applications: Adjunct Proceedings (pp. 287–291). Yusof, N. M., Karjanto, J., Terken, J., Delbressine, F., Hassan, M. Z., & Rauterberg, M. (2016, October). The exploration of autonomous vehicle driving styles: preferred longitudinal, lateral, and vertical accelerations. In Proceedings of the 8th in-ternational conference on automotive user interfaces and interactive vehicular applications (pp. 245–252).
Read this individual research paper free through the original publisher, or explore the full digital proceedings book.
ISBN 978-1-958651-87-2
Explore this ISBN in the AHFE Bookstore ↗Listed in the July 2026 bookstore catalogue; search by ISBN to confirm current availability · Digital book purchase optional