Akhila Bairy, Mehrnoush Hajnorouzi, Astrid Rakow, Martin Fränzle, Maike Schwammberger (2025). Timing Matters - The Role of Timing in Explanation Delivery. In: Human Systems Engineering and Design (IHSED2025): Future Trends and Applications. AHFE Open Access, vol. 198, pp. 247–258. https://doi.org/10.54941/ahfe1006782
With the rapid advancements of autonomous systems and their integration into everyday life, explainability has become essential for fostering user trust and promoting effective human–system collaboration. However, the utility of explanations depends not only on content but also on timing. Prior research shows that pre-action explanations improve trust and understanding, yet the optimal timing remains unclear—especially under varying cognitive workloads.Building on our earlier theoretical framework based on the SEEV (Salience, Effort, Expectancy, Value) attention model, we empirically tested optimal timing through a two-phase interactive game. In Phase 1, participants completed a Reaction Time Determination task, responding to colour–word cues to establish a baseline for processing minimal instructions. In Phase 2, the Reactive Game, participants collected coins of a target colour indicated by a brief cue, requiring quick interpretation amid distractions.Seventeen participants (mean age 44.7 years, SD = 16.4) completed the study. Analysis of the gameplay data revealed an average reaction time of 2.58s to act on explanations—closely matching the 3s window predicted by our prior model. Subjective workload was evaluated using the NASA-TLX, which indicated moderate mental and temporal, low physical strain, and significant correlations between mental demand, effort, and frustration—highlighting the impact of timing on cognitive load.This study contributes to human-centred system design by providing evidence-based insights into optimising explanation timing for improved user comprehension and performance. The approach shows how explanation strategies can be informed by cognitive models and validated in interactive, user-centred settings. Future work will explore adaptive, context-aware explanations tailored to individual cognitive states.
Autonomous and intelligent systems are increasingly used in a variety of application domains. In the area of autonomous driving, SAE level-3 (SAE International, 2021) vehicles have obtained permits to operate on public roads in the United States (Mercedes-Benz Group, 2023). However, for such autonomous systems to achieve widespread public acceptance, it is essential to build user trust. One effective approach to achieving that is through providing explanations (Markus et al., 2021) (Ferrario & Loi, 2022).
That said, merely providing an explanation is not sufficient. The timing of explanations plays a crucial role in their effectiveness (van Maris et al., 2017) (Rossi et al., 2020). Prior work shows that explanation timing affects both trust and users’ mental workload (Koo et al., 2016) (Haspiel et al., 2018) (Du et al., 2019), with pre-action explanations being particularly helpful in high-risk situations. Despite this, the optimal timing for delivering pre-action explanations remains unclear. Recent theoretical frameworks have proposed timing strategies based on mental workload (Bairy & Fränzle, 2023) (Bairy & Fränzle, 2024), modelled using the SEEV attention model (Wickens et al., 2001). Yet, these have not been tested empirically in user-centred scenarios. To address this, we conducted a controlled user study using an interactive game to answer the question: How early should a simple explanation be provided to ensure that the user has enough time to comprehend it? The study consisted of two tasks. In the Reaction Time Determination phase, participants responded to colour-word cues to establish a reaction time baseline. In the Reactive Game, participants controlled an avatar to collect coloured coins, guided by brief explanations (e.g., colour names). This setup allowed us to measure how long users took to process and act on simple, time-sensitive explanations. We also collected NASA-TLX ratings to assess subjective workload (Hart & Staveland, 1988).
Our paper is organised as follows: We first review related literature and outline the research gap. Next, we present the study setup and design, followed by data collection and results analysis. We then discuss key implications and limitations, and conclude with directions for future research.
RELATED WORK
Our research lies at the intersection of explanation timing and mental workload. This section provides a brief overview of relevant work in these areas, with a focus on autonomous driving and cognitive science.
Explanation Timing in Autonomous Driving: In time-critical domains such as autonomous vehicles (AVs), the timing of explanations plays a crucial role. Explanations can enhance user trust, especially in high-stakes situations. Shen et al. (2020) found that users primarily seek explanations during critical moments, such as near-collisions. Similarly, (Ruijten et al., 2018) emphasized that well-timed explanations can reduce cognitive strain and support better decision-making. Koerber et al. (2018) showed that delaying explanations— for example, 14s after a takeover request—can actually improve situational awareness. Kim et al. (2023) developed TimelyTale, a multimodal dataset aimed at predicting when passengers most need explanations. Further work by the same group showed that explanations aligned with perceived traffic risks enhance the passenger experience without increasing cognitive load.
When to Explain: Before or After? Research in cognitive science suggests that early stimuli can improve performance on repetitive tasks, while late stimuli may increase error rates (Grosjean et al., 2001). Building on this, (Chen et al., 2024) explored how explanation timing—before, after, both, or none—affects trust, comprehension, and satisfaction in AI systems. They
Timing Matters - The Role of Timing in Explanation Delivery 249
found that pre-action explanations are particularly helpful for anticipating bias, while post-action explanations support retrospective understanding. Combining both approaches led to more accurate trust calibration.
Timing and User Experience: While not the main focus of this study, explanation timing also intersects with user experience (UX) research. Recent work suggests that explanations can enhance UX when timed appropriately (Deters et al., 2024), but may harm it if poorly executed. For instance, (Elbitar et al., 2021) demonstrated that the timing and rationale behind permission requests significantly influence user decisions and their evaluation of the system. Although this work offers valuable insights, integrating explanation timing into UX design falls outside the scope of our current study.
TECHNICAL DETAILS AND STUDY SET-UP This study aims to determine how early a brief explanation should be provided to give users enough time to understand and act on it. We built a two-part interactive game to simulate explanation delivery in a controlled environment. Participants engaged in two phases: (1) a reaction time task and (2) a reactive game requiring quick responses to changing instructions. A final subjective workload assessment (NASA Task Load Index) was conducted.
The study was implemented using GDevelop 5 (Rivial et al., 2021), an open-source, no-code platform, chosen for its flexibility and reliable event tracking. Though the game currently runs offline, it is designed for scalable deployment, including future online adaptation. Participants interacted with the game using arrow keys on a standard laptop keyboard. At the start, participants selected their language (English or German), and then proceeded through the study using a consistent interface in their chosen language. All actions were logged and timestamped for later analysis.
STUDY DESIGN This study examined how long users need to comprehend simple explanations in a gamified setting. We define simple explanations as those that place minimal cognitive load on users—typically one or two words, such as “Stop!” or “Turn Left”. To support understanding, participants first received a detailed explanation of the game. During gameplay, they received brief, simplified instructions based on the initial explanation. This two-step approach follows Krull’s framework (Krull, 1999), which suggests that understanding is most effective when preceded by an explanation, followed by clear, actionable instruction.
Embedding the study in a game allowed us to create a controlled yet engaging environment. This setup helped simulate real-world scenarios requiring timely explanations, enabling us to observe how explanation timing influences user performance, adaptability, and cognitive effort. Participants’ reaction times and decision accuracy were measured under varying levels of cognitive demand.
The study consisted of three parts:
1. Reaction Time Determination: Participants responded to colour-word instructions mapped to specific arrow keys (e.g., left arrow for “red”). This task established a reaction time baseline and tested their ability to link visual stimuli with motor responses. 2. Reactive Game: Building on the first task, participants collected coins matching a target colour in a dynamic, multi-lane environment. Instructions were periodically updated, requiring real-time adjustments. A practice round preceded the experimental round. Performance data— including reaction time and decision accuracy—was recorded. 3. Subjective Evaluation: After gameplay, participants completed the NASA Task Load Index (NASA-TLX), rating their experience across six workload dimensions: mental, physical, and temporal demand, effort, performance, and frustration. These ratings provided insight into perceived task difficulty, complementing the objective performance data.
At the end of each game, we recorded reaction times and adaptability to changing instructions to assess the effect of explanation timing on decision- making. Detailed descriptions of each study component are as follows.
Reaction Time Determination Task This phase included two rounds: a test round and an experimental round, aimed at establishing baseline reaction times in response to visual instructions.
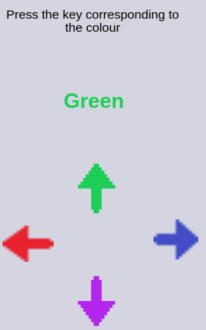
Test Round: Participants were introduced to the game mechanics and practiced the task to become familiar with the setup. No data were collected from this round. Instructions (colour names) were displayed for 5s, each mapped to a specific arrow key (up, down, left, right). The mappings appeared below the instruction, and participants had to press the corresponding key (See Fig. 1). This task assessed the basic ability to process visual input and translate it into motor responses.
Figure 1: A snapshot of an instance in the reaction time determination task.
Timing Matters - The Role of Timing in Explanation Delivery 251
Experimental Round: This phase involved four sub-rounds, each focusing on one arrow key direction. Colour-direction mappings were randomized in each sub-round to prevent memorization. Instructions were shown for 5s, with a 2s pause between sub-rounds. Participants pressed the arrow key corresponding to the displayed colour as quickly as possible. A “key pressed” message confirmed correct responses. To increase task difficulty, a shaking arrow pointing in a different direction appeared alongside the instruction, acting as a distraction. This was designed to simulate higher cognitive load and test participants’ ability to focus despite conflicting visual cues. Reaction times and error rates were recorded throughout, offering insights into how explanation timing and distractions affect user performance and decision-making.
Reactive Game The second phase introduced a more dynamic task—a reactive game— designed to assess participants’ ability to respond to changing instructions while managing multiple visual elements. Like the first phase, it consisted of a test round for familiarization and an experimental round for data collection.
Test Round: Participants practiced the game by collecting coloured coins using an avatar across three lanes. Instructions (colour names) appeared for 2s, followed by a 10s window to collect the correct coin. The test round lasted 45s and ensured participants understood the controls and task flow. No data were recorded during this phase.
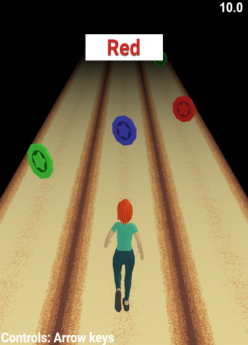
Experimental Round: In the main round, participants used the left/right arrow keys to move between lanes and collect coins matching the target colour displayed at the top of the screen (e.g., “Red”/”Rot”) (See Fig. 2). Target colours changed periodically, requiring real-time strategy adjustments. The round lasted 85s. Each instruction was shown for 2s, followed by 9s of gameplay, testing memory and adaptability without constant interruptions.
Figure 2: A snapshot of the reactive game.
Coloured coins appeared randomly in all lanes, increasing the need for quick decisions. The game rewarded accurate coin collection, and participants continued navigating until the next instruction appeared. Reaction times, accuracy, and scores were recorded to evaluate performance. This phase offered insights into how participants processed changing instructions, retained prior cues, and managed cognitive workload in a fast-paced, visually dynamic environment.
Subjective Evaluation Using NASA Task Load Index The final part of the study gathered participants’ feedback on perceived workload using the NASA Task Load Index (NASA-TLX) form (Hart & Staveland, 1988)1. Developed by Hart and Staveland, NASA-TLX is a validated tool widely used in domains like aviation, healthcare, and HCI to assess subjective workload.
NASA-TLX evaluates workload across six dimensions, each rated on a scale:
Mental Demand: Level of cognitive effort required.
Physical Demand: Degree of physical exertion.
Temporal Demand: Time pressure felt during the task.
Performance: Self-assessment of task success.
Effort: Overall mental and physical effort invested.
Frustration: Stress, irritation, or annoyance experienced.
These ratings helped identify which aspects of the task were most demanding and complemented the objective performance data.
DATA COLLECTION In this study, data collection focused on key metrics related to reaction time, performance, and demographics, following the university ethics board’s guidelines. The data types included:
1. Reaction Time: Phase 1 (Reaction Time Determination): Measured response times to colour cues via arrow key presses, establishing baseline performance. Phase 2 (Reactive Game): Captured reaction times during gameplay as participants collected coins matching target colours, enabling comparison with Phase 1. 2. Game Score: Recorded in Phase 2 based on the number of correctly collected target-coloured coins, reflecting participants’ task accuracy and response under dynamic conditions. 3. Demographic Information: Age and gender were collected to identify potential performance patterns. 4. User Feedback: Participants completed NASA-TLX forms after gameplay to report perceived workload across cognitive and emotional dimensions.
1See NASA-TLX form at: https://humansystems.arc.nasa.gov/groups/tlx/downloads/TLXScale.pdf (last accessed 04/25).
Timing Matters - The Role of Timing in Explanation Delivery 253
RESULTS AND ANALYSIS This section presents findings from both phases, focusing on reaction times, explanation timing, and subjective workload. The study involved 17 participants (mean age = 44.7, SD = 16.4; 10 female, 7 male), offering reasonable gender balance for analysis.
Reaction Time Analysis In Phase 1 (Reaction Time Determination), participants showed varying reaction times based on arrow direction. The down arrow had the slowest average (3.16s), suggesting it was less intuitive. The up arrow was fastest at 1.2s. In Phase 2 (Reactive Game), the average reaction time across trials was 2.58s, closely matching the prior model’s predicted 3s optimal window for effective explanation processing (Bairy & Fränzle, 2024). This suggests participants could comprehend and act on explanations within this window. To support model assumptions and be consistent with (Bairy & Fränzle, 2024), two key factors were controlled:
Salience: Explanations were shown consistently in format and location, reducing confusion.
This consistency contributed to stable reaction times and validated the model’s 3s timing threshold.
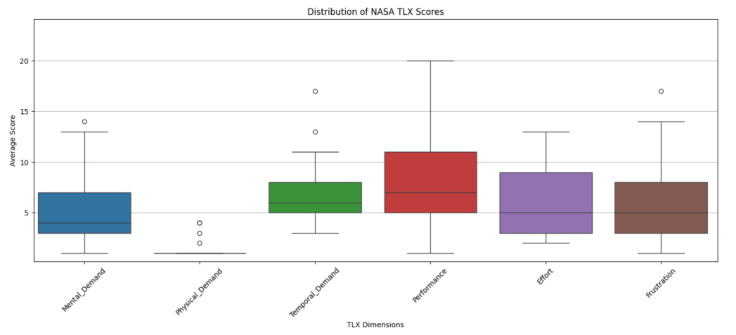
User Feedback (NASA-TLX) Participants completed the NASA-TLX after the study. Fig. 3 shows median scores across six workload dimensions. Some of the key findings from NASA- TLX scores are given below:
Physical Demand was rated lowest—expected due to simple arrow-key tasks.
Mental Demand was moderate, indicating cognitive engagement with colour-matching and decision-making.
Temporal Demand & Effort scored moderately, reflecting time pressure and sustained focus.
Performance & Frustration varied: while some felt confident, others reported frustration, linked to difficulty meeting goals.
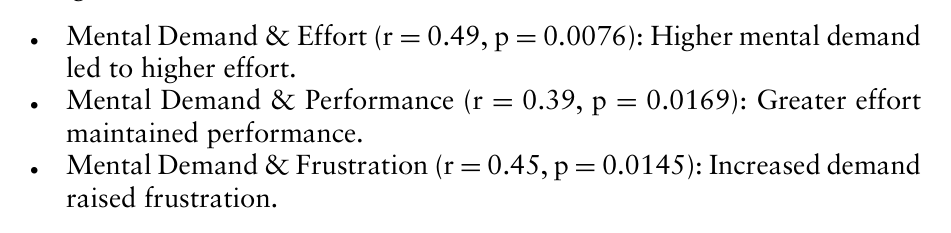
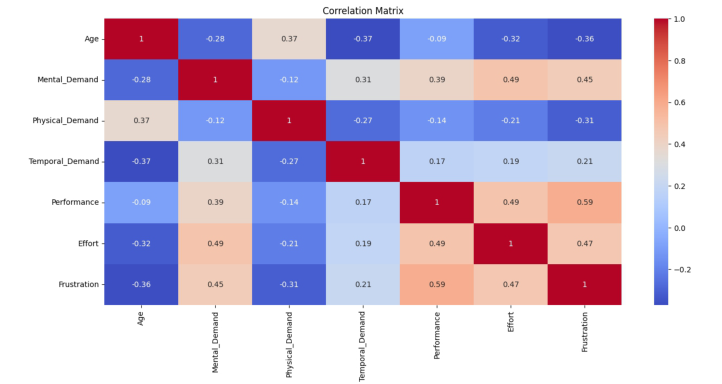
The correlation matrix, shown in Fig. 4, provides insights into relationships between demographic data and their perceived workload, obtained from NASA-TLX variables. The results can be categorized into significant and marginally significant correlations.
Significant Correlations:
Equation reproduced from the original PDF.Figure 3: Boxplot of NASA-TLX scores across dimensions.Figure 4: Correlation matrix of NASA-TLX scores and demographic data.
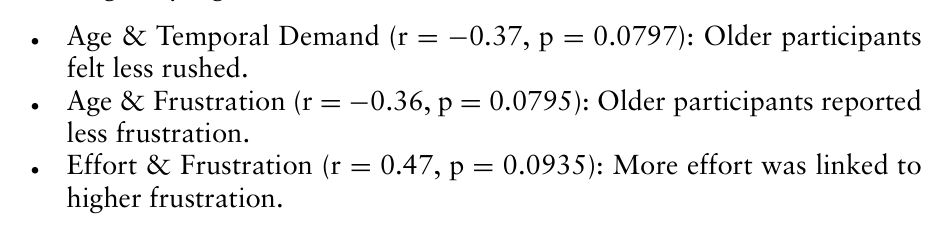
Marginally Significant Correlations:
Equation reproduced from the original PDF.
Although not all correlations reached statistical significance, the results suggest patterns that merit further exploration with larger samples. While physical demands were low, the task imposed moderate cognitive load, particularly under time pressure. The controlled design and timing analysis support the 3s window as a baseline for effective explanation delivery.
Timing Matters - The Role of Timing in Explanation Delivery 255
DISCUSSION
This study shows that even simple, single-word explanations can serve as a valuable baseline for identifying the minimum lead time users need to act. While not a complete solution, this minimalist approach provides a foundation for designing explanations in time-critical systems like autonomous vehicles (AVs), where timing is crucial (Bairy & Fränzle, 2024). Understanding this baseline is necessary before introducing richer, context- aware explanations, which may vary in effectiveness depending on users’ cognitive capacity, stress, or familiarity with automation. As added context increases complexity, it becomes essential to balance informativeness with cognitive load.
Collected data—reaction times, game scores, and demographics—enabled performance and workload assessment without overwhelming participants. Reaction time was particularly insightful: the slowest average (3.16s) for the down arrow suggested higher cognitive or motor effort, while the 2.58s average during explanation trials aligned closely with the model’s predicted 3s optimal window. This supports the idea that users need at least 3s to process a simple explanation under moderate cognitive load.
NASA-TLX scores further clarified workload effects. Mental demand correlated significantly with effort (p = 0.0076) and frustration (p = 0.0145), reinforcing that increased cognitive complexity raises perceived effort and emotional strain. Age showed moderate but not always significant correlations with temporal demand and frustration. These results emphasize the importance of managing cognitive load when designing explanations for real-time systems.
While the participant group was diverse in age (M = 44.7, SD = 16.4) and included 10 women, the small sample size (n = 17) limits generalizability. Future studies with larger, more balanced samples are needed for stronger validation.
The study was conducted in a city-centre university shop, which increased ecological validity by exposing participants to real-world distractions like noise and foot traffic. Although this introduced some variability, it showed that users can still engage meaningfully with explanations in naturalistic settings.
Limitations include the gamified design, which, while useful for engagement and consistency, does not replicate the complexity or stakes of real-world AV use. Abbreviated explanations (instructions) isolated baseline timing but offer limited insight into responses to richer or adaptive content. Also, NASA-TLX ratings are subjective and may introduce bias. Nonetheless, the task’s simplicity provided a clear view of baseline comprehension thresholds.
Future work should explore adaptive explanation timing and content based on real-time user state, ideally in simulators or real AV contexts. It will also be important to determine when added context becomes counterproductive—offering just enough information to be helpful without overwhelming the user.
CONCLUSION
This study investigated participants’ reaction times, performance, and subjective workload during two phases of a controlled experiment. By analysing baseline reaction times in a simple cue-response task (phase 1) and comparing them to dynamic reaction times during a game-based setting with explanations (phase 2), the study validated the predicted 3s optimal timing window for processing explanations. Controlled factors such as Salience and Effort were critical in maintaining consistent participant responses and also ensuring the reliability of the findings.
The NASA-TLX data reinforced that the task imposed moderate mental and temporal demands, with minimal physical effort. Correlation analysis revealed meaningful relationships between cognitive workload components—most notably, that higher mental demand was significantly associated with increased effort and frustration. While age showed moderate correlations with several workload measures, the small sample size limits the strength of demographic conclusions.
While this study establishes a strong foundation for understanding reaction times and workload in controlled environments, there are several opportunities for further exploration. Notably, the game was designed with future scalability in mind, allowing for expansion into online studies. A natural next step would be to implement an online version of the study and evaluate whether the results differ when conducted in a less controlled, remote setting.
Future research could also investigate the impact of varying explanation lengths to determine how the content and complexity of an explanation influence the optimal timing for its delivery. Additionally, studies could explore the effects of different salience factors, such as changes in font size, colour, or the placement of explanations, on participants’ reaction times and perceived workload.
ETHICAL CONSIDERATIONS This study followed university ethical guidelines. Participants signed a consent form outlining the study’s purpose, data collected (e.g., reaction times, scores, demographics), and their right to withdraw. All data were pseudonymized using unique codes (codelist) stored securely and separately from research data, accessible only to authorized personnel. No personally identifiable information was recorded. Personal data, including the codelist, was deleted by December 31, 2024; anonymized data is retained for research purposes. Only individuals aged 18+ participated, ensuring relevance to AV contexts, where the legal driving age in Germany is 18.
ACKNOWLEDGMENT
The research here is supported by the Helmholtz Association within the Core Informatics project.
Timing Matters - The Role of Timing in Explanation Delivery 257
REFERENCES
Bairy, A. & Fränzle, M., 2023. Optimal Explanation Generation Using Attention Distribution Model. Human Interaction and Emerging Technologies (IHIET-AI 2023): Artificial Intelligence and Future Applications, Volume 70. Bairy, A. & Fränzle, M., 2024. Efficiently Explained: Leveraging the SEEV
Cognitive Model for Optimal Explanation Delivery. Applied Human Factors and Ergonomics (AHFE 2024), Volume 148. Chen, C., Liao, M. & Sundar, S. S., 2024. When to Explain? Exploring the Effects of Explanation Timing on User Perceptions and Trust in AI systems. s.l., ACM. Deters, H. et al., 2024. The X Factor: On the Relationship between User eXperience
and eXplainability. s.l., Association for Computing Machinery. Du, N. et al., 2019. Look who’s talking now: Implications of AV’s explanations on driver’s trust, AV preference, anxiety and mental workload. Transportation Research Part C: Emerging Technologies, Volume 104, pp. 428–442. Elbitar, Y. et al., 2021. Explanation Beats Context: The Effect of Timing &
Rationales on Users’ Runtime Permission Decisions. s.l., USENIX Association, pp. 785–802. Ferrario, A. & Loi, M., 2022. How Explainability Contributes to Trust in AI. s.l., Association for Computing Machinery, pp. 1457–1466. Grosjean, M., Rosenbaum, D. & Elsinger, C., 2001. Timing and Reaction Time.
Journal of experimental psychology. General, 6, Volume 130, pp. 256–272. Hart, S. G. & Staveland, L. E., 1988. Development of NASA-TLX (Task Load Index): Results of Empirical and Theoretical Research. Human Mental Workload, Volume 52, pp. 139–183. Haspiel, J. et al., 2018. Explanations and Expectations: Trust Building in Automated
Vehicles. s.l., ACM, pp. 119–120. Kim, G. et al., 2023. What and When to Explain?: On-road Evaluation of Explanations in Highly Automated Vehicles. Proc. ACM Interact. Mob. Wearable Ubiquitous Technol., Volume 7. Koerber, M., Prasch, L. & Bengler, K., 2018. Why Do I Have to Drive Now? Post
Hoc Explanations of Takeover Requests. Hum. Factors, Volume 60, pp. 305–323. Koo, J., Shin, D., Steinert, M. & Leifer, L., 2016. Understanding driver responses to voice alerts of autonomous car operations. International Journal of Vehicle Design, 01. Krull, R., 1999. Science, explanation, instruction. s.l., Communication Jazz:
Improvising the New International Communication Culture, pp. 315–323. Markus, A. F., Kors,. J. A. & Rijnb, P. R., 2021. The role of explainability in creating trustworthy artificial intelligence for health care: A comprehensive survey of the terminology, design choices, and evaluation strategies. Journal of Biomedical Informatics, Volume 113, p. 103655. Mercedes-Benz Group, 2023. Benz World’s First Automotive Company to certify
SAE Level 3 system for U. S. market: Mercedes-Benz Group. s.l.: s.n. Rivial, F. et al., 2021. GDevelop 5. [Online] Available at: https://editor.gdevelop.io/ [Accessed 2024]. Rossi, A. et al., 2020. Evaluating People’s Perceptions of Trust in a Robot in a
Repeated Interactions Study. s.l., s.n., pp. 453–465. Ruijten, P. A. M., Terken, J. M. B. & Chandramouli, S., 2018. Enhancing Trust in Autonomous Vehicles through Intelligent User Interfaces That Mimic Human Behavior. Multimodal Technol. Interact., Volume 2. SAE International, 2021. Taxonomy and Definitions for Terms Related to Driving
Automation Systems for On-Road Motor Vehicles J3016\_202104, s.l.: s.n.
Shen, Y. et al., 2020. To Explain or Not to Explain: A Study on the Necessity of Explanations for Autonomous Vehicles. CoRR. van Maris, A., Lehmann, H., Natale, L. & Grzyb, B. J., 2017. The Influence of a
Robot’s Embodiment on Trust: A Longitudinal Study. s.l., s.n., pp. 313–314. Wickens, C. et al., 2001. Pilot Task Management: Testing an Attentional Expected Value Model of Visual Scanning. Savoy, IL, UIUC Institute of Aviation Technical Report.
LISTED IN THE AHFE DIGITAL BOOKSTORE CATALOGUE
Explore the complete digital volume
Human Systems Engineering and Design (IHSED2025): Future Trends and Applications
Read this individual research paper free through the original publisher, or explore the full digital proceedings book.
ISBN 978-1-964867-74-8
Explore this ISBN in the AHFE Bookstore ↗Listed in the July 2026 bookstore catalogue; search by ISBN to confirm current availability · Digital book purchase optional