Constantin Jomir, Alexandra - Gabriela Ene, Mihaela Jomir, Carmen Mihai (2023). Data Analysis for the Projection of Flexible Composite Materials to Naval Transport Scenarios. In: Human Interaction and Emerging Technologies (IHIET-AI 2023): Artificial Intelligence and Future Applications. AHFE Open Access, vol. 70, pp. 163–170. https://doi.org/10.54941/ahfe1002940
Accidental spills of oil or other types of hydrocarbons represent a problem of utmost importance, but, in the situation where a multi-criteria approach to the phenomenon is desired, it is necessary a quickly intervention for mitigate the effects of their spread, and for isolation, collection, transportation and storeage for reprocessing. In case of oil recovering, trapped oil can be pumped out to holding tanks (shuttles) for transporting to shore. The functional characteristics required for naval transport are represented by the: operational in strong sea currents oil spill recovery (min. 4bf), transport and storage (at min. 2kt); rapid response in an emergency (possibility to be used in max. 1 h in conjunction with oil spill recovery equipment: vessel, booms, skimmers etc). Although it could be considered that the tear resistance on the longitudinal and transversal system for any composite structure including a textile matrix based on woven structure, could be influenced by the physical-mechanical characteristics of the textile reinforcement (the nature of the raw material and the diameter of the threads), in the situation of usage the flexible elements (narrow fabrics) to join the panels, the correlation between the above mentioned parameters could be made only by mathematical approaches. This assumption is based on the fact that in the textile field, the mechanism of deformation of threads and implicitly of planar structures is not fully explained (as in the field of constructions). The paper presents the analysis of the data collection, with the help of multiple regression, each of the 6 dependent variables (tear resistance values assessed according to three accredited methods in longitudinal and transversal systems) being modeled with the help of 5 independent variables (resistance to maximum force breaking strength, knot resistance, loop for two types of sewing thread and the breaking resistance of composite material fabrics). For the 3500 values obtained as a result of the experiments carried out, the initial hypotheses were related to: i) the experience matrix (u observations for q variables) is fixed, it is not stochastic, and the number of experiences is greater than the number of variables and ii ) the matrix of measured values for the independent variables has linearly independent columns, so it forms a basis of a q-dimensional space. The main problems followed were related to the model parameters, measurement errors, adjustment precision and the choice of the prediction model. The built probabilistic models explain between 55-80% of the variation of the dependent variable, so it would be indicated to introduce additional variables (e.g. for composite material with 45/55% PES/p-aramida matrix) of the type: pattern of the fabric, yarn density in warp and weft, coating thickness. Additionally, the values obtained for the t test identified the importance of the predictors placed in the multivariate regression equations.
The functional characteristics required for naval transport are represented by the operational in strong sea currents oil spill recovery (min. 4bf), transport and storage (at min. 2kt); rapid response in an emergency (possibility to be used in max. 1 h in conjunction with oil spill recovery equipment: vessel, booms, skimmers). (Bucholz A. et al. 2016, Schmidt E.D et al. 2021, Lehr B. et al. 2010, Al-Majed et al. 2012). Although it could be considered that the tear resistance on the longitudinal and transversal system for any composite structure including a textile matrix based on the woven structure could be influenced by the physical- mechanical characteristics of the textile reinfo- rcement (the nature of the raw material and the diameter of the threads), in
the situation of using the flexible elements (narrow fabrics) to join the pan- els, the correlation between the above mentioned parameters could be made only by mathematical approaches. This assumption is based on the fact that in the textile field, the mechanism of deformation of threads and implicitly of planar structures is not fully explained (as in the field of constructions) (Anisuddin S. et al. 2005).
MATERIALS AND METHODS
Experiments were carried out in the ISO accredited laboratories for 2 vari- ants of composite material which have as reinforcement 2 planar structures made of yarns with special characteristics. The resulting database being was populated with 3500 values representing: resistance to breaking, breaking, knot and loop for the 2 types of yarns resistance, tearing with fin, tongue, trouser and tape tests both for the longitudinal system and for the transverse system in the case of 2 composite materials. Experiments consisted in:
- determination of the tearing force of a flexible material (composite with textile matrix), where the sample had the shape of “trousers” (SR EN ISO 13937-2:2001). This type of experimentation is justified by the fact that in real conditions of use of the composite material, it can break in the direction of the force (the force is applied parallel to the split);
- checking the tear resistance of the material in the situation where in real conditions two tears can be initiated due to a force applied parallel to the notches, in the same direction as the tearing force. For this, the samples were cut in the shape of a “tongue”, according to SR EN ISO 13937-4:2003;
- assessment of the tearing force of the composite material for the specimen cut in the form of a “wing” (for a predetermined angle of 45
). The wing test was performed, in to obtain double scores for this evaluation. Such a request can rise in the situation where the handling of the transport shuttle moves in a sea of 8Bf;
- determination of knot and loop resistances for para-aramid (930 dtex/1000f x 1) and polyester (1100 dtex/192 × 1/125Z) yarns for predi- cting the tear resistance of the textile material used as reinforcement of the composite material and implicitly of the composite material used to make the shuttle.
The main characteristics evidenced during the experimental trials, as well as the number of determinations used for each variable, are presented in Table 1.
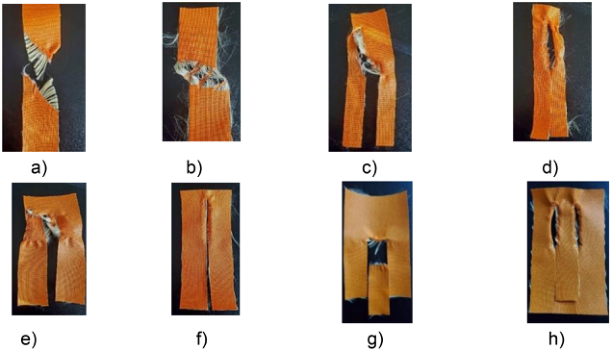
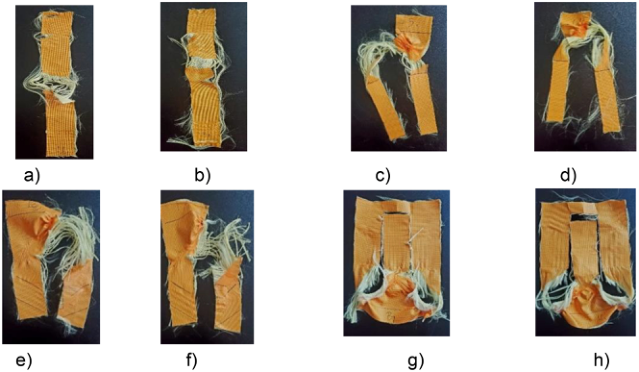
Aspects during the experimental trials achieved for flexible materials with textile matrix are presented in figures 1 and 2.
The prediction of the main engineering characteristics was achieved by going through the following steps: i) identification of dependent and independent variables (specified for each mathematical model) (Eckle P. et al. 2012) - Table 2
ii) definition, with the help of specialized software, of the multivariate regression equations for 5 predictors, of the type: Ÿ = B0 + B1 ∗X1 + B2 ∗X 2 + ... + Bn ∗Xn (1)
Data Analysis for the Projection of Flexible Composite Materials 165
Table 1. Technical data of variants of structures and yarns for composite materials achievement and the performed analyses.
Table available in the original PDF paper.
Experiments Composite Material 1 (CM1)
Composite Material 2 (CM2) Yarns Raw material:Warp 100% polyester 100% p-aramid Raw material:Weft 100% p-aramid 100% p-aramid Length of density: Warp 1100dtex/192fx1/125Z 930dtex/1000fx1 Length of density: Weft 930dtex/1000fx1 930dtex/1000fx1
Figure 1: Tests at the level of the CM1: a) warp strip sample; b) weft strip sample; c) warp trouser sample; d) weft trouser sample; e) warp wing sample; f) weft wing sample; g) warp tongue sample; h) weft tongue sample.
where: B0 = constant of the model; B1……..Bn = unstandardized regression coefficients, calculated for each independent variable separately.
The 12 regression equations were determined under the condition that all independent variables (predictors) were treated as a common block of variables and were entered as such in the analysis. Thus, the equations and
Figure 2: Tests at the level of the CM2: a) warp strip sample; b) weft strip sample; c) warp trouser sample; d) weft trouser sample; e) warp wing sample; f) weft wing sample; g) warp tongue sample; h) weft tongue sample.Table 2. Dependent and independent variables.
Maximum breaking strength in weft Breaking resistance warp yarn x x x Breaking resistance weft yarn x x x Knot resistance warp yarn x x x Knot resistance weft yarn x x x Loop resistance warp yarn x x x Loop resistance weft yarn x x x x
confidence intervals for the unstandardized regression coefficients, corre- sponding to the probability of 95% [lower bound; upper bound] are:
- for CM1 Tearing force (tongue) in warp = −1170 + 1.1 * maximum breaking strength in weft +22.5 * breaking resistance P-aramid + 6.7 * breaking resistance PES and CI [−3274; 934] Tearing force (tongue) in weft = 853 – 0.87 * maximum breaking strength in weft -49* breaking resistance P-aramid + 31* loop resistance P-aramid – 4.6 * loop resistance PES [−1460.7; 3168.4] Tearing force (wing) in warp = 683.5 + 0.2 * maximum breaking strength in warp −0.1 * loop resistance PES −6.1 * breaking resistance PES, [−312.6; 1679]
Data Analysis for the Projection of Flexible Composite Materials 167
Tearing force (wing) in weft = −321+ 1.3 * maximum breaking strength in weft −36.3* breaking resistance P-aramid [−1487; 3845.4] Tearing force (trouser) in warp = 1615 + 1.1 * maximum breaking strength in warp −0.5 * maximum breaking strength in warp −29.6 breaking resistance P-aramid + 11.6 * knot resistance P-aramid [433; 2797]
Tearing force (trouser) in weft = 1103 – 0.5* maximum breaking strength in warp −49* breaking resistance PES + 11.5* loop resistance PES, [−1147; 3352.4] - for CM2 Tearing force (tongue) in warp = 422.6 + 0.1 * maximum breaking strength in weft +0.1 * maximum breaking strength in warp −8 * breaking resistance P-aramid + 6.5 * loop resistance P-aramid [−1055; 1900] Tearing force (tongue) in weft = -219.8 +0.2 * maximum breaking strength in weft +33 * loop resistance P-aramid, [−2218; 1778]
Tearing force (wing) in warp = -180.3 + 0.7 * maximum breaking strength in weft +27.3* breaking resistance P-aramid [−880; 1519] Tearing force (wing) in weft = -288 – 0.11 * maximum breaking strength in warp −39.5 * knot resistance P-aramid + 25* loop resistance P-aramid, [−2323.3; 2694]
Tearing force (trouser) in warp = 1335.4 + 0.2 * maximum breaking strength in warp −21.6 * loop resistance P-aramid −9.2 * knot resistance P-aramid [−23.4; 934] Tearing force (trouser) in weft = -830 + 0.52 * maximum breaking strength in warp +0.38 * maximum breaking strength in warp +24* loop resistance P-aramid, [−2986; 1326]
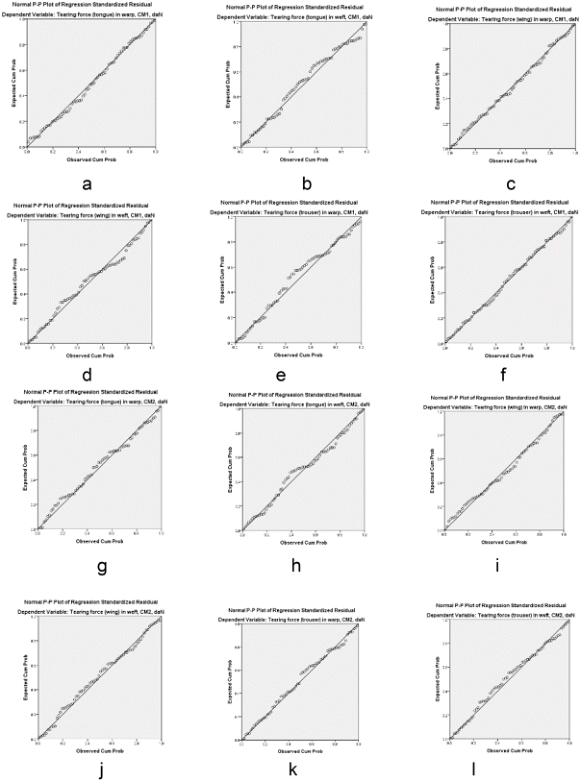
iii) drawing the graphs of the cumulative probabilities of the standard notes of the residues - Figure 3.
RESULTS AND DISCUSSIONS Analysing the data resulting from the testing of para-aramid and polyester yarns, it can be stated that:
- For the p-aramid thread, the knot resistance is reduced by approx. 46%, and for PES by 30%, the decrease was more pronounced in the first case, due to the increased chemical creep compared to other polymers. This phe- nomenon causes the splitting of the molecular chain, the break occurring due to the change in the supramolecular structure. (Seymour R.B. et al. 1992; Jones J., 1985; Adanur S., 1996). Moreover, the physical creep existing in other polymers is manifested by the sliding of macromolecules against each other, a phenomenon present to a small extent, due to the high crystallinity of para-aramid;
- The para-aramid thread “retains the information induced” (presents memory) by the fatigue phenomenon due to the mechanical stresses to which it was subjected and which determined changes in the structure of the fila- ments, a fact that explains the reductions in the values of breaking force and elongation at break.
The values of the multiple correlation coefficients demonstrate that the power of prediction of the results of the dependent variables (knowing the values of the predictor variables) is 78% – 91%.
Figure 3: Graphical representation of the standardised residual distribution compara- tive with the normal distribution: a, b, c, d, e – for composite material variant CM1; f, g, h, I, j, k, l - for composite material variant CM2.
The values of the quadratic multiple correlation coefficients evidenced the fact that 55% – 80% of the variation of the dependent variable (predicted) is explained by the model. It was demonstrated that the decrease in the number of predictive variants decreases the predictive power by approx. 15%.
Additionally, the variant analysis performed for each of the 6 dependent variables highlighted with a probability of error of 5% that all 12 math- ematical models created explain significantly much of the variation of the dependent variable. The values of the F grade demonstrate that the variation explained by the model is significantly higher than the residual one, so the created model is effective in prediction. The significance threshold for the F test had values in the range [0.001, 0.003] for all the mathematical models created.
Data Analysis for the Projection of Flexible Composite Materials 169
The points corresponding to the cumulative probabilities obtained from the regression equations follow those of the normal curve, so the created models are valid.
CONCLUSION
The built probabilistic models explain between 55-80% of the variation of the dependent variable, so it would be indicated to introduce additional vari- ables (e.g. for composite material with 45/55% PES/p-aramid matrix) of the type: pattern of the fabric, yarn density in warp and weft, coating thickness. Additionally, the values obtained for the t test identified the importance of the predictors placed in the multivariate regression equations.
The variant analysis carried out with the help of specialized software demonstrated that the scores that can be predicted by the created mathe- matical models can overestimate the reality (generally for small or medium values of the dependent variables, both for CM1 and for CM2).
The 12 mathematical equations developed will be the basis of the design of the experimental models of composite structures that will be used to create the naval unit used to transport hydrocarbons. The main structural parame- ters of the textile matrix will be established - reinforcement for the composite material.
ACKNOWLEDGMENT
This scientific paper is funded by the Ministry of Research, Innovation, Digi- talisation within Program 1 - Development of the national RD system, Sub- program 1.2 - Institutional Performance - RDI excellence funding projects, Contract no. 4PFE/2021.
REFERENCES
Adanur, S. (1996) - Wellington Sears Handbook of Industrial Textile, Technomic Publishing Company, Inc. Pennsylvania, SUA. Al-Majed A.A., Adebayo A.R., Hossain M.E., (2012) - A sustainable approach to
controlling oil spills, J. Environ. Manage., 113 (2012), pp. 213-227. Anisuddin S., Al-Hashar N., Tahseen S. (2005) Prevention of oil spill in seawater using locally available materials Arab. J. Sci. Eng., 30 (2B) (2005), pp. 143–151. Buchholz A., Krieger A, Rowe J., Etkin D.S., French-McCay D., Schroder Gea-
ron M., Grennan M, J. Turner J. (2016) Worst Case Discharge Analysis (Volume I): Oil Spill Response Plan (OSRP) Equipment Capabilities Review, BPA No. E14PB00072, Prepared for US Department of the Interior Bureau of Safety and Environmental Enforcement (BSEE) (2016). Eckle P., Burgherr P., Michaux E. (2012) Risk of large oil spill: a statistical analysis in the aftermath of Deepwater Horizon Environ. Sci. Technol., 46 (2012), pp. 13002–13008. Jones, J. (1985) - High Technology Fibres. Part.A (M Lewis and J. Preston Eds),
Marcel Dekker, Inc., New York, SUA.
Lehr B., Bristol S., Possolo A. (2010) - Oil Budget Calculator, OBC, Deepwater Horizon oil budget calculator: a report to the National Incident Command. The Federal Interagency Solutions Group, oil budget calculator science and engineering team. Technical documentation. Schmidt Etkin Dagmar, Nedwed Tim J., (2021) - Effectiveness of mechanical recovery
for large offshore oil spills, Marine Pollution Bulletin, Vol. 136, 111848. Seymour, R.B., Carraher, C.E. (1992) - Polymer Chemistry, an Introduction, 3rd Ed, Marcel Dekker, Inc., New York, SUA.
LISTED IN THE AHFE DIGITAL BOOKSTORE CATALOGUE
Explore the complete digital volume
Human Interaction and Emerging Technologies (IHIET-AI 2023): Artificial Intelligence and Future Applications
Read this individual research paper free through the original publisher, or explore the full digital proceedings book.
ISBN 978-1-958651-46-9
Explore this ISBN in the AHFE Bookstore ↗Listed in the July 2026 bookstore catalogue; search by ISBN to confirm current availability · Digital book purchase optional