Toya Yahaba, Namgyu Kang (2022). Kansei Evaluation of Natto Packages: Focusing on Text Mining and Color Analysis. In: Kansei Engineering. AHFE Open Access, vol. 40, pp. 36–42. https://doi.org/10.54941/ahfe1001758
This study aims to visualize ambiguous package impressions of natto (fermented soybeans) and investigate the relationship between package characteristics and color and purchase intention. Therefore, we analyzed the eight Natto packages of two famous brands in Japan using the following four analysis methods; Color perspective analysis, Factor analysis with SD method, Ranking method, and the Text-mining method. In this study, participants evaluated the impressions of eight Natto packages with the SD method by factor analysis. In addition, they evaluated the Natto packages based on the evaluation item 'Want to buy package' using the Ranking method. Then, we investigated the characteristics of the brands and the relationship between the Natto packages with the Text-mining method. Next, we visualized and examined the percentage of colors used in the Natto packages. In addition, we examined the Cluster analysis based on the factor scores to examine whether there was a relationship between the used color in packages and the two Natto brands. As a result, we could obtain the following four factors; "Natural feeling as a food," "Stubbornness," "Blandness," and "Unpretentious" by the SD method. Among these factors, "Stubbornness" is related strongly to color. However, the ordered results with the Ranking method did not show a clear relationship with color. However, the "Natural feeling as a food" factor has a strong relationship with the color of packages. Therefore, changing the package's color changes the package's impression, affecting the user's motivation to buy. Since we could clarify the relationship between the four factors and the motivation level to buy, we calculated the correlation between these four-factor scores and the evaluated scores of the Ranking method. As a result, there was a negative correlation between the factor "Natural feeling as a food" and "Blandness." In contrast, there was a positive correlation between "Stubbornness" and "Unpretentious." Moreover, the intensity level of the used color in packages differed depending on the brands. The result of the Cluster analysis also revealed that the used color was related to brands. Text mining method with the result from the Ranking method revealed that participants have different views of each brand. And the motivation to buy a Natto is related to not only its price and taste but also the design of the package, including color and text. As future work, this study needs to focus on only the used color packages and more clarify the characteristic between the color of packages and brands.
In recent years, interest in Japanese food has spread around the world, and it has been reported that Japanese food is the number one preferred cuisine in the world. Then, interest in the packaging of Japanese food has also increased, and many studies have been conducted, such as a study on the packaging and color of Japanese sake and a study on the relationship between the impres- sion of tea packaging and consumption behavior. In addition, more and more emphasis has been placed on package design from the viewpoint of marke- ting as well as research on packaging and purchase intention. However, even though package design can significantly impact buyers, there are few stu- dies on the packaging of Japanese food materials. In Japan, natto is often sold in opaque containers. In this study, we conducted an impression eva- luation of natto packages to visualize the packages’ vague impressions and investigate the relationship between the characteristics of the packages and their colors and the willingness to purchase. In the previous studies, we have investigated the relationship between the impression of natto packages and their colors. In addition, we also investigated the relationship between the color of the package and the willingness to buy. We do the SD method with a total of 15 adjective pairs. Factor analysis resulted in 10 adjective pairs
and four factors remaining. The results of the SD method and factor analysis (Table 1) showed that we could obtain four factors: “nature as food,” “stub- bornness,” “blandness,” and “common sense. Among these factors, the factor of “stubbornness” was found to be related to color. The results of the norma- lized ranking method showed that there was no clear relationship between color and willingness to buy. However, there was a relationship between the SD method and the factor “nature as a food” obtained from factor analy- sis results. Therefore, it became clear that information obtained from the package, such as the impression that the food is healthy and looks delicious, leads to a desire to purchase.
In this study, we will use the SD method, factor analysis, and the normali- zed ranking method to conduct more detailed research. In addition, based on the questionnaire results obtained by the normalized ranking method, text mining will be used to investigate what purchasers specifically think about the purchase of natto.
Color Analysis To objectively judge the color of the package, the area used for the package was investigated and visualized. In addition, the factor scores obtained from the factor analysis results were clustered to investigate whether there is a relationship with color.
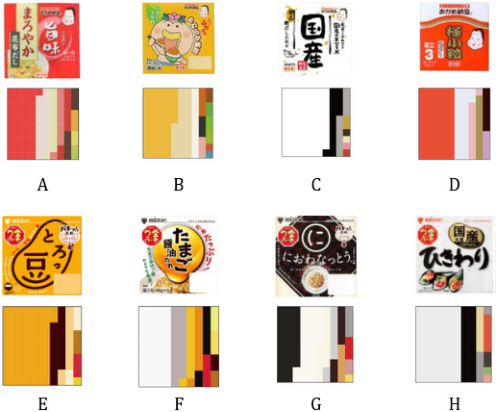
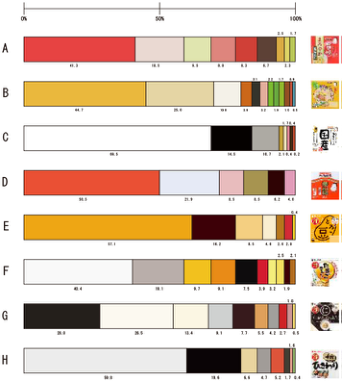
Fig. 1 is a graph showing the percentage of color in each package, with one pixel representing 1%, and Fig. 2 is a bar graph showing the percentage to one decimal place. As a result of this analysis, black was emphasized subjectively in the package of “Nio-wa-Natto”(G), but the percentage of black and white was about half.
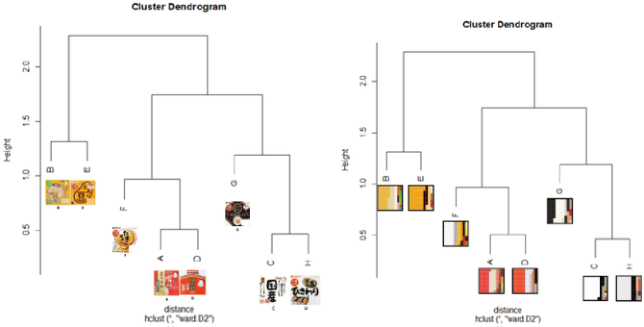
Fig. 3 shows the results of the cluster analysis. The left graph shows the package in the cluster analysis, and the right graph shows the package as a percentage square. The clusters are B and E, F, A and D, and G, C, and H when separated by a height of 1.5. The yellow package of F was included in the cluster of A and D, and G was included in the achromatic group.
38 Yahaba and Kang
Figure 1: Percentage of colors in each package (squares).Figure 2: Percentage of colors in each package (%).
From the packages of F and G, it was found in this study that other colors are emphasized more than white, and white appears to be less than the actual ratio. However, by examining the ratios, it became possible to use a more objective criterion for the investigation rather than concluding by visual con- firmation. In addition, it was found that overall, warm, and achromatic colors were the most common types of natto packages.
Based on the results of the factor scores obtained from the factor analysis, we conducted a cluster analysis and found that the impression of the package had something to do with the color.
Kansei Evaluation of Natto Packages-Focusing on Text Mining and Color Analysis 39
Figure 3: Results of cluster analysis.
Text Mining Text mining was conducted based on why the respondents answered they wanted to buy the most by the normalized ranking method. The purpose is to investigate and visualize what words are frequently used and essential in choosing the most wanted to buy natto. The text mining tools KHCoder, and AI text mining were used for the analysis. The analysis was conducted using text data of 76 people as in the normalized ranking method. Then, some modifications were made not to change the semantic content. (Example. In addition, KHCoder performs forced extraction to extract compound words during preprocessing. (e.g., “Hika”, “Wari” → “Hikariwari”) This study investigated what words frequently appeared in the word cloud and what words appeared together in the hierarchical cluster analysis.
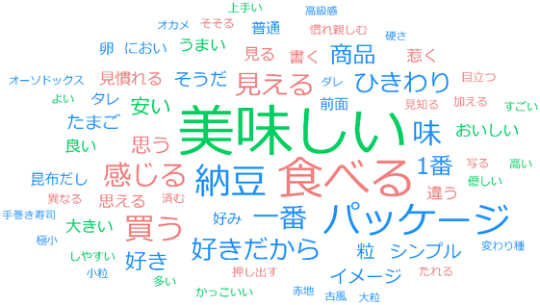
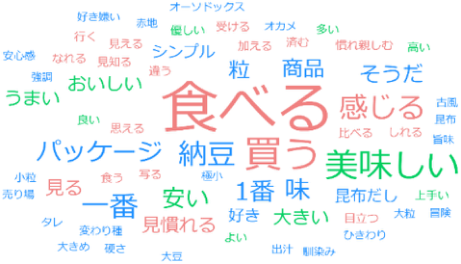
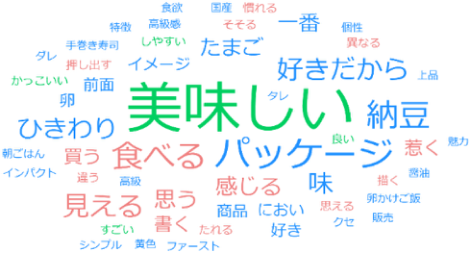
First, we created a word cloud and visualized the entire text data. The results are shown in Figure 4, sorted by frequency of occurrence. The colors of the words differ according to the part of speech: blue represents nouns, red represents verbs, and the green represents adjectives. In the graph orde- red by frequency of occurrence (Figure 4), the words “delicious,” “eat,” and “package” appear frequently. Then, we created a word cloud for each brand. Figure 5 shows the results for Okame Natto in order of freque- ncy of occurrence, and Figure 6 shows the results for the Kin-no-Tsubu series in order of frequency of occurrence. From Figs. 5 and 6, the words “eat,” “buy,” and “feel” appeared more frequently for Okame Natto, and the words “delicious,” “package,” and “eat” appeared more frequently for Kin-no-Tsubu.
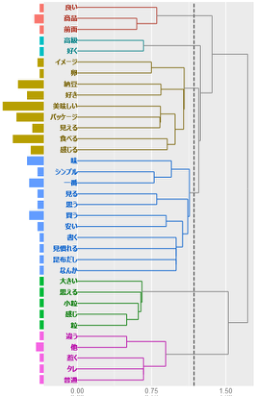
The hierarchical cluster analysis (Fig. 7) resulted in the extraction of six clusters. Each cluster was then given a name to determine what kind of cluster it was. The words “good,” “product,” and “front” were used to denote the “goodness of the product. From the word “luxury,” “high quality. The words “package,” “look,” “eat,” “feel,” and “image” or “buyer’s impression of the package. The words “taste,” “think,” “buy,” “best,” and “see” indicate the “buyer’s point of view. Attributes of natto” from the words “big,” “grain,”
40 Yahaba and Kang
Figure 4: Results of word cloud (in order of frequency of occurrence).Figure 5: Word cloud by brand (Okame natto).Figure 6: Word cloud by brand (Kin-no-Tsubu).
and “small grain.” The words “other,” “different,” “tare,” “normal,” and “attract” were used to name the “individuality of the product.” Therefore, we interpreted each cluster as “product quality,” “luxury,” “impression of the package by the buyer,” “buyer’s point of view,” “attributes of natto,” and “individuality as a product.” It became clear that these clusters influenced the purchase.
The graph (Fig. 4) in the order of frequency of occurrence shows that the words “delicious,” “eat,” and “package” appear frequently. However, the
Kansei Evaluation of Natto Packages-Focusing on Text Mining and Color Analysis 41
Figure 7: Hierarchical cluster analysis.Table 2. Interpretation results for each cluster in hierarchical cluster analysis.
words “look,” “feel,” and “image” also appeared frequently, suggesting that making it easy to imagine what kind of product the natto is and how it tastes when eaten is related to purchasing. By brand (Figs. 5 and 6), it was suggested that there was a difference in the purpose of purchase: for Okame Natto, people buy natto to eat it, and for Kin-no-Tsubu, people buy natto because this natto looks delicious when they see the package.
The results of the hierarchical cluster analysis can be divided into two categories: “Product quality,” “Luxury,” “Natto attributes,” and “Product individuality” were strongly influenced by the package and natto itself. In contrast, “Buyer’s impression of the package” and “Buyer’s viewpoint” were strongly influenced by the buyer’s sensitivity. Table 2 summarizes the interpretation results of each cluster in the hierarchical cluster analysis
CONCLUSION
Finally, we will introduce the main results obtained in this study. In the color analysis, we investigated what colors are used in natto packages by visua- lizing the ratio of colors and whether the colors affect the natto packages. As a result, we found a relationship between the two. Text mining sugge- sted that buyers’ impressions of the product and the purpose of purchase changed depending on the brand. The results of Experiment 2 suggested that
42 Yahaba and Kang
the buyer’s impression of the product and the purpose of purchase changed depending on the brand. It was also suggested that the buyer’s thoughts on the “best of the product,” “luxury,” “impression of the package,” “buyer’s viewpoint,” “attributes of natto,” and “personality of the product” affect the purchase. However, in this study, the analysis was conducted on commerci- ally available packages of natto, so it was impossible to clarify which specific color affected which sensitivity. Therefore, we will continue these studies and investigate how other Japanese food materials will be affected.
REFERENCES
Akamine, T., Kobayashi. E, Shibukawa, M., Funada, T., Funada, M., and Futamiya, R., A study on the effect of the impression of tea package on consumption behavior, Ergonomics, 2006, (Vol.42) supplement issue, p. 114–115, (In Japanese) Ishii, H., and Onzo, N., Package Design Strategy from a Value Perspective, Marketing
Journal, 2010, Vol. 30, No. 2, pp. 31–34, (In Japanese). Ito, K. Kiriya, K. Ohara, Y., Tamagaki, Y., and Miyazaki, Y, Impressions that Sake Packages Give to Users, Journal of Design Studies, 2007 (Vol. 54, No. 2), pp. 19–26, (In Japanese). Kurita,A., and Iwanaga, M., The relationship between color elements that define
the luxury of product packages and purchase intention, The 81st Annual Meeting of the Japanese Psychological Association, 2017, Vol. 81, 1A-050-1A-050, (In Japanese). Maeda, Y., Kondo, T., Sasaki, T. Yoshida, N., Kitabayashi, H., and Nagano, M., Effects of package color on the product image and willingness to buy: A case study of chocolate packages, Journal of Kyoto Tachibana University, 2016, No. 43, pp. 203–218, (In Japanese). Nagase, H., and Suzuki, S.„ A Practical Marketing Method for Creating Sen-
sory Value in Product and Brand Creation: A Case Study of Package Design for Processed Agricultural Foods, Research Report, 2011, No. 4, pp. 27–30. Nagano Prefectural Industrial Technology Center, Research Report, 2011, No. 4, pp. 27–30, (In Japanese) The Deliciousness of Japanese Food, Kobayashi Shokuhin Co.,Japanese Food Attracts Worldwide Attention, Features of Why Japanese Food was Registered as an Intangible Cultural Heritage of UNESCO, https://www.kobayashi-foods.co.jp/wa shoku-no-umami/ (last viewed on June 30, 2021), (In Japanese).
LISTED IN THE AHFE DIGITAL BOOKSTORE CATALOGUE
Explore the complete digital volume
Kansei Engineering
Read this individual research paper free through the original publisher, or explore the full digital proceedings book.
ISBN 978-1-958651-16-2
Explore this ISBN in the AHFE Bookstore ↗Listed in the July 2026 bookstore catalogue; search by ISBN to confirm current availability · Digital book purchase optional