Kouki Kamada, Anna Endo, Naoki Takahashi, Takashi Sakamoto, Toshikazu Kato (2022). Analysis of How Impressions are Fixed After One Week of Listening to Music Using Subjective Evaluation and Brain Activity Measurement. In: Kansei Engineering. AHFE Open Access, vol. 40, pp. 72–78. https://doi.org/10.54941/ahfe1001763
In advertising and marketing, information is often repeatedly presented to consumers to increase their interest and sensitivity. This method is based on what is known in psychology as the ‘mere exposure effect’. In contrast, there is a growing interest in "neuromarketing," the application of brain science ideas to marketing, and the relationship between various psychological effects and brain activity in marketing. Brain measurements have also been used to study the mere exposure effect.However, although there have been various neuroscientific studies and verifications of the mere exposure effect, there have been few experiments that involve multiple exposure to stimuli across days. Therefore, we measured brain activity to investigate the effect of stimulus presentation across multiple days on impressions.In this study, we conducted an experiment in which subjects listened to music every day for a week. On the first day, when the subjects listened to the music for the first time, we conducted subjective evaluations of liking and brain function measurements. The next day, they listened to the music once every day, at home, for five days. On the last day, six days after the first day, we conducted the same subjective evaluation and brain function measurements as on the first day. To create music stimuli that the subjects had never perceived before, an automatic music creation tool was used.During brain activity measurement using optical topography, we focused on the change in the impression of likeability. In optical topography, the change in the concentration of Oxy-Hb in the brain blood flow was measured as a time-series data volume based on functional near-infrared spectroscopy (fNIRS). In the human brain, the amount of Oxy-Hb in specific activity areas increases with time. By measuring the increase and decrease in Oxy-Hb, we can understand how the subject responds to stimuli.We experimented with 10 healthy right-handed undergraduate and graduate students in their 20s (8 men and 2 women, average age 22.6 years) who provided informed consent, following the rules of the Ethics Committee of Chuo University.Consequently, the verification of impression evaluation, which is a subjective evaluation, showed that the impression evaluation increased significantly from the first day to the last day. At this point, it can be said that the mere exposure effect occurred through repeated listening. An analysis of the brain blood flow data showed that the prefrontal cortex became more active during the processing of negative impressions. In particular, the activity of the DLPFC may be deeply involved in the judgment of impressions. Although this was considered a hypothetical event in the previous study, it was clarified in this study without contradicting the data. The results also suggest a new possibility that the brain activity of first impressions can be used to estimate how impressions change in the future. These results may be useful in the field of neuromarketing for predicting long-term advertising effects.
In recent years, “neuromarketing” has been attracting attention as a way to examine the relationship between brain activity and various psychologi- cal effects in marketing. Some research has been conducted on the “mere exposure effect” using brain measurements (Harmon-Jones and Allen, 2001; Green at al., 2012). In advertising and marketing, this “mere exposure effect” is the basis for the repeated presentation of information, which is said to increase the interest and sensitivity of consumers. According to a survey by Japan’s CM Research Institute, AGC’s corporate commercial ranked third in the liking of commercials by brand in the first quarter of January 2020 (Nikkei, 2020). It was an unusually high score for a commercial from a B2B company, a materials manufacturer, to be in third place. The monitors said
Analysis of How Impressions are Fixed After One Week of Listening to Music 73
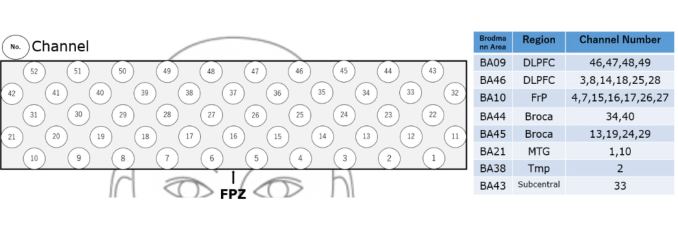
Figure 1: Measurement Ch. and classification of the Broadman area.
that “the phrases stay in my ears”and “the music gets stuck in my head.” Fur- thermore, the top factor for liking the commercial was “music/sound.” The repetition of music also appears to create a positive impression of the adver- tisement based on these findings. In these cases, it is common to attempt to maximize the effect by presenting information repeatedly over a long period. There is, however, little neuroscience research on multiple presentations of stimuli across days.
We investigated how impressions are fixed in individuals when stimuli are presented across multiple days, using subjective evaluations and brain acti- vity. Subjects listened to music every day for a week, and on the first and last days they were asked to make evaluations of their likes and dislikes, and brain functions were measured.
In this study, we focused on preference as one of the components of impres- sions. In a study of TV commercial preference and prefrontal cortex activity, Mitsui et al. (2013) found that the concentration of oxygenated hemoglobin (Oxy-Hb) in the cerebral bloodstream of the right hemisphere decreased after viewing a video with a good first impression. Endo et al., (2020) investigated changes in impression evaluation and brain activity during two repeated vie- wings of a TV commercial. The results revealed that brain activity differed depending on the number of views, even though the subjective ratings were the same. They also summarized the results of previous studies, suggesting that the dorsolateral prefrontal cortex (DLPFC) activity may decrease when first impressions are good.
MATERIALS AND METHODS
We used optical topography (ETG-4000, Hitachi, Ltd.) to measure brain function. This is based on functional near-infrared spectroscopy (fNIRS), and measures the changes in the concentration of oxy-Hb and deoxy-Hb (deoxy- genated hemoglobin) in cerebral blood flow as a time-series data volume. In the human brain, the amount of oxy-Hb in a specific active area increases with time. By measuring the increase and decrease in the oxy-Hb level, we can understand how the subject responds to stimuli (Maki et al., 2008).
The device was worn over the subject’s prefrontal cortex. Figure 1 shows the serial numbers of the 52 channels (Ch.). The area between Ch. 5 and Ch. 6 is located at Fpz, as specified in the International 10-20 Method, which is the standard for electrode placement in EEG. By mounting the device, it is
possible to measure the oxy-Hb concentration in the region indicated in the Table in the figure with an accuracy of more than 80%. The accuracy was derived using the virtual registration method (Tsuzuki et al., 2007).
Ten healthy right-handed subjects in their twenties (8 males, 2 females, mean age 22.6 years), who consented to the regulations of the Ethics Com- mittee of Chuo University when measuring brain activity, were tested. To control the experimental conditions, a total of nine musical stimuli, which the participants had never heard before, were created, using the automa- tic music creation tool “SOUNDRAW.” Pink noise, which is white noise with 1/f fluctuations, was also used as a comparison stimulus. We measu- red brain function on the first day of listening to music stimuli. The subjects listened to the music stimuli once a day for five days at home. We then con- ducted the same brain function measurement experiment again six days after the first day. After presenting the music stimuli, we conducted a question- naire survey. The subjects were asked to rate each stimulus on a 7-point scale (-3 to +3) for “liking the music stimulus.” The music stimuli were presented in a random order for each subject. The tasks were presented in the following order for each music stimulus: (1) Resting image (10sec) (2) Pink noise (30sec) (3) Resting image (10sec) (4) Music stimulus (30sec) (5) Questionnaire evaluation (10sec) Brain activity was analyzed using the POTATo (Platform for Optical Topo- graphy Analysis Tools) analysis software for fNIRS. The data processed by POTATo were subjected to a t-test at a significance level of 5% for each Ch. using the analysis software R, and Ch. were considered statistically signifi- cant. The null hypothesis of the t-test was that the mean of the differences between the data of the musical stimuli was zero, taking the mean of oxy-Hb.
RESULTS
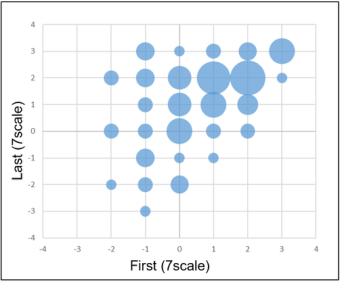
Subjective Assessment of Music In this experiment, the data obtained on the first day of the experiment is called “First”and the data obtained on the last day of the experiment is called “Last.” Figure 2 shows the bubble chart of the evaluation values of “First” and “Last” obtained using the 7-scale method.
A t-test was conducted to determine if there was a significant difference between the impression ratings of “First” and “Last.” The results show that the p-value is 0.00026, the mean value of “First” is 0.62, and the mean value of “Last” is 1.18, which means that the impression rating has increased signi- ficantly. Furthermore, this integer data were normalized, and its value was used as the Z-score.
Comparison of Brain Activity by Amount of Change To exclude those whose impressions did not change much, oxy-Hb data were excluded when the change in Z-score was between −0.5 and 0.5. The remai- ning data were subjected to t-tests for each Ch. The four combinations of t-tests are presented in Table 1 below.
Analysis of How Impressions are Fixed After One Week of Listening to Music 75
Figure 2: Bubble charts of impression ratings.Table 1. How to combine t-tests by amount of change.
Table available in the original PDF paper.
Table 2. Results of the t-tests for combinations 1-4 by amount of change.
Table available in the original PDF paper.
Ch. that became significant from the results of the t-tests for combinations 1-4 are shown in Tables 2 and 3, respectively. The results of combination 1 showed that the brain activity of “First” was larger when the amount of change was positive, especially in the right hemi- sphere. The results for combination 3 showed that brain activity was higher when the amount of change after the “First” was positive. Furthermore, significant differences were observed in the DLPFC (BA46) and c-DLPFC (BA09).
Table 3. How to combine t-tests by the first impression and amount of change.
Table available in the original PDF paper.
Table 4. Results of the t-tests for combinations 1-4 by the first impression and amount of change.
Table available in the original PDF paper.
Comparison of Brain Activity According to the First Impression and Amount of Change The following classification was made according to positive and negative first impressions: Negative “first” impressions and positive changes, and B posi- tive “first” impressions and negative changes. In other words, “A” means that the first impression is low, and the subsequent impression is good. Sub- sequently, “B” means that the first impression is high, and the subsequent impression is low. To exclude values near 0, we excluded oxy-Hb data when the change in Z-score was between −0.3 and 0.3. The t-test combinations are shown in Table 3.
In combinations 1-4, Ch. that became significant from the results of the t-test are listed in Table 4.
The results of combination 1 show that for a low rating at the beginning and a higher rating afterward, there were more active areas in the “First”than in the “Last.” Conversely, in combination 2, when the rating was high at the beginning and then decreased, there were more active areas in the “Last” than in the “First.” For combination 3, when the rating was low and incre- ased later, brain activity was generally higher during the “First” session. In contrast, for combination 4, no significant differences were found in most of the Ch.
DISCUSSION
The results show the possibility of estimating future impressions from brain activity after repeated listening to music for the first time. In the comparison
Analysis of How Impressions are Fixed After One Week of Listening to Music 77
of “First” brain activity (Table 2), there was a significant difference in the classification based on the amount of change in symmetrical Ch. In contrast, in the comparison of “First” brain activity in the classification of how the first impression and subsequent impressions change (Table 4), the signifi- cant Ch. was not symmetrical and was biased toward the left hemisphere. The difference between the two classification methods was whether the first impression depended on the classification. This suggests that it is possible to infer how future impressions will change, based on the brain activity of the first impression.
Furthermore, the prefrontal cortex was activated more during the proces- sing of negative evaluations in the overall results. In particular, the DLPFC was activated when judging the impressions. When the amount of change was positive, the brain activity of “First” was higher than that of “Last” in the comparison between “First” and “Last” (Table 2). In contrast, when the amount of change was negative (Table 2), the brain activity of “Last”was lar- ger than that of “First.” Therefore, it can be considered that the brain is more active when impression evaluation is low. There was a significant difference in the activity of the c-DLPFC (BA09), suggesting that it may be involved in the processing of negative impressions. The comparison between “First” and “Last” in “A” (Table 4) shows that overall brain activity in “First” is higher than that in “Last.” In contrast, in the comparison of “B” (Table 4), the brain activity of “Last” was higher than that of “First,” especially in c-DLPFC. “A” is where the first impression is bad and subsequent impression good, and “B” is where the first impression is good and subsequent impression bad. This fin- ding suggests that the prefrontal cortex is involved in the processing of bad impressions, as in the previous case. These results indicate that DLPFC acti- vity is high when the impression is bad, which is consistent with the results of previous studies (Mitsui et al., 2013; Endo et al., 2020). Therefore, we should focus on DLPFC activity to estimate the impression of favorability from brain activity.
CONCLUSION
We had the subjects listen to music every day for a week and measured their subjective evaluation of the music and brain activity on the first and last days. Analysis of blood flow data showed that the prefrontal cortex was more active during the processing of negative impressions. In particular, the DLPFC may be deeply involved in the judgment of impressions. It was suggested that the brain activity of first impressions can be used to estimate how impressions will change in the future. We consider these results to be discoveries from the perspective of neuromarketing.
ACKNOWLEDGMENT
We would like to thank Dr. Atsushi Maki (Hitachi, Ltd., R&D Group) for his guidance in the measurement and analysis of brain function.
This research is partially supported by a collaborative research program of the Institute of Science and Engineering, Chuo University.
REFERENCES
Anders C. Green, Klaus B. Bærentsen, Hans Stødkilde-Jørgensen, Andreas Roepstorff, Peter Vuust. (2012): Listen, Learn, Like! Dorsolateral Prefrontal Cortex Involved in the Mere Exposure Effect in Music, Neurology Research International, Volume 2012, 846270 https://doi.org/10.1155/2012/846270 Anna Endo, Naoki Takahashi, Takashi Sakamoto, Toshikazu Kato. (2020): Analy-
ses of Impression Changes and Frontal Lobe Activity While Viewing Videos, Lecture Notes in Computer Science, pp. 129–141, https://doi.org/10.1007/978- 3-030-50353-6_10 Atsushi Maki, Hiroki Sato, Akiko Obata. (2008): Optical Topography and Brain Science, Journal of the Japan Society for Precision Engineering, Volume 74, No. 11, 1147–1151, https://doi.org/10.2493/jjspe.74.1147 Daisuke Tsuzuki, Valer Jurcak, Archana K. Singh, Masako Okamoto, Eiju Watanabe, Ippeita Dan. (2007): Virtual Spatial Registration of Stand-Alone fNIRS Data to MNI Space, Neuroimage, Volume 34, No. 4, pp. 1506-1518, https://doi.org/10.1016/j.neuroimage.2006.10.043 Eddie Harmon-Jones, John J.B. Allen. (2001): The Role of Affect in the Mere
Exposure Effect: Evidence from Psychophysiological and Individual Differences Approaches, Personality and Social Psychology Bulletin, Volume 27, No. 7, pp. 889–898, https://doi.org/10.1177/0146167201277011 Nikkei Style (2020): Issei Takahashi’s “Nandashi AGC” commercial sensitivity soars, https://style.nikkei.com/article/DGXMZO54922680Y0A120C2000000? channel=DF010320183446&n_cid=LMNST011, (Last search date: January 20 2022) Shinsuke Mitsui, Atsushi Maki, Toshikazu Kato. (2013): Relationship Analysis Betw-
een Subjective Evaluation and NIRS-Based Index on Video Content, Lecture Notes in Computer Science, pp. 459–466, https://doi.org/10.1007/978-3-642-39454- 6_49
LISTED IN THE AHFE DIGITAL BOOKSTORE CATALOGUE
Explore the complete digital volume
Kansei Engineering
Read this individual research paper free through the original publisher, or explore the full digital proceedings book.
ISBN 978-1-958651-16-2
Explore this ISBN in the AHFE Bookstore ↗Listed in the July 2026 bookstore catalogue; search by ISBN to confirm current availability · Digital book purchase optional