Yusen Zhu, Ao Jiang, Junbo Dong, Yeming Pang, Yuqing Liu, Jiacheng Liu, Xiang Yao, Stephen Westland, Caroline Hemingray (2022). The influence of music on colour preference in vehicle environment. In: Usability and User Experience. AHFE Open Access, vol. 39, pp. 19–28. https://doi.org/10.54941/ahfe1001686
Many experiments have proved that vision and hearing effect each other in many ways, and this phenomenon is of great significance to design (Zhang,2019)(Anderson,2014). Among the design of car cockpit, color is one of the most important elements of cockpit visual design, and different color directly affect people's experience in the cockpit (Satake,2011). We selected eight colors in study which are red, yellow, orange, blue, green, cyan, white and gray, and each color was set to two brightness levels and three music modes: non music, light music and bass-heavy music. Meanwhile, we used a head-mounted virtual reality display (HMD) to simulate the in-car environment, and assessed 55 participants on their level of color preference. In study we found that music changed people's preference for the color of the car cockpit environment and the degree of color preference was related to the type of music.Reference:[1]Zhang, Y., Liu, P., Han, B., Xiang, Y. and Li, L., 2019. Hue, chroma, and lightness preference in Chinese adults: Age and gender differences. Color Research & Application, 44(6), pp.967-980.[2]Anderson, P.W. and Zahorik, P., 2014. Auditory/visual distance estimation: accuracy and variability. Frontiers in psychology, 5, p.1097.[3]Satake, I., Xin, J.H., Tianming, T., Hansuebsai, A., Ando, K., Sato, T., Kajiwara, K. and Ohsawa, S., 2011. A comparative study of the emotional assessment of automotive exterior colors in Asia. Progress in Organic Coatings, 72(3), pp.528-540.
On average, residents living in towns spend more than one hour within a car every day, but for people living in big cities, the time spent in the car will be longer (Rui W, 2020), so it is extremely important to have a comfortable car environment. A comfortable environment requires the interaction and integration of human senses (Yang W, 2019). It has been found that leg space and seats are the most important factors effecting the comfort of the interior environment (Vink P, 2012), and thermal comfort is also one of the factors that people pay great attention to. Air flow, air flow, air outlet position of air conditioner (A/C), vent position of vehicle body, glass performance and other factors will all effect people’s thermal comfort (Lin C H, 1992), and a comfortable interior design can bring comfortable experience to passengers (Vink P, 2012). Color is an important element in the visual design of cockpit areas, impacting on people’s comfort. For example, a correct or special color scheme can make the cockpit space look more spacious, and can also reduce the pressure of small space and the fatigue of long-distance travel (Satake, I., 2011; Jinyi Z, 2010).
Color is an important part of the car environment, and the background of color can regulate people’s audio-visual perception (Chien S E, 2020). Different color environments have different effects on Quantitative Electro- encephalogram (QEEG), blood oxygen saturation, pulse rate, mood and so on (Sroykham W, 2014). The influence of interior color on people’s mood is related to gender (Sroykham W, 2014), so people with different genders may have different preferences for interior vehicle environments. The color of the car environment may affect perceived productivity, social cohesion and well-being (Bakker, 2013), and also people’s sense of warmth (Houghten F C, 1940), which shows that it is extremely important. Colour preference is a vital factor of visual experience. Color preference is not universal (Taylor C, 2013), and may alter in distinct spatial environments (van der Voordt T, 2017). There are systematic differences in color preference between genders (Ellis L, 2001), and it derives from people’s average emotional reaction to color-related objects (Palmer S E, 2010).
Cars are a common place for people to listen to music (Brodsky W. 2001). As a product of human creation music is not only the ability to shape narra- tives involving human characteristics like emotion, but also extends to the environment of inanimate objects and scenes. Music has an influence on some more stable and personalized attribute dimensions (namely, persona- lity impression and empathy) (Ansani A, 2020), what’s more, music genres can affect young drivers’ driving behavior (Babi´c D, 2021), driving speed and their visual scanning of the surrounding environment. At the same time, the gradual popularity of faster songs may increase driving errors. Music can affect people’s emotions, among which people’s low-favorite music is more suitable for the construction of emotion recognition. There are a lot of stu- dies about the influence on people’s driving while playing music in car, but few of them focus on whether it will affect people’s color preference.
Researchers have discovered various interactions between vision and hea- ring, such as human audio-vivisectional in external space and audio - visual interaction in audio - visual perception (Bertelson P, 1981; Li H, 2020); It is found that acoustics, thermal conditions and lighting conditions in the indoor environment effect people’s comfort (Yang W, 2019), but whether music would influence people’s color preference or not has not been fully studied. In this study, we look at people’s color preference in three music modes: non music, light music and bass music in the virtual car environment to verify the influence of music on color preferences.
METHOD
The Participants Fifty-five participants (30 adult males and 25 adult females) from a gene- ral psychology course at a community college were recruited to participate in an experiment. Participant ages varied between 18 and 25. All of them were visually and audiologically examined before the experiment, and pas- sed the Ishihara test. They had normal vision as well as hearing, and had no color blindness. They were tested by the Exxon Personality Inclination Test
The influence of Music on Colour Preference in Vehicle Environment 21
(EPQ) as extroverted and everyone passed the physical examination. This experiment was reviewed and approved by the local ethics committee.
Experimental Scene Construction We Used uinty3D to develop an interior model of the car cabin, set up the program in C#, and simulated the car cabin by 3D computer rendering. We also referred to the standard of tesla Model3 car cabin. The interior instru- ment panel and seat were covered with a main color while the armrest box and steering wheel were decorated with auxiliary colors. The scene was illu- minated with a uniform illuminance of 450lux and a color temperature of 5,000 k. The participants were required to conduct the experiment, use a head-mounted virtual reality display (HMD) and audio-visual equipment. The experimental design included two factors: the different colored cock- pit interiors and the musical environment. The experiment took place in a quiet environment in order to limit any influence from external factors. The data were analyzed by comparing the experimental data of all participants.
Color Standard Eight color environments were used: red (R), yellow (Y), orange (C), blue (B), green (G), cyan (C) and white (W), gray (G). Each color was set to the highest chromaticity to maximize the influence of color on people. This method has been widely adopted in previous studies (Jiang, A, 2018; Jiang, A, 2020; Jiang, A, 2022). The eight colors were presented as the cockpit environment standard for the interior instrument panel and seats.
Music Standard We used SONY WH-1000XM3 headphones to simulate the music played in a car cockpit, and surround sound technology to virtually simulate the music environment of the car cockpit. We also used two contrasting music types to compare with the noise reduction mode of the headphones, which included light music and heavy music. The light music type was selected from the Beethoven and Romantic master playlist of APPLE Music and Heavy music was from LINKIN PARK album.
Experimental Process During April and June 2021, participants were brought to the lab at 9:00 a.m. to 16:00 p.m. The experiment was conducted in a quiet room without daylight. Ten days before the experiment, they were trained in the use of head-mounted virtual reality display (HMD) and audio and video equi- pment. They all became adept in using the instruments, and passed the VR proficiency test. Before the formal experiment, the experimenter intro- duced the the process and matters which should be payed attention to, and informed them about the meaning of each question within the subje- ctive questionnaire which should be accurately understood and evaluated according to their actual situation. Participants signed the informed consent form. The experiment was divided into three parts. In the first part, parti- cipants were seated and fitted with a head-mounted virtual reality display
Table 1. Selected music properties and examples.
Table available in the original PDF paper.
Example Description
Music type
Be selected from light music Beethoven’s piano Piano Sonata No. 14 in C sharp minor Op. 27 No. 2 “Moonlight’
The selected pieces are Beethoven pianon music, music style for pure music, simple structure, bright rhythm, beautiful melody. Light music can build sweet romantic emotional appeal, contain recreational property.
Piano Trio in D minor, Op. 11 Piano Sonata, Third Movement Op.13 No.8 heavy music
LINKIN PARK
Numb The selected tracks are LINKIN PARK albums, including various Western “classical music”, such as classical music, Romantic music and Impression music, as well as Traditional Chinese “national classical music”. It also includes modern western music and music works of Professional Chinese composers since the beginning of the 20th century. In the End Battle Symphony
(HMD) and audio-visual equipment. They adapted to the environment for 10 minutes before the experiment. In the second part, there were eight colors: red, yellow, orange, blue, green, blue, white, gray. We set two kinds of brightness levels in each color. The cockpit colors would appear on the VR head-mounted display screen, and players would participate in diffe- rent VR cockpit cabin color tests and hear light music, the stress music and quiet without the content of the music. In the third part, participants would complete the questionnaire in the set subjective questionnaire after completing the experiment and then rest for 30 minutes. During the rest period, they could take a walk or overlook surrounding scenes to relieve fatigue.
After that, they started the next experiment. In the first part they are requi- red to watch a white screen for five minutes while wearing a head-mounted display (HMD) in a seated position to accommodate their eyes. Subsequen- tly, eight 3D color scenes were randomly set out on the VR head-mounted display, and participants would be tested in each color environment. In the end, participants would fill in their preferences.
Data Acquisition and Processing After collecting subjective questionnaires filled in by participants, we firstly analyzed them by using Microsoft Excel, and described the classified data by counting. Then we used IBM SPSS Statistics 25 for descriptive Statistics of all the data, checked the obvious differences in music, color and gender. Mul- tivariate comparisons were also used to analyze whether there were distinct differences between pairwise comparisons of the influence factors.
The influence of Music on Colour Preference in Vehicle Environment 23
Table 2. Averages and variances of three experiments.
Table available in the original PDF paper.
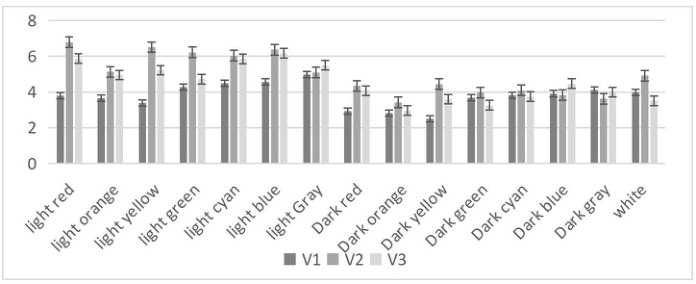
Colour AVG(V1) S(V1) AVG(V2) S(V2) AVG(V3) S(V3) Light red 3.78 1.99 6.78 1.66 5.87 1.58 Light orange 3.65 1.84 5.13 1.71 4.95 1.8 Light yellow 3.38 1.87 6.51 1.33 5.22 1.34 Light green 4.27 1.38 6.22 1.41 4.73 1.62 Light cyan 4.49 1.2 6.04 1.28 5.85 1.33 Light blue 4.58 1.07 6.36 1.2 6.16 1.17 Light gray 4.96 1.93 5.09 2.3 5.49 1.22 Dark red 2.93 1.35 4.35 1.5 4.07 1.4 Dark orange 2.82 1.6 3.42 1.52 2.96 1.69 Dark yellow 2.49 1.45 4.44 1.4 3.6 1.7 Dark green 3.67 1.28 3.96 1.63 3.25 1.93 Dark cyan 3.82 1.34 4.09 1.48 3.75 2.01 Dark blue 3.91 1.21 3.82 1.5 4.47 1.71 dark gray 4.11 1.38 3.62 1.55 3.98 1.87 White 3.96 1.32 4.91 1.61 3.51 1.14
RESULTS
Preference for Fifteen Colors The colors discussed this time included red, orange, yellow, green, cyan, blue, gray, and white,which are fifteen colors in total when distinguished by two brightnesses: light (Light) and shade (Dark). After getting the average of the 15 colors without music, we found that people have different preferences for color in the on-board environment. Light gray (M = 4.96, SD = 1.93) was found to be the most popular color in a music-free environment, followed by bright blue (M = 4.58, SD = 1.0), with the least popular color being dark yellow (M = 2.49, SD = 1.45), (Table 2).
The Difference in Color Preference after the Change of Music Environment We defined the non-music environment as V1, the light-music environment as V2, and the heavy-music environment as V3. Based on the compari- son of three experiments, the comparison between non music and light music (F[1,1648]=23.934, P<0.001, ηp2=0.0143) and the comparison betw- een non music and heavy music (F[1,1648]=24.118, P<0.001, ηp2=0.0144) showed significant differences. We found that the music environment can effect the extent of people’s color preference, and the influence of different types of music on color preference also showed differences. In light music environments, bright red (M = 6.78, SD = 1.66) and bright yellow (M = 6.51, SD = 1.33) were the the most popular colors, and the least popular ones were dark gray (M = 4.10, SD =1.48) and dark orange (M = 3.42, SD = 1.52). In the heavy-music environment, bright red (M = 5.87, SD = 1.58) and bright blue (M = 6.16, SD = 1.17) were the most popular colors, and the least popu- lar ones white (M = 3.51, SD = 1.14), dark green (M = 3.25, SD = 1.93) and dark orange (M = 2.96, SD = 1.69).
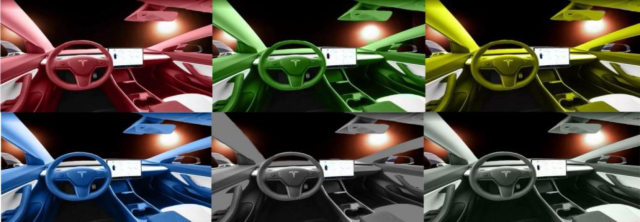
Figure 1: Part color virtual reality interior environment.
Differences in Chroma and Brightness Preferences After the Change of Music Environment After the music environment changes, the preferences in the light music envi- ronment, the heavy music environment and the non music environment were consistent. Meanwhile, the light color system and the dark color system sho- wed significant differences (F[1,2308]=11.563, P = 0.001, ηp2=0.0004), with the color preference of bright color system being greater than that of the dark color system, which means that people preferred the environment of bright colors in the vehicle environment, as show the Figure 1.
DISCUSSIONS The preference for different colors is a well-studied but controversial field. There were studies which have found that color preferences will be affected by people’s gender, age, emotions, culture, physiological conditions and other conditions. Some articles have pointed out that different senses will have mutual influences. Also, other articles considered that in the concert hall, vision will affect the auditory feeling. However, there is limited research into the specific impact of hearing on color preferences, thus, the focus of this research.
We used virtual reality for subjective testing and studied the effects of different types of music on color preferences in an in-vehicle environment. The results showed that different types of music have an impact on color preferences.
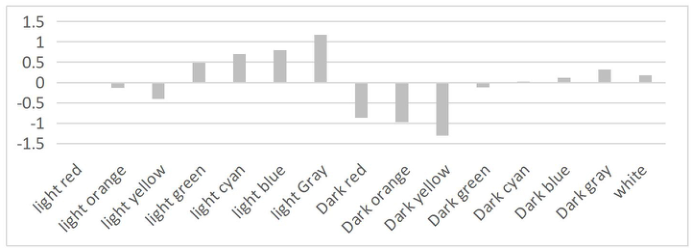
Firstly, we discussed the participants’ preference for color in a non-music environment and took the total average of color preferences in a music-free environment (M = 3.79) to the average color preferences of each color. After that, we treated those who were greater than the average as “like”, and the less as “dislike”, see Figure 2-3. We found that participants preferred cool, bright colors, such as bright blue and bright cyan. Meanwhile, gray also showed good performance which indicated that in the soundless music environment, people prefer cool colors.
Secondly, we played light and heavy music in the same in-vehicle envi- ronment and found a distinct change in color preference. Among them, the total average of color preferences rose compared with the music-free environ- ment (M= 4.98 for light music, M= 4.52 for heavy music). In our findings,
The influence of Music on Colour Preference in Vehicle Environment 25
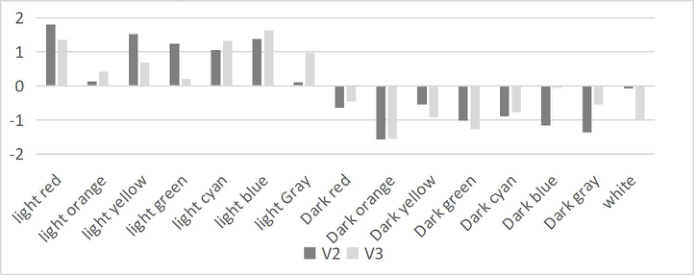
Figure 2: Average color preference.Figure 3: Preferences when there is non music.Figure 4: Preferences for light music and heavy music.
bright red and bright blue performed the best while dark orange performed the worst, which was inconsistent with the performance of non music envi- ronment. What we have found showed that music has an impact on color preferences and the senses of predecessors can influence each other.
At the same time, the color preferences of light music and heavy music is different, among which the light red and bright yellow are the two colors with the highest degree in light music, while in heavy music, bright blue and bright red. The preferences for bright green, bright gray, dark blue and white
are inconsistent. In general, there was no difference between light music and heavy music (p>0.05), but only on individual music.
Moreover, it can be clearly observed that the color performance of the bright colors is better than that of the dark colors. People prefer the relatively brighter ones as the color of the vehicle environment, which is consistent with the performance of the music and the absence of music. The dispersion of preference degree is greater than that without music.
CONCLUSION
In the vehicle environment, this research suggests that music can influence the experience of the vehicle environment.. Although we are not sure how this influence is produced, this experiment will provide some ideas for vehi- cle design. Designers can apply the influence of music on color preference to the overall color design, and make targeted design for consumers with dif- ferent needs for vehicle positioning. For example, setting the main colors of vehicle design as red and blue can be used as a highlight to improve consu- mers’ love for vehicles, so as to sell these vehicles to users who love listening to specific types of music. Combining an understanding of consumer music and color preferences of vehicle interiors can inform more effective design of future car interiors, and ultimately lead to increased sales and better customer experience.
ACKNOWLEDGEMENT
This work is supported by a research project of a research project of the Nati- onal Social Science Fund of China (No. 20BG115), a scholarship from the China Scholarship Council and the University of Leeds (No. 201908430166).
REFERENCES
Adams RJ. An evaluation of color preference in early infancy. Infant Behav Dev 1987;10(2):143–50. Anderson, P.W. and Zahorik, P., 2014. Auditory/visual distance estimation: accuracy
and variability. Frontiers in psychology, 5, p. 1097. Ansani A, Marini M, D’Errico F, et al. How Soundtracks Shape What We See: Analyzing the Influence of Music on Visual Scenes Through Self-Assessment, Eye Tracking, and Pupillometry[J]. Frontiers in Psychology, 2020, 11: 2242. Babi´c D, Babi´c D, Sucha M, et al. The influence of music genres on the driving
behaviour of young drivers and their visual scanning of the environment[J]. Transportation research part F: traffic psychology and behaviour, 2021, 81: 396–407. Bakker, Iris, et al. “Red or blue meeting rooms: does it matter? The impact of colour on perceived productivity, social cohesion and wellbeing.” Facilities (2013). Bertelson P, Radeau M. Cross-modal bias and perceptual fusion with auditory-visual
spatial discordance[J]. Perception & psychophysics, 1981, 29(6): 578–584. Brodsky W. The effects of music tempo on simulated driving performance and vehicular control[J]. Transportation research part F: traffic psychology and behaviour, 2001, 4(4): 219–241.
The influence of Music on Colour Preference in Vehicle Environment 27
Chen Y, Cabrera D . The effect of concert hall color on preference and auditory perception[J]. Applied Acoustics, 171. Chien S E, Chen Y C, Matsumoto A, et al. The modulation of background color on
perceiving audiovisual simultaneity[J]. Vision research, 2020, 172: 1–10. Ellis L, Ficek C. Color preferences according to gender and sexual orientation[J].
Personality and Individual Differences, 2001, 31(8): 1375–1379. Houghten F C, Olson H T, Suciu Jr J. Sensation of warmth as effected by the color of the environment[J]. Illuminating engineering, 1940, 35(10): 908–14. Jiang, A., Foing, B.H., Schlacht, I.L., Yao, X., Cheung, V. and Rhodes, P.A., 2022.
Colour schemes to reduce stress response in the hygiene area of a space station: a Delphi study. Applied Ergonomics, 98, p.103573. Jiang, A., Yao, X. and Zhou, J., 2018. Research on path planning of real-time obstacle avoidance of mechanical arm based on genetic algorithm. The Journal of Engineering, 2018(16), pp. 1579–1586. jiang, A., Yao, X., Schlacht, I.L., Musso, G., Tang, T. and Westland, S., 2020, July.
Habitability study on space station colour design. In International Conference on Applied Human Factors and Ergonomics (pp. 507–514). Springer, Cham. Jiang, A., Yao, X., Hemingray, C. and Westland, S., 2021. Young people’s colour preference and the arousal level of small apartments. Color Research & Application. Jinyi Z, Chao W. A research of train interior color design based on passenger experi-
ence[C]//2010 IEEE 11th International Conference on Computer-Aided Industrial Design & Conceptual Design 1. IEEE, 2010, 1: 439–442. Li H, Lau S K. A review of audio-visual interaction on soundscape assessment in urban built environments[J]. Applied Acoustics, 2020, 166: 107372. Lin C H, Han T, Koromilas C A. Effects of HVAC design parameters on passenger
thermal comfort[R]. SAE Technical Paper, 1992. Lu, S., Jiang, A., Schlacht, I., Foing, B., Westland, S., Hemingray, C., Yao, X. and Guo, Y., 2021, July. Effects and challenges of operational lighting illuminance in spacecraft on human visual acuity. In International Conference on Applied Human Factors and Ergonomics (pp. 582–588). Springer, Cham. Lu, S., Jiang, A., Schlacht, I., Ono, A., Foing, B., Yao, X., Westland, S. and Guo, Y.,
2021, July. The effect on subjective alertness and fatigue of three colour tempera- tures in the spacecraft crew cabin. In International Conference on Applied Human Factors and Ergonomics (pp. 632–639). Springer, Cham. Naser D S, Saha G. Influence of music liking on EEG based emotion recognition[J].
Biomedical Signal Processing and Control, 2021, 64: 102251. Palmer S E, Schloss K B. An ecological valence theory of human color preference[J]. Proceedings of the National Academy of Sciences, 2010, 107(19): 8877–8882. Rui W, Wei L, Chaoyi Z, et al. Study on Thermal Comfort of Vehicle Interior Envi-
ronment Based on Thermal Manikin[C]//International Conference on Applied Human Factors and Ergonomics. Springer, Cham, 2020: 317–324. Satake, I., Xin, J.H., Tianming, T., Hansuebsai, A., Ando, K., Sato, T., Kajiwara, K. and Ohsawa, S., 2011. A comparative study of the emotional assessment of automotive exterior colors in Asia. Progress in Organic Coatings, 72(3), pp. 528–540. Sroykham W, Wongsathikun J, Wongsawat Y. The effects of perceiving color in living
environment on QEEG, oxygen saturation, pulse rate, and emotion regulation in humans[C]//2014 36th Annual International Conference of the IEEE Engineering in Medicine and Biology Society. IEEE, 2014: 6226–6229.
Taylor C, Clifford A, Franklin A. Color preferences are not universal[J]. Journal of Experimental Psychology: General, 2013, 142(4): 1015. van der Voordt T, Bakker I, de Boon J. Color preferences for four different types of
spaces[J]. Facilities, 2017. Vink P, Bazley C, Kamp I, et al. Possibilities to improve the aircraft interior comfort experience[J]. Applied ergonomics, 2012, 43(2): 354–359. Yang W, Moon H J. Combined effects of acoustic, thermal, and illumination conditi-
ons on the comfort of discrete senses and overall indoor environment[J]. Building and Environment, 2019, 148: 623–633. Yu, K., Jiang, A., Wang, J., Zeng, X., Yao, X. and Chen, Y., 2021, July. Construction of crew visual behaviour mechanism in ship centralized control cabin. In Inter- national Conference on Applied Human Factors and Ergonomics (pp. 503–510). Springer, Cham. Yu, K., Jiang, A., Zeng, X., Wang, J., Yao, X. and Chen, Y., 2021, July. Colour design
method of ship centralized control cabin. In International Conference on Applied Human Factors and Ergonomics (pp. 495–502). Springer, Cham. Zhang, Y., Liu, P., Han, B., Xiang, Y. and Li, L., 2019. Hue, chroma, and lightness preference in Chinese adults: Age and gender differences. Color Research & Application, 44(6), pp. 967–980.\
LISTED IN THE AHFE DIGITAL BOOKSTORE CATALOGUE
Explore the complete digital volume
Usability and User Experience
Read this individual research paper free through the original publisher, or explore the full digital proceedings book.
ISBN 978-1-958651-15-5
Explore this ISBN in the AHFE Bookstore ↗Listed in the July 2026 bookstore catalogue; search by ISBN to confirm current availability · Digital book purchase optional