Paridhi Mathur, Abbas Moallem (2022). Tesla Model 3: Impact of Vertical Segmentation on Visual Search Time. In: Usability and User Experience. AHFE Open Access, vol. 39, pp. 1–9. https://doi.org/10.54941/ahfe1001684
Automotive industries are implementing high-end technology with minimalistic design and advancing rapidly. Tesla Model 3 is among those automobiles replaced physical knobs with fully functional touchscreen screens to enhance the minimal interior aesthetic. All the in-vehicle touchscreen interaction requires visual attention allocation between driving and touchscreen interaction resulting in drivers' divided attention posing a hazard or risk to the driver's safety. This research aims to assess the impact of the vertical grid design of the Tesla Model 3 infotainment system on visual search time while multitasking. For comparison, a horizontal grid design was prototyped to see the difference in visual search time between vertical and horizontal grid designs. Task success rate, the number of incorrect searches, reaction time for search, and subjective measures were considered to assess the dimension of efficiency and satisfaction. Eleven novice participants performed visual search tasks and answered follow-up questions based upon the task experience. Visual search task was designed using Psycho-Py and to collect real-time data Pavlovia.org online platform was used to run the experiment. Each trial in the visual search tasks starts with a red color fixation cross presented on a grey background lasting on-screen for 500 milliseconds. This fixation cross was followed by an on-road driving video that contains a question presented on the top-center of the video display. An image of the infotainment system appears at the bottom right corner of the screen at different time stamps lasting for 2 seconds. When a participant presses the right or left key based on the response, the video automatically terminates. This is followed by a two-response window, one after the other; the first response window where the participant must type the visual searched target answer asked during the video. In the second response window, the participant must typecast the total number of cars counted. A fixation cross appears again for 500 milliseconds indicating to participants that the subsequent trial will begin after this. After task completion, follow-up questions were asked. The purpose of asking follow-up questions was to understand the frustrations and difficulty experienced by the participants while searching target on the infotainment screen. A mixture of quantitative and qualitative data was gathered to assess the goals of efficiency and satisfaction. The result indicates that task success rate or target miss rate, and incorrect task response are high in the vertical grid design of the Tesla Model 3 infotainment system. Visual search time for vertical grid conditions was significantly higher than the NHTSA guideline. The results showed that the horizontal grid design strategy leads to a better target visual search user experience. The study concludes that the Tesla Model 3 infotainment system lacks discoverability, goal-based design, affordance, visual momentum, mode awareness, and consistency with the user's mental model. A robust design is required to achieve the crucial information search without leading the driver to a high risk of causing adverse consequences due to interface design. This research was conducted and submitted to the faculty of the graduate program in Human Factors/ Ergonomics for the partial fulfillment of the requirements for the Degree Master of Science.Keywords: visual attention, NHTSA guideline, discoverability, affordance, visual momentum, mode awareness, mental model
Touchscreens are a significant part of every industry for accomplishing dif- ferent tasks. This advanced technology brought 1.54 inches of touchscreen displays on the users’ wrist to the larger screen of 65 inches or more into their working space. In 1986, Buick Riviera was the first production car to have a touchscreen. Elon Musk, CEO of Tesla, released Model 3 in 2017. This car uses an extensive touch screen infotainment system in place of the physi- cal knobs. This functional centralized touchscreen composes a wide range of functions ranging from car speed, road speed limit, nearby car visuals, bat- tery charged, driving mode, following turn details, route navigation, time,
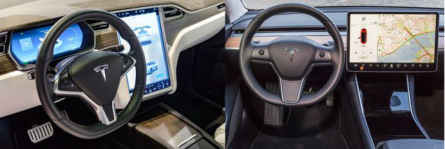
Figure 1: The figure shows the infotainment system in Tesla Model S (Left) and Tesla Model 3 (Right).
car lock, adjusting side mirrors, and temperature within the smaller spatial footprint. Heuristic evaluation of Tesla Model 3 infotainments system found that interface violated nine of Nielsen’s heuristics (2005) as the touchscreen design is complex.
Car driving and touchscreen interaction depend on vision, sharing com- mon visual attentional resources simultaneously (Fitch et al., 2013; Liang, et al., 2012; Wickens, 2002). This screen draws the driver’s attention toward it and leads to the more eyes-off road; thus, current system status must be received promptly to the driver to take immediate actions under dangerous situations (Ahmad et al., 2015, Parkhurst et al., 2019). Olson, Hanowski, Hickman, & Bocanegra (2009) investigated the impact of driver distraction in commercial motor vehicle (CMV) operations. They conducted eye glance analysis on eye locations during secondary task performance while operating a commercial motor vehicle. They asserted that 70% of crashes are due to non-driving task involvement, and tasks that draw attention away from the road increase the risk of a crash.
Currently, there is no design consensus amongst manufacturers. The shapes and sizes of on-screen targets are different between manufacturers. To the best of my knowledge, there is currently no research on the grid design of the Tesla Model 3 infotainment screen. Before Model 3, Tesla used a vertical touchscreen to display the information, besides the head-up display, but in Tesla Model 3, this touchscreen was rotated 90 degrees, and the head-up display was removed to develop a minimal aesthetic interior (Figure 1).
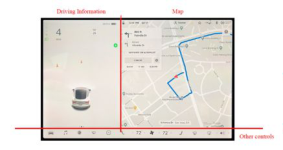
The Tesla Model 3 interface uses two vertical segments grid design (left and right); the left segment displays car activity on the road, whereas the right segment displays navigation details. With these two segments combining, a driver had to search the target information vertically. What is unknown is how vertical segmentation affects visual search time. Thus, there is a need for a study to investigate this aspect as vertical search speed is low as compared to horizontals search (Liu & Ka-lun, 2018; Goonetilleke et al., 2002). The idea is to show that the horizontal grid segmentation strategy leads to a better target visual search user experience. The hypothesis is that (1) Eyes-off-road time is greater than the NHTSA guideline while searching the target on the screen (2) Vertical segmentation increases the visual search time and target miss compared to horizontal segmentation. This study should show that the horizontal image segmentation strategy leads to a better target visual search user experience (3) Task completion rate is greater in horizontal than vertical segmentation.
Tesla Model 3: Impact of Vertical Segmentation on Visual Search Time 3
EYES-OFF-ROAD AND ATTENTION ALLOCATION To perform any secondary task while driving (as a primary task), a driver must take off eyes from the road and shift attention towards the touch- screen, which increases eye off the road time. Gasper and Carney (2019) examined the attention allocation to a different location in the car while driving. Glance cluster analysis showed that 74% of the driving time is looking up at the forward roadway, 13% looking at the instrument pan- el/steering wheel, and just 3% to the touchscreen. They also calculated total-eyes-off-road time (TEORT), which brought important consideration worth noting that drivers glance clusters are about 36 seconds towards tou- chscreen. TEORT glance cluster greater than 12 seconds fails the National Highway Traffic Safety Administration (NHTSA) visual-manual distraction guidelines (NHTSA, 2013). The guideline state that “Each glance should not exceed 2.0 seconds (NHTSA, 2013), and the total time the driver is looking at the VD (from the start of the task to the end of the task) should not exceed 12 seconds (NHTSA, 2013)”. Another guideline under NHTSA visual display location states that the “place the visual interface in a location that facilitates rapid extraction of information while minimizing eyes-off-road glances and negative impact on driving performance.” The guideline recommends that the target location on-screen, its size, and position should be so that it does not distract the driver from its primary role.
With the advancement in technology, a touchscreen is replacing physi- cal knob controls from the car. These physical knobs are tangible surface and no visual attention is required to attend to the knob manipulation. whereas touchscreen acts as a non-tangible flat surface for interaction and lacks nonvisual cues. Both the driving and touchscreen interaction depend on vision, sharing common visual attentional resources simultaneously (Fitch et al., 2013; Liang, et al., 2012; Wickens, 2002). Olson, Hanowski, Hickman, & Bocanegra (2009) investigated the impact of driver distraction in comme- rcial motor vehicle (CMV) operations. They conducted eye glance analysis on eye locations during secondary task performance while operating a comme- rcial motor vehicle. They asserted that 70% of crashes are due to non-driving task involvement, and tasks that draw attention away from the road increase the risk of a crash.
VERTICAL VERSUS HORIZONTAL SEARCH Visual search refers to the active scanning of the environment to find the tar- get object or feature among the distractors present. It is the perceptual task that requires attentional resources to perform the search. Previous research has identified that human tends to make target miss error when multiple tar- gets are presented (Adamo et al., 2013; Mitroff et al., 2015). When the safety of an individual is concerned, these critical visual target search tasks require high efficiency and accuracy as a missing target can cause adverse conseque- nces (Mitroff et al., 2015). To address this problem, Liu and Ka-lun in 2018 proposed an image segmentation strategy to improve visual search performa- nce. They divided the image with horizontal and vertical lines. These lines act as an aid to search the target zone-by-zone. Thirty participants were asked
4 Mathur and Moallem
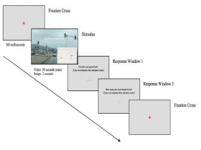
Figure 2: Experiment Design: Illustration of a computer-based experiment of one trial.
to search for Landolt C rings (target) from the array of 12*12 close rings (distractor) and image segmentation, presented in five ways (1) No Segmen- tation (act as control); (2) Three equal zone created horizontally; (3) Three equal zone created vertically; (4) Four quadrants; (5) six equal zones. Rese- archers measured target search time (total time required by the participants to search all the targets), accuracy (proportion of correct responses), fixa- tion count (total number of fixations on the image), and average fixation duration (amount of time participants spent fixating on search image). An important finding from this study was that scanning speed was faster for horizontal than for the vertical search, which supports left to right search direction (Goonetilleke et al., 2002).
METHODS
MacBook Pro 13 inch, iPhone 11and iMovies was used to design the sti- mulus. Participant’s screening was done with Google form and consent were taken with DocuSign. Zoom, and Pavlovia.org was utilized to conduct the session. 11 participants (7 F, 4 M) participated in this study. All the parti- cipants had no experience of driving the Tesla Model 3 or interacting with its infotainment system. Each participant performed twelve trials with six trials of vertical grid condition and six horizontal grid conditions. One parti- cipant’s data was dropped out from the analysis due to technical issues while recording data.
STIMULI Each trial in the computer-based experiment starts with a red color fixation cross presented on a grey background lasting on-screen for 500 milliseconds. This fixation cross is followed by an on-road driving video that contains a question presented on the top-center of the video display. An image of the infotainment system appears at the bottom right corner of the screen at different time stamps lasting for 2 seconds. When a participant presses the right or left key based on the response, the video automatically termina- tes. This is followed by a two-response window, one after the other; the first response window where the participant must type the visual searched target answer asked during the video. In the second response window, the partici- pant must typecast the total number of cars count. Two types of infotainment grid design images appear on the computer-based experiment.
In vertical grid design, a single vertical grid line dividing the images into two halves, left and right. The left half will display the car driving details, and
Tesla Model 3: Impact of Vertical Segmentation on Visual Search Time 5
Figure 3: Vertical Grid Design (Left) Illustration of vertical grid line segmenting the interface into two halves left and the right. Horizontal Grid Design (Right) Illustration of horizontal grid segmenting the interface into two halves top and bottom.
the right half will show the road map. Whereas in horizontal grid design a single horizontal grid line divides the display into two halves, top and bottom. Top half displays car driving details, and the bottom half will show the road map (Figure 3).
TASK Participant performs two tasks simultaneously. Primary and secondary tasks were designed to simulate the actual driving engagement and experience of the driver. For primary task, participants were asked to count the total number of cars ahead moving in the same direction and report the coun- ted number of cars when the video terminates. Secondary task is the visual search task. Participants were asked to perform a visual search on the info- tainment system image, which will be presented on screen for 2 seconds at the bottom right corner of the screen. Throughout the trial, the target search question was in front of the participant at the top-center of the screen. Dif- ferent questions and different images were presented randomly. Once they find the target information, they must press the RIGHT ARROW key on the keyboard as soon as possible and the LEFT ARROW key if they miss the tar- get information. Participants must type the response on the response window after the video terminates.
PROCEDURES On the day of the session, participants joined the zoom meeting using a secu- red link and were provided with the participants’ code. After participants join the zoom session, they were given a brief session overview and what the expectations would be from the participant during the session. The researcher now leads and guides the participants to work through a set of tasks. Once the participants complete the given task, they were asked follow-up questi- ons and the overall impression of the Tesla Model 3 Infotainment system interface. Upon session conclusion and participant’s feedback on the study, participants were given compensation and session concludes.
RESULTS
Findings are presented below into two sections; task-based and statistical- based.
6 Mathur and Moallem
Table 1. Performance measure with respect to number of participants.
Table available in the original PDF paper.
Task Success
Incorrect target searches
Task Average RT of correct responses (Sec)
6.311 3.767 1 5 2 1
V H V H V H Find the speed limit of the road?
4.939 4.443 2 4 5 9
Find how many miles away is your destination?
3.564 3.585 1 4 1 0
Find how much time (minu- tes) it will take to reach the destination?
6.984 3.943 7 9 2 0
Find the miles away is the next turn?
- - 0 1 11 3
Find the temperature of the car?
- - 0 0 2 0
Find how many miles a car can travel with the current charged battery?
TASK-BASED FINDINGS To assess users’ performance, an average reaction time of correct responses, task success, and the number of incorrect target searches made in a task mea- sure was taken. The two types of grid interface efficiency were defined by analyzing the task’s incorrect target search and success. The subjective mea- sure assesses the participant’s experience and feelings about the Tesla Model 3 infotainment system design.
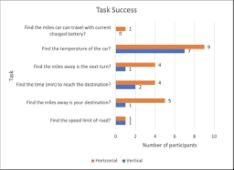
STATISTICAL BASED FINDINGS A one-tailed paired t-test was run using SPSS. A significant difference was found for the successful task completion rate between the vertical and hori- zontal grid conditions with a p-value (0.008) < 0.05 at significance level 0.05. There is enough evidence to reject the null hypothesis. The data analysis indicates a significant difference in the task completion rate (Figure 4).
One-way ANOVA was run using SPSS. According to NHTSA guidelines, only 2 seconds are allowing to take eyes off the road. A significant difference was found between eyes off the time for the vertical and the NHTSA with p-value (0.003) < 0.05 at significance level 0.05. There is enough evidence to reject the null hypothesis. The data analysis indicates that eyes off-road time measured through reaction time is greater than the NHTSA guideline.
A one-tailed paired t-test was also run to find the statistical difference between the average correct target search reaction time. The average rea- ction time for the vertical grid is 5.45 seconds, and the horizontal grid 3.76 seconds. At significance level 0.05 difference between the average reaction time of vertical and horizontal grid conditions was not significant with a
Tesla Model 3: Impact of Vertical Segmentation on Visual Search Time 7
Table 2. Subjective feedback with respect to number of participants reported it.
Table available in the original PDF paper.
Task Difficulty Faced
UI not Intuitive
Cluttered UI
Easy Task
More Time Requi- red for search
8 6 5 2 -
Find the speed limit of the road?
4 - - - 6
Find how many miles away is your destination?
5 - - - 6
Find how much time (minu- tes) it will take to reach the destination?
- - - - -
Find the miles away is the next turn?
7 - - 4 -
Find the temperature of the car?
11 - 11 - -
Find how many miles a car can travel with the current charged battery?
Figure 4: Task success (Left) plot between the task and the number of participants able to succeed in vertical and horizontal grid conditions. Visual search time (Right) plot between the correct reaction time for vertical and horizontal grid conditions.
p-value (0.06) > 0.05. Fail to reject the null hypothesis. There is not enough evidence to support the hypothesis. The data analysis indicates that the average reaction time of different grid conditions is not statistically different.
CONCLUSION
The findings from the study provide strong evidence that visual search is easy, takes less visible search time, high rate of successful target search, and target miss is less when the information is arranged using horizontal grid interface segmentation. The reduction in visual search time from an average of 5.45 seconds in the vertical grid to 3.76 seconds in the horizontal grid indicates that drivers can search target information faster in the horizontal grid. This finding aligns with the research findings from the Goonetilleke et al. in 2002 and Liu and Ka-lun in 2018. They proposed an image segmentation strategy
8 Mathur and Moallem
to improve visual search performance. Visual search is predominantly hori- zontal, and scanning speed is faster for horizontal than for vertical search. Based on participant subjective responses and incorrect visual search, many incorrect visual searches were observed in vertical grid conditions. Partici- pants failed to differentiate target information from similar-looking entities around the target. This trend closely resembles with the observations stated by Adamo et al. in 2013 and Mitroff et al. in 2015 that human tends to make target miss error when multiple targets are presented. When the safety of an individual is concerned, these critical visual target search tasks require high efficiency, and accuracy is needed as a missing target can cause adverse con- sequences (Mitroff et al., 2015). Using horizontal grid design in the interface so that drivers’ visual search task efficiency, accuracy, and speed increases. To decrease the search time interface must include a larger font size for crucial information, be presented near the driver’s viewpoint, avoid visual clutters, and use discoverable icons to display its effectiveness. A clear depiction of the mode through robust design is required. A more prominent green color bat- tery icon should be included in a tiny greyed-out to match the user’s mental model. In future studies, driver’s usability needs can be considered will inte- racting with the in-vehicle infotainment system and considering other factors that affect the visual search performance.
LIMITATIONS OF THE STUDY The stimuli dimension was the major limitation in the visual search task design. Also, a small number of participants posed a limitation for the available data for analysis.
ACKNOWLEDGMENT
I would like to acknowledge my advisor for this project Dr. Abbas Moallem for all the time, effort, and guidance he gave me. I couldn’t have done it without him. I want to say thank you to my colleagues at SJSU who helped me make it this far in the program. Lastly, a special thanks to my family for supporting me in all possible ways.
REFERENCES
Adamo, S. H., Cain, M. S., & Mitroff, S. R. (2015). Targets need their own personal space: Effects of clutter on multiple-target search accuracy. Perception, 44(10), 1203–1214. Ahmad, B. I., Langdon, P. M., Godsill, S. J., Hardy, R., Skrypchuk, L., & Donkor,
R. (2015, September). Touchscreen usability and input performance in vehicles under different road conditions: an evaluative study. In Proceedings of the 7th International Conference on Automotive User Interfaces and Interactive Vehicular Applications (pp. 47–54). Backs, R. W., Walrath, L. C., & Hancock, G. A. (1987, September). Comparison of horizontal and vertical menu formats. In Proceedings of the Human Factors Society Annual Meeting (Vol. 31, No. 7, pp. 715–717). Sage CA: Los Angeles, CA: SAGE Publications.
Tesla Model 3: Impact of Vertical Segmentation on Visual Search Time 9
Gaffar, A., & Kouchak, S. M. (2017, September). Minimalist design: an optimized solution for intelligent interactive infotainment systems. In 2017 Intelligent Systems Conference (IntelliSys) (pp. 553–557). IEEE. Gaspar, J., & Carney, C. (2019). The effect of partial automation on driver attention:
a naturalistic driving study. Human factors, 61(8), 1261–1276. Grahn, H., & Kujala, T. (2020). Impacts of Touch Screen Size, User Interface Design, and Subtask Boundaries on In-Car Task’s Visual Demand and Driver Distraction. International Journal of Human-Computer Studies, 102467. Li, N., & Boyle, L. N. (2019). Allocation of driver attention for varying in-vehicle
system modalities. Human factors, 0018720819879585. Liang, Y., Lee, J. D., & Yekhshatyan, L. (2012). How dangerous is looking away from the road? Algorithms predict crash risk from glance patterns in naturalistic driving. Human Factors, 54(6), 1104–1116. Liu, K., & Ka-lun Or, C. (2018, September). Effects of Image Segmentation and
Target Number on Visual Search: An Eye-Tracking Study. In Proceedings of the Human Factors and Ergonomics Society Annual Meeting (Vol. 62, No. 1, pp. 1987–1991). Sage CA: Los Angeles, CA: SAGE Publications. Ojanpää, H., Näsänen, R., & Kojo, I. (2002). Eye movements in the visual search of word lists. Vision Research, 42(12), 1499–1512. Olson, R. L., Hanowski, R. J., Hickman, J. S., & Bocanegra, J. (2009). Driver distra-
ction in commercial vehicle operations (No. FMCSA-RRT-09–042). United States. Department of Transportation. Federal Motor Carrier Safety Administration. Mitroff, S. R., Biggs, A. T., & Cain, M. S. (2015). Multiple-target visual search errors: overview and implications for airport security. Policy Insights from the Behavioral and Brain Sciences, 2(1), 121–128. Nielsen, J. (2005). Ten usability heuristics. NHTSA, U. (2013). Distracted driving 2013. Traffic Safety Facts Research Note. Parkhurst, E. L., Conner, L. B., Ferraro, J. C., Navarro, M. E., & Mouloua, M. (2019,
November). Heuristic Evaluation of A Tesla Model 3 Interface. In Proceedings of the Human Factors and Ergonomics Society Annual Meeting (Vol. 63, No. 1, pp. 1515–1519). Sage CA: Los Angeles, CA: SAGE Publications. Suh, Y., & Ferris, T. K. (2019). On-road evaluation of in-vehicle interface characteristics and their effects on performance of visual detection on the road and manual entry. Human factors, 61(1), 105–118. Wickens, C. D. (2002). Multiple resources and performance prediction. Theoretical
issues in ergonomics science, 3(2), 159–177.
LISTED IN THE AHFE DIGITAL BOOKSTORE CATALOGUE
Explore the complete digital volume
Usability and User Experience
Read this individual research paper free through the original publisher, or explore the full digital proceedings book.
ISBN 978-1-958651-15-5
Explore this ISBN in the AHFE Bookstore ↗Listed in the July 2026 bookstore catalogue; search by ISBN to confirm current availability · Digital book purchase optional