Weiyi Shen, Beiyuan Guo (2025). The application of an RGB-D camera for monitoring the allocation of visual attention among high-speed train drivers. In: Human-Computer Interaction & Emerging Technologies. AHFE Open Access, vol. 195, pp. 115–122. https://doi.org/10.54941/ahfe1006229
With the continuous development of autonomous driving technology in China’s high-speed trains, automatic train operation (ATO) system has begun to assume certain driving tasks, while the primary responsibility of drivers has progressively transitioned to a more pivotal supervisory role. However, in a long-term highly automated work environment, drivers may experience a decrement or even a complete loss of situation awareness (SA), which can precipitate delayed responses to emergencies, thereby compromising the safety of train operations. To understand the alterations in drivers’ SA during supervisory tasks, it is imperative to first acquire knowledge of their visual attention allocation. Consequently, this study aims to propose a monitoring method based on an RGB-D camera to investigate the visual attention allocation of high-speed train drivers across varying levels of SA. Initially, an RGB-D camera is employed to capture the driver’s 3D information during operation and to conduct face detection. Subsequently, the driver’s eye movements and head poses are analyzed using this 3D information. Thereafter, visual attention features are extracted from this information to estimate the visual attention allocation. Finally, experiments are conducted to analyze the changes in visual attention allocation of high-speed train drivers under different SA levels. The experimental results indicate that the application of an RGB-D camera effectively monitors alterations in visual attention among high-speed train drivers with differing levels of SA, revealing that drivers with high SA allocate a greater proportion of their visual attention to the driver machine interface compared to those with low SA. These findings offer a crucial reference for enhancing the supervising efficiency and operational safety of high-speed train drivers.
With the continuous expansion of high-speed railway networks in China, high-speed and high-density train operations have become the new norm in operations management. The application of automatic train operation (ATO) system in China has significantly enhanced train operation efficiency and reduced train tracking intervals, while also diminishing traction energy consumption and the influence of human factors on the transportation system. The current ATO system belongs to the Grade of Automation 2(GoA2) and still necessitate drivers to execute certain operational tasks, however, their primary role has progressively transitioned to more critical supervisory responsibilities. Engaged in supervisory tasks within a highly automated work environment over extended periods, high-speed train drivers may incrementally direct less attention to the driving environment and ultimately confront a decline or even a loss of situation awareness (SA) (Endsley, 2017 and Gao et al., 2024; Xu and Gao, 2024). The underlying mechanism of this reduction or loss of SA remains unclear. Nonetheless, alterations in visual attention typically correspond to this process, and several studies have corroborated the close relationship between visual attention and SA (Grundgeiger et al., 2022 and Lee et al., 2022). Consequently, the objective of this study is to investigate the allocation of visual attention among high-speed train drivers across varying levels of SA.
Driving a high-speed train constitutes a complex and protracted task that necessitates a high level of driver attention and comfort. To avoid disrupting the driver’s driving state, a non-contact device is essential for remotely capturing and analyzing changes in the driver’s visual attention. Several studies have indicated that visual attention can be estimated within a 3D space using an RGB-D camera. HU employed an RGB-D camera to extend the gaze-following task from the 2D plane to the 3D space, thereby achieving 3D gaze target estimation (Hu et al., 2022). Wang concentrated on head pose to continuously estimate the driver’s gaze zone by determining it from the gaze angle, which is compensated by head pose (Wang et al., 2019). Because of the intricate nature of the scene information in high-speed train driving tasks, a wide range of head movements is often required to ensure precise recognition of the information. Consequently, this study fuses head pose information and eye movement information to monitor the visual attention allocation of drivers.
METHODOLOGY
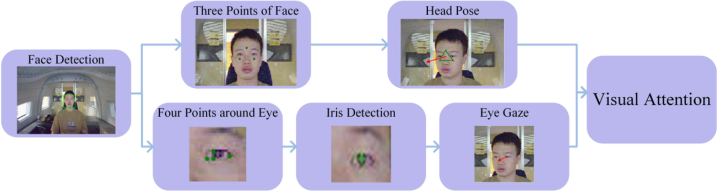
The visual attention allocation of high-speed train drivers is monitored by an RGB-D camera, and the specific process is shown in Figure1. Firstly, the 3D information of the high-speed train drivers is collected and the head pose and eye movement information are extracted. Secondly, the two information are fused and appropriate weights are assigned to obtain the actual gaze. Finally, the gaze is mapped onto the driver’s cab to obtain the visual attention allocation.
The Application of an RGB-D Camera for Monitoring the Allocation 117
Figure 1: Proposed methodology for monitoring visual attention allocation.
Head Pose Head pose can reflect the direction of an individual’s visual attention, and the influence of head poste must be emphasized when monitoring the allocation of visual attention. In this study, the head pose is estimated using 3D image data, and facial landmarks are identified following the successful detection of the face. The 68 facial landmarks detection from the Dlib are utilized and refined, with the forehead and the smooth areas of the left and right cheeks selected as key points to mitigate interference from objects such as hair and glasses.
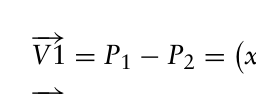
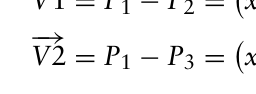
The head pose can be determined from the normal vector of the face plane. Based on the 3D information of the face, the coordinates of the forehead key point as well as the key points of the left and right cheeks can be determined as P1(x1, y1, z1), P2(x2, y2, z2), P3(x3, y3, z3), and from this, two vectors V1 and V2 are constructed with the formula(1):
Equation reproduced from the original PDF.
Equations and mathematical formulas are available in the original paper PDF.
Equation reproduced from the original PDF.
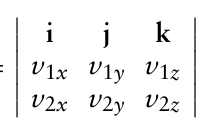
x1 −x3, y1 −y3, z1 −z3 After constructing the two facial vectors, the head pose information can be obtained by the formula (2):
Equation reproduced from the original PDF.Equation reproduced from the original PDF.
v1yv2z −v1zv2y, v1zv2x −v1xv2z, v1xv2y −v1yv2x where v1x, v1y, v1z are components of −→ V1 and v2x, v2y, v2z are components
of −→ V2.
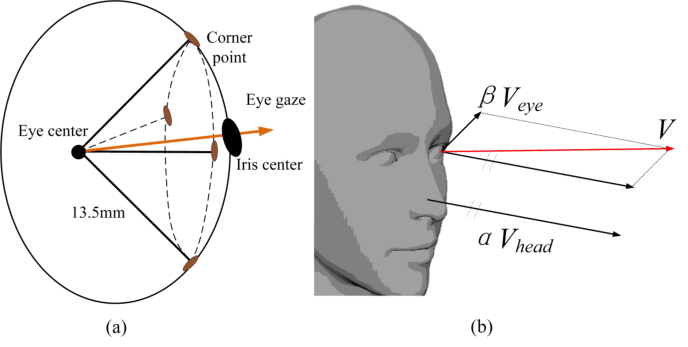
Eye Gaze The 3D eye tracking technique is grounded in a 3D eye model, and Figure 2a illustrates that eye gaze information can be estimated by the vector that link the eye center to the iris center. Utilizing the outcomes of facial landmarks detection, the four corner points surrounding the eye can be ascertained. Furthermore, based on anatomical knowledge, the eye center is typically
118 Shen and Guo
situated 13.5 mm posterior to the corneal surface (Kim et al., 2017). This information, when integrated with depth data, facilitates the fitting of the eye center using the least squares method:
Equation reproduced from the original PDF.
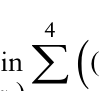
(Xi −xC)2 +
Yi −yC
Equations and mathematical formulas are available in the original paper PDF.
(xc,yC,zc) i=1 (3) where (Xi, Yi, Zi), i = 1, 2, 3, 4 is the coordinates of the eye corner points, and (XC, YC, ZC) is the coordinate of the eye center.
Figure 2: (a) A 3D eyeball. (b) Eye gaze vector.
Generally, the iris region exhibits a distinct color contrast with the surrounding areas, allowing for the application of threshold segmentation to ascertain the iris’s location. Through erosion and dilation operations on the segmented binary image, artifacts such as islands and holes are eliminated, yielding a more accurate representation of the iris region. Subsequent contour detection of this region facilitates the identification of its center point, corresponding to the iris center. Figure 3 illustrates the entire process of iris center detection. Incorporating depth information enables the derivation of the vector connecting the eye center to the iris center, which constitutes the eye gaze vector.
Figure 3: The process of iris center detection.
Figure available in the original PDF paper.
Visual Attention High-speed train drivers engaged in driving tasks frequently encounter complex situations necessitating the coordinated movement of the head and
The Application of an RGB-D Camera for Monitoring the Allocation 119
eyes to focus attention on areas of interest (AOI). In the examination of human gaze behavior, the head is frequently regarded as more pivotal than the eyes in establishing gaze direction, as alterations in head pose can markedly broaden or restrict the field of vision, thereby influencing visual attention allocation. This study integrated head pose and eye gaze data with assigned weights of 0.7 and 0.3, respectively. The resultant gaze vector, which extends through the iris center, indicates the direction of visual attention, as depicted in Figure 2b.
EXPERIMENT Experimental Apparatus and Subjects
A total of 8 subjects (six males and two females) with an age range of 22–24 years were enrolled in the experiment. The experiment was conducted on a high-fidelity train driving simulator utilizing the CR400BF high-speed train model. 3D data were captured by an ORBBEC Gemini 2XL camera and processed in real-time via a personal computer linked to the camera.
Tasks and Procedure The task was designed as a driving supervision activity in ATO mode, necessitating that subjects maintain attention to the railway ahead while concurrently monitoring the Automatic Train Protection (ATP) screen and Train Control and Management System (TCMS) screen. Subjects are tasked with operating the train from Beijing North Station to Xiahuayuan North Station (55min), during the session, three random freeze interruptions will be introduced, at each of which the subject must respond to situation awareness global assessment technique (SAGAT) queries. The responses will serve as an indicator of their SA level. Following adequate training, subjects will engage in the formal experiment. Upon completion of the task, subjects will be provided with a reward. This experiment was approved by the Beijing Jiaotong University.
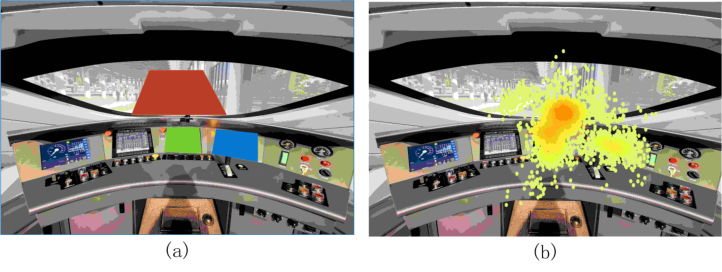
Data Analysis and Processing Depth data and color video are captured at a rate of 20 frames per second. Each frame undergoes analysis to yield a single gaze point, resulting in approximately 60,000 gaze points per subject following outlier removal. The driving environment is segmented into distinct AOIs based on various information areas, such as the railway (AOI-1), the ATP screen (AOI-2), and the TCMS screen (AOI-3), as depicted in Figure 4a. The number of gaze points within each AOI is tallied to determine the visual attention metrics, encompassing the fixation counts, fixation density, and mean fixation duration. Concurrently, these metrics are categorized into various SA based on the outcomes of the SAGAT queries.
Each SAGAT included 10 questions (including information on speed, external environment, signal display, etc.), with the proportion of correct responses used to determine the assessment outcome. For the first two queries, the majority of subjects achieved high scores (MEAN = 0.82, SD = 0.08), whereas in the final query, the scores were lower (MEAN = 0.53, SD = 0.10). Post-experimental interviews revealed that participants reported significant fatigue and a decrease in attentiveness during the latter stages of the task, which likely accounted for the marked decline in accuracy. Previous researches have demonstrated that fatigue results in diminished SA (Vogelpohl et al., 2019 and Zhou et al., 2023).
The experimental result indicated that subjects directed their visual attention to multiple objects, such as the forward railway, the ATP screen, and the buildings flanking the railway, as illustrated in Figure 4b. However, irrespective of the level of SA, the majority of subjects’ visual attention was directed towards the forward railway. Our findings revealed that at the lower SA, approximately 79.4% of fixation counts were focused on the forward railway, compared to a 14.6% reduction at the higher SA. This trend is consistent with the participants’ interview responses, which suggest that their reduced SA was due to fatigue, resulting in decreased information processing and a narrowed field of view (Mohammadfam et al., 2021), leading to a neglect of the driver machine interface (DMI) in favor of looking ahead. The analysis of mean fixation duration indicated that the AOI-1 was persistently the focus of longest attention, irrespective of SA levels, whereas attention to the AOI-3 was minimal. Furthermore, a notable reduction in fixation duration to the AOI-2 was observed when SA dropped (p < 0.05). The fixation density on the AOI-2 reached its peak when drivers had high SA, and it significantly declined as their SA waned (p < 0.05). It is believed that fixation density reflects cognitive effort and the processing of information (Shojaeizadeh et al., 2016), and a high level of fixation density on the AOI-2 suggests that drivers are engaging in more intensive information processing, which in turn enhances their SA.
Our findings indicate that RGB-D camera is an effective tool for monitoring the visual attention allocation of high-speed train drivers.
The Application of an RGB-D Camera for Monitoring the Allocation 121
The study reveals that drivers with high SA direct their visual attention not solely to the railway ahead for crucial route information, but also devote significant attention to the ATP screen. These results underscore the critical function of ATP screen in the operation of high-speed trains. The SA of drivers can be markedly improved through the optimization of information display on the ATP screen and enhancing the efficiency of information retrieval. This study not only offers novel technical insights for enhancing the safety of high- speed train operations but also serves as a pivotal reference for the future design of DMI interactions.
REFERENCES
Endsley, M. R., 2017. From Here to Autonomy: Lessons Learned From Human–Automation Research. Hum Factors 59, 5–27. https://doi.org/10.1177/ 0018720816681350 Gao, Q., Chen, L., Shi, Y., Luo, Y., Shen, M., Gao, Z., 2024. Trust calibration through perceptual and predictive information of the external context in autonomous vehicle. Transportation Research Part F: Traffic Psychology and Behaviour 107, 537–548. https://doi.org/10.1016/j.trf.2024.09.019 Grundgeiger, T., Hohm, A., Michalek, A., Egenolf, T., Markus, C., Happel, O., 2022.
The Validity of the SEEV Model as a Process Measure of Situation Awareness: The Example of a Simulated Endotracheal Intubation. Hum Factors 64, 1181–1194. https://doi.org/10.1177/0018720821991651 Hu, Z., Yang, D., Cheng, S., Zhou, L., Wu, S., Liu, J., 2022. We Know Where They Are Looking at From the RGB-D Camera: Gaze Following in 3D. IEEE Trans. Instrum. Meas. 71, 1–14. https://doi.org/10.1109/TIM.2022.3160534 Kim, B. C., Ko, D., Jang, U., Han, H., Lee, E. C., 2017. 3D Gaze tracking by
combining eye- and facial-gaze vectors. J. Supercomput. 73, 3038–3052. https: //doi.org/10.1007/s11227-016-1817-5 Lee, Y., Jung, K.-T., Lee, H.-C., 2022. Use of gaze entropy to evaluate situation awareness in emergency accident situations of nuclear power plant. Nuclear Engineering and Technology 54, 1261–1270. https://doi.org/10.1016/j.net.2021. 10.022 Mohammadfam, I., Mahdinia, M., Soltanzadeh, A., Mirzaei Aliabadi, M.,
Soltanian, A. R., 2021. A path analysis model of individual variables predicting safety behavior and human error: The mediating effect of situation awareness. International Journal of Industrial Ergonomics 84, 103144. https://doi.org/10. 1016/j.ergon.2021.103144 Shojaeizadeh, M., Djamasbi, S., Trapp, A. C., 2016. Density of Gaze Points Within a Fixation and Information Processing Behavior, in: Antona, M., Stephanidis, C. (Eds.), Universal Access in Human-Computer Interaction. Methods, Techniques, and Best Practices, Lecture Notes in Computer Science. Springer International Publishing, Cham, pp. 465–471. https://doi.org/10.1007/978-3-319-40250-5_44 Vogelpohl, T., Kühn, M., Hummel, T., Vollrath, M., 2019. Asleep at the
automated wheel—Sleepiness and fatigue during highly automated driving. Accident Analysis & Prevention, 10th International Conference on Managing Fatigue: Managing Fatigue to Improve Safety, Wellness, and Effectiveness”. 126, 70–84. https://doi.org/10.1016/j.aap.2018.03.013 Wang, Y., Yuan, G., Mi, Z., Peng, J., Ding, X., Liang, Z., Fu, X., 2019. Continuous Driver’s Gaze Zone Estimation Using RGB-D Camera. Sensors 19, 1287. https: //doi.org/10.3390/s19061287
122 Shen and Guo
Xu, W., Gao, Z., 2024. Applying HCAI in Developing Effective Human-AI Teaming: A Perspective from Human-AI Joint Cognitive Systems. interactions 31, 32–37. https://doi.org/10.1145/3635116 Zhou, X., Han, J., Qin, H., Xue, C., 2023. Research on multilevel situation
awareness changes under the cumulative effect of mental fatigue. Cogn Tech Work 25, 203–215. https://doi.org/10.1007/s10111-023-00723-9
Read this individual research paper free through the original publisher, or explore the full digital proceedings book.
ISBN 978-1-964867-71-7
Explore this ISBN in the AHFE Bookstore ↗Listed in the July 2026 bookstore catalogue; search by ISBN to confirm current availability · Digital book purchase optional