Traditionally, human-computer interaction is conceived and assessed through the restrictive scope of usability. Although this approach has led to an overall improvement of the interfaces ease-of-use, it should now be overstepped. The question of the positive affect of users has become crucial for the interface project stakeholders. Our research is mostly turned towards applied perspectives. Our general hypothesis is that design strategies may affect positively the user, and influence a better attractiveness of the interface. Our objective is to define good design practices by assessing a set of emotional design patterns. In a first section, we will report an interview session with designers in order to identify any pattern of design for an emotional interface. Then, we will present and discuss a method to measure user’s emotion during an interface interaction experience. The experimental setup gathers screen records, face recognition, galvanic skin response, and questionnaires. These complementary sources bring forward the behavioral, physiological, and subjective emotional responses of the user. We will discuss how these resources can be used in order to measure the emotional effect of a specific user interface.
In the area of user interface design, during numerous years, it was advocated to apply a user-centered approach, putting forward ergonomic recommendations, or "golden rules" (Norman, 2002; Shneiderman, 2005). These recommendations tended to focus on users’ cognitive and perceptual-motor abilities, seeking for an ever-reduced cognitive load required by tasks and interactions. Thus, human-computer interaction is traditionally conceived and assessed through the restrictive scope of usability rather than based on what users felt when interacting with a system. (Bastien & Scapin, 1993, Hancock, Pepe & Murphy, 2005). Although this approach has led to an overall improvement of the interfaces ease-of-use, it should now be overstepped. Therefore, nowadays, humans and their interactions with systems are increasingly being studied. For instance, Don Norman suggests to analyze three different levels related to interface use: “knowing, doing and feeling” (Norman, 2005). Moreover, in recent years, the "feeling" level has become a popular research topic in cognitive science and the science of design. When developing new products or systems, designers have to come up with design solutions that are both novel and adapted to their future users (Shneiderman, 2004; Bonnardel, 2012). Towards this end, designers have to take into consideration other dimensions than the ones related to “usability”. Especially, new systems must also inject a little fun and pleasure into people's lives (Norman, 2002). Thus, in addition to their functional characteristics, interactive systems must be regarded as conveying feelings through interfaces’ design features. The question of the feelings of users – preferentially associated to positive emotions - has become crucial for the interface project stakeholders. This new field of research is related to two general objectives: understanding users’ emotional processes; understanding how to arouse conscious or unconscious emotion through an interface.
Therefore, our objective in this paper is to present and discuss a method to measure user’s emotions during an interface interaction experience. Towards this end, we first define this concept and point out its characteristics in the context of user interface design. Then, we turn towards interface designers to understand their views, and identify specific emotional design patterns to be evaluated. Finally, we present a method that we suggest for measuring emotions elicited by an interface design. Indeed, such a method is required to evaluate the effectiveness of specific design patterns.
Our study contributes to the definition of a reference-protocol pinpointing interaction and design features eliciting the user’s emotions. These results will then be used in the context of a software called SKIPPI, which aims to favor designer’s creativity. We participated to this research by analyzing end-users needs and representations, and by providing requirements for the SKIPPI application design. These studies questioned the emotional effect of the interface, in regards to the emotional value of the displayed content. A protocol of evaluation had to be drawn up in order to distinguish the emotional value of the interface design.
DEFINING EMOTION To conceive an effective emotional assessment system, a first step is to understand the nature of emotion. In this section, we focus on the main models aiming at describing the emotional phenomena from the psychological domain.
A variety of approaches of emotional phenomena has been proposed in different fields of psychology: phenomenological, behaviorist, physiological, cognitive approaches (Strongman, 2003). Although no real consensus was established, recent models of emotions are based on the notion of appraisal, put in light by Arnold (1945), and Schachter (1959): a cognitive process is required to evaluate a stimulus in order to give rise to emotions. Following this view, the appraisal processes two components, internal and external (Mandler, 1982; Desmet, 2003; Scherer, 2005). This latter external component corresponds to the stimulus’ features, whereas the internal component refers to the individual’s past experiences and expectations. The sequence of fast but complex evaluations builds the relevancy of the stimulus (Frijda, 1986, Scherer & Tannenbaum, 1986), and prepares the user to react. This reaction may be expressed by cognitive, behavioral and physiological changes (Gil, 2009).
An example would make these notions clearer. At a railway entrance, escalators are located next to the traditional stairs, leading to the upper platforms. Usually, most public use the escalators, because they require less effort and less time. They are more efficient, therefore more usable, and this view is strengthen by our experiences. In 2009, a temporary art installation was setup in one of these stairs in a Stockholm subway (The fun theory, 2009). At night, the stairs steps had been covered in white and black, so that the overall stairway looked like a piano keyboard. The next morning, a first subway user noticed the change: a new cognitive evaluation was performed as the environment was unusually different. The user identified the external features of the painted stairs, and compared them to his internal passed experiences; he identified a stairway to go upstairs, and a keyboard to play piano. This incongruity generated an emotion: surprise, leading to a desire to know more, curiosity. His heart rate increased a little (physiological reaction), and, smiling, he walked towards the piano stairway (behavioral reaction). As he walked up the stairs, the user heard the sound of the piano notes matching his steps. The artist had developed the metaphor further, increasing the incongruity effect, and the pleasure for the users. Some of the users played with the piano stairs, running up and down. Finally, although it was less efficient and usable than the escalators, most of the users chose the piano-stairs that day.
Figure 1: The piano-stairs: how emotional design can influence users behaviors
This example demonstrates how a positive experience may influence the users behaviors, beyond the actual usability of the interface. Preferences and decisions being based on affect (Vakratsas & Allen, 1999; Sanabria, Cho, Sambai, & Yamanaka, 2012), we perceive the relevancy of the appraisal notion for our study as a way to better guide the users towards an objective.
Scherer (2005) defined the emotion as being a relatively intense affective experience, whose cause is clearly identified, and which does not last very long. If the emotion leads to an action tendency, then Scherer defines it more precisely as an ‘utilitarian emotion’ (anger, fear, joy, disgust), whereas an ‘aesthetic emotion’ (such as admiration, ecstasy, fascination), would not lead to action.
Two main streams can be drawn to define emotion: a dimensional perspective and a discrete perspective.
This latter discrete perspective views emotions as a sum of categories, which can possibly be intersected or intensity-faded to get finer sub-categories. Several models were proposed, where the number of basic and global emotions varied. For instance, Plutchick (1980) considers eight primary emotions (joy/sadness, trust/disgust, fear/anger, surprise/anticipation), based on their ability to trigger a fight-or-flight behavior. These discrete models are quite popular, especially in the design field, because they are easily linkable to the ‘folk psychology’: most common vocabulary terms standing for different emotions are localized into discrete model schemes, making them easy to handle. This may constitute an advantage in certain conditions.
However, certain drawbacks were pinned on these discrete models. Numerous studies show that an emotion may be difficult to categorize (Barrett & Wager, 2006). A term-based categorization would imply to share a same cultural and language background. In the same view, it would imply to skip any inter-individual variation in the interpretation of the meanings of the terms. By definition, a discrete model limits the potential number of emotions, disallowing any deeper and more accurate identification and inducing biases.
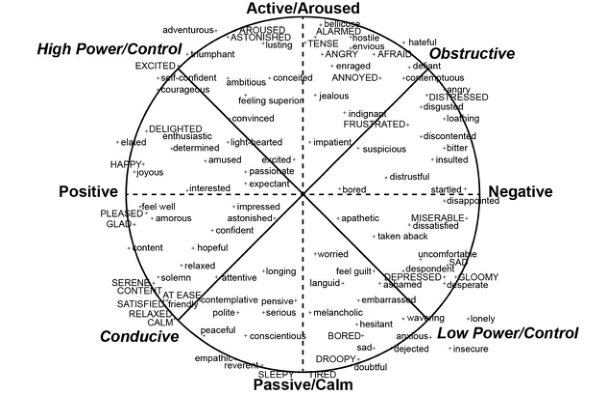
For these reasons, other models of emotions co-exist, based on a dimensional perspective. Among researchers, the number of dimensions varies. However, two dimensions emerge of most of the dimensional models: valence and arousal (Russell, 1980, Russell & Barrett, 1999). Valence corresponds to a pleasure/displeasure scale, whereas activation corresponds to a sleepiness/excitation scale. These scales define a circumplex space where it is possible to locate any ‘folk-psychology’ emotional term.
Other scales may be superposed on this basis, such as dominance/submissiveness (Mehrabian, 1996), which stands for the capacity of the participant to control the stimulus. In the same view, Scherer (2005) proposes two scales that are compatible with Russell’s scheme: goal conduciveness, and coping potential. This allowed Scherer to locate more precisely eighty frequently used emotions categories (Figure 2).
Figure 2: Alternative dimensional structures of the semantic space for emotions (Scherer, 2005)
A MODEL OF USER INTERFACE EMOTION Russell ‘s analysis of the effects of emotions (Russell, 2003) allows us to point out relevant connections with the concern of interface user experience. Indeed, a positive valence improves attention and positive judgments (Sanna, 1998; Park & Banaji, 2000; Schwarz & Bless, 1991), whereas arousal influences cognitive performance (Humphreys & Revelle, 1984) and attention selectivity (Easterbrook, 1959; Eysenck, 1982). Combining a high arousal and valence gives a person a sense of optimism in choosing goals and plans. Other works also demonstrated how positive emotions could improve task efficiency and learning (Bonnardel, 2011, Bonnardel & Moscardini, 2012, D’Mello & Graesser, 2012, Davis, 2009).
Such conclusions lead to a justification of efforts towards a positive emotional interface design. Therefore, in order to favor positive emotions from the users, it appears first necessary to determine whether and how an interface design may influence activation and arousal of the users’ emotional response.
As stated above, the appraisal process resulting to the emotion is also fed by internal factors, such as user’s passed experience, cultural background, concern and involvement with the task. Thus, the interface design, resulting from designers’ work, is only one of the many variables eliciting end-users’ emotions.
Desmet (2003) proposed a four components “basic model of product emotions”: the emotion (1) results from an appraisal process (2), based on user’s concern (3), and product’s features (4). For Desmet (ibid.), user’s “concern” stands for the individually perceived utility, this perception being potentially affected by personality traits. Desmet adds that the product component is not always the direct stimulus of the emotion; the product may also elicit thoughts which are the actual stimuli. This view is in line with Norman’s proposal (2004), who distinguishes three emotional levels of the user affect with regard to a product: visceral, behavioral and reflective. The first visceral level is a direct gut feeling, whereas the two other levels are based upon the user’s consideration over the interaction (behavioral), or a more social/intellectual judgment (reflective).
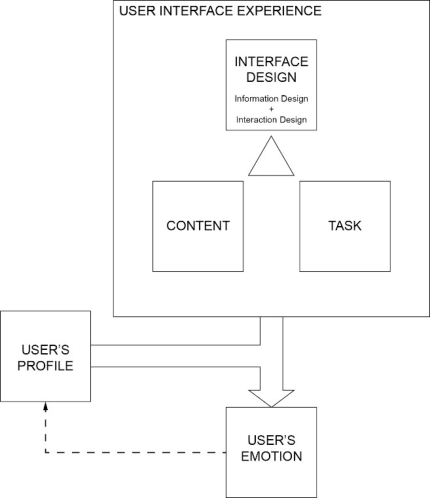
Considering the specificities of interface design as a product, our study requires to sharpen the “product” component. Therefore, we propose another model that highlights some specificities of an interface as a product of design (Figure 3).
Figure 3: Model of user interface emotion
In this figure, the user’s profile (internal) constitutes the baseline upon which the current interface (external) is appraised to give rise to emotions. In this view, this diagram matches the two internal/external components processed by the appraisal leading to emotions, as stated earlier. The diagram is also compatible with the “concern/product” dichotomy from Desmet’s model.
Here, however, the “product” component is replaced by the label of “user interface experience”. Two main considerations were taken into account for this change. First, the notion of “experience” refers to a continuous interaction with the product, implying ever-evolving changes of the system values. Second, our study focuses on “user interface”. The specificities of a screen-based interactive product lead us to distinguish three specific components, each of them constituting stimuli eliciting user’s emotions:
The “content” stands for the information and data to be communicated to the users. It gathers textual elements (e.g. titles, articles), pictorial elements (e.g. photographs, illustrations, and diagrams), videos, music. Typically, content is created by redactors, whereas the interface is defined by designers.
The “interface design” stands for the layout and presentation strategies of the content and the functionalities. We refer to “information design” for information display strategies, and to “interaction design” for ways users interact with the interface, including the embedded functions.
The “task” refers to the purpose of the interface which has to be handled by any users (search, read, compare, calculate, organize…). Performing this task may induce an emotion.
These three items define the user interface experience, and are closely related.
The “user’s profile” refers to the specificities of the user, at the moment of the interaction. This item could potentially gather numerous inter-individual variables, such as cultural background, previous knowledge related to the content (brand, images, related articles…), to the interaction modes, user’s personality, mood… The user interface experience, considered as a global external stimulus is therefore assessed through the user’s profile’s internal scope, eliciting the emotion. This global process should be considered as continuous and iterative. The user’s emotion contributes to the evaluation of the overall interface experience. It may affect the perceptions of the content, of the task, and slightly change the user’s profile. Indeed, these changes constitute the designer’s goals, aiming at influencing the users’ actions and behaviors.
This model brings forward the relationships between the various components contributing to elicit the end-user’s emotion. The interface design is a core component. Interwiews were performed with some interface designers in order to identify any interface design pattern to be assessed.
INTERFACE DESIGNERS’ REPRESENTATIONS Emotional design has become a crucial issue for interface designers. However, most of designers’ practices are empirical. In contrast, our general objective is to find ways for analyzing and assessing end-users’ emotions elicited by a specific interface design strategy. As a first step to identify those design strategies, a collective interview was performed with three product and interface designers of varied profiles (Table 1). The interview took place in a meeting room of the designers’ studio, and lasted for two hours.
Table 1: Participants profiles for the interview.
The interview was structured on an opened basis: a debate was set up between the designers about their strategies to pass trust, desire, and surprise through an interface. They were also asked to discuss any other emotion they considered relevant. The initial question to initiate the debate ways: “We are interested into the ways to pass an emotion through an interface. In your design methods, you may be aware of such an approach. These emotions would likely be positive. I selected three of them for instance: trust, desire -in the sense of teasing and attracting the user-, surprise. What would your strategies be?”
Several themes were expressed by the designers, from which the following synthesis is proposed: Usability first
The ergonomic criteria (Bastien & Scapin, 1993), lead to the intuitiveness, the consistency and a good learnability. These qualities participate to the feeling of trust towards the application, and by extension, towards the brand. Ergonomic criteria are very important for the designers, various examples were evoked, involving consistency, compatibility, guidance, cognitive load, information structure and display, immediate feedback… Usability is also related to the notion of robustness (actual effectiveness and efficiency), completed by the notion of perceived robustness (related to the graphic design). Indeed, usability is not a strategy to convey emotion, it is rather a fundamental basis without which it is not possible to conceive any emotional interface.
Error handling Following this view towards robustness, the specific context of error handling gives matter to illustrate the designers’ considerations. The error message constitutes an occasion to initiate a dialog with the user, and consequently, to elicit user’s emotions: “We try to explain to [the user] what is wrong, with ‘human terms’. Then, we suggest a way to solve the problem. If we really can’t, we apologize.” This statement clearly emphasizes the designers’ point of turning the human-machine interaction into a human-human interaction.
Identity “The keyword is ‘personalization’ […]. We create a relationship because people do not completely trust machines yet”. In order to build up such an interaction, replicating natural human behaviors, the visitor or customer should not be considered as an anonymous end-user, but as a real, identified, person. Various means are cited by the designers: personalized messages with user’s name, behavioral habits, and geographical location. Used adequately, these strategies may improve trust towards the application.
As the end-user should be personalized, a strong identity should fit the application. The communication strategy should match a strong and clear identity, based upon consistent choices of graphic design and editorial content: “Personally, I believe much more in a consistent and nice language style used on the whole application, something to be met again, like a ‘home spirit’ “. In certain circumstances, these choices lead to present the applications’ authors to the users, or to use a first-person formulation. The underlying option is to make the interface appear more human, less abstract: “They [the application authors] talk to you as a human being. They talk nicely, normally, with their gut.”
Targeted content Following this view, some content, surprising at first sight, is sometimes used. The designers evoked Balsamiq, a wire-framing application. This application has a little function to display quick and easy cooking recipes. Of course, the user is surprised, but he is also considered as a human being, as a friend: the application author knows how tough is a work of wireframe for a designer, working late at night, without any time to eat. So he included a few simple video recipes from his wife in the application (figure 4).
Figure 4: Balsamiq’s “What should I make for dinner” screen capture Another example quoted by the designers is the short statement in the footer of the Vimeo’s website: “Made with love in New-York city.” (figure 5).Figure 5: Vimeo footer capture
Figure available in the original PDF paper.
Vimeo is a website providing video streaming, turned towards artistic and high quality footage. This simple sentence conveys in fact rich values; the author of Vimeo become tangible humans, with feelings (love), and living in a specific city. They are passionate by their work, just like the targeted user is passionate by his/her video work. These content-based strategies contribute to draw up a human identity to the interfaces, conveying inter-human social emotions, such as trust and sympathy.
Targeting the user These last arguments evoked by the designers share a common background. In order to provide a strong identity of the application, and an according tone matching the end user’s expectations, it is necessary to focus on a specific category of users. This point is consistent with our proposed model of user interface emotion (figure 3): the specific design features have to fit the specific users’ traits. The designers therefore state that the more the interface is emotional, the more the audience has to be targeted: “the most important stage may be to understand who we are focusing on, to identify the triggers of this specific audience.”
Gamification The designers also evoke another way to elicit end-users’ positive emotions based on playful interactions. One of these features is the notion of reward: the user may be congratulated after having accomplished certain actions, and therefore encouraged to keep on use (or discovery) the application. This trigger can also be strengthen using a dimension of “collection”, e.g. the user will want to finish a 70% completion, or to win all the available badges. With this last example, the interaction comes closer to the “collect and reward” play style. It is also conceivable to introduce competition between users, by taking care to elude any counter-productive features. This constitutes a major emotional trigger for any user-content based applications, or any software in its appropriation phase.
Interface designers’ representations: Conclusion This collective interview brought forward several strategies of design. Beyond the essential usability quality of the interface, a global pattern seem to emerge: a machine designed as a human being to elicit end-users’ positive emotions. Nevertheless, this approach might sound paradoxical, as the user is aware he/she uses a machine. A good balance should be weighted between a human/computer relationship on the one hand, and a human/human relationship on the other.
Following this view, we could formulate this hypothesis: the more the user feels the empathy of the author/designer, the more his/her experience is pleasant. According to this hypothesis, the following scheme present different thresholds which would likely influence the users’emotions (figure 6). This diagram was drawn on the basis of the hedonomic’s pyramid (Hancock, Pepe & Murphy, 2005), derived from Maslow (1970).
6. Perception by the user of the author/designer’s empathy: “The author knows me, thought about me, and wants to please me”
5. Perception by the user of the author/designer’s presence: “Someone made this for me”
4. Consistency and targeting of the communication strategy
3. Rigorous optimization of the usability criteria
Figure 6: interface design’s emotional thresholds
Figure available in the original PDF paper.
We notice that the highest the level of conception is, the more the underlying strategies need to focus a specific audience. Utility may answer most of the audience’s needs, but the author’s empathy might only fit a specific audience sensitivity. Therefore, emotional design would only be used for a limited audience, from the 4 th level of the diagram.
At this stage, interviews with designers provided a set of features contributing to define some emotional design pattern. However, these design patterns are still empirical, and have not been assessed yet.
MEASURING INTERFACE USERS’ EMOTIONS In order to build an emotional interface assessment system, an experiment was set up in order to identify the best indicators of the users’ feelings.
Objectives, participants and experimental conditions Our first objective was to test the reliability of the chosen experimental setup to record the user’s emotion during an interface usage episode. Then, our second objective was to test the sensitivity of this setup towards different interface design variations.
Eight participants, French native speakers, two males, six females, from 18 to 30 years old took part in the experiment. They were distributed randomly into two groups (see Figure 4). Three surveys were chosen in order to detect any exception or feature in the individual emotional baselines (Jolland, 2012). Brief Mood Introspection Scale (Mayer & Gaschke, 1983) has been widely used to assess participants’ mood (Baumeister, Bratslavsky, Murayen & Tice, 1998, Halberstadt, Niedenthal, & Kushner, 1995, Kokkonen & Pulkkinen, 2001), and was therefore chosen for this study. The psychological well-being expression scale (Massé, Poulin, Dassa, Lamber, Bélair & Battaglini, 1998), is a four points Likert scale based on seventeen statements related to the user’s emotional expressions during the last month. Stress was assessed by the Lafleur & Béliveau (1994) survey, composed of 109 items matching a large variety of psychic and physic stress symptoms. The users’ results were successfully checked by a normal distribution analysis.
Objective #1: Testing the reliability of the emotional assessment system
To pursue this first objective, we provided users with twelve images with strong high/low or neutral valence. These images were issued from the GAPED (Geneva Affective PicturE Database, Dan-Glauser & Scherer, 2010), a set of 730 pictures, rated among valence and arousal and validated worldwide. We selected the four images with the highest, lowest, and closest to zero valence score were selected to constitute a set of twelve images for this experiment. User’s emotions were recorded during and after each image.
We considered that measuring users’ emotion requires to associate emotional states with at least cognitive and physical changes. These changes may be readable through three components: physiological, behavioral and cognitive (Gil, 2009).
Measuring the physiological component Numerous studies have used physiological measurement and suggest that it constitutes a reliable method to assess users’ emotional state. However, low arousal and long lasting stimuli such as user interaction are less present than stronger punctual stimuli. The galvanic skin response (GSR) is compatible with a continuous monitoring during the use experiment. It can also be considered as an objective measure over which the user has no control. The method that we proposed first relies on a monitoring of the variation of the skin conductance of the user, which indicates a change of activation. In the specific context of an interface usage, the stimuli are long lasting. Therefore, we considered all the falls (SCRs) detected during the stimulus exposure as being relevant. A rest period of 15 seconds was setup between each stimulus presentation. We recorded the mean skin resistance, the number of falls, and falls amplitude. There is no normative reference for GSR measurement, with very large inter-individual differences being reported. Therefore, we use the GSR score to compare the effect of different stimuli, at a different time on the same individuals.
Electrodermal activity was computed using Biopac AcqKnowledge 4.1. following the recommendations provided by Braithwaite, Watson, Jones & Rowe (2013). However we decided not to reject any SCR of low amplitude considering the long lasting and low intensity stimuli.
Our results did not match our expectations, as nearly no skin conductance variation had been recorded during the exposure to the GEW pictures. We also observed this during the ‘Objective #2’ phase. In fact, we noticed that most of the detected SCRs were taking place outside of the stimuli periods. Most of these periods match a stronger activity of the participants: they work at answering questionnaires. Some other activity periods match waiting phases: these waiting screens were setup in order to obtain a baseline for the EDA recording of the following stimulus. Paradoxically, these periods were sometimes used by the participants to relax and stretch during the 40 minutes experiment.
These results mean that the provided task (watching a picture, reading a text, or both), generates much less activation than the task of answering questionnaires about emotions. This low activation impact of the provided pictures is consistent with the SAM questionnaire results (see cognitive component).
Therefore, we will not dismiss the GSR method for our next studies, as it may be relevant to measure the impact of the user experience generating activation, particularly the task component, and presumably the interaction design sub-component (figure 3).
Measuring the behavioral component We also decided to analyze the behavioral component of users’ emotions by analyzing changes on the user’s face. This technic is inspired by the facial action coding system (FACS) (Ekman, 1970), analyzing 69 “action units” of face’s muscles patterns, head orientation, and eyes gaze. Noldus’ Facereader (Noldus, n.d) was developed in order to automate such analyses. The software performs a frame by frame analysis, and detects over 500 key points on the face. The resultant pattern is distributed among seven categories of emotion: neutral, happy, sad, angry, surprised, scared, and disgusted. The system was trained over 10000 manually annotated images. A valence score is calculated as the difference between the happiness score, and the highest negative emotion score. Face analysis provides a continuous monitoring. The measurement can be considered as objective with the limitation of the potential user’s conscious control of his face.
FaceReader’s results per image and participant (Figure 7) present a large dispersion. And more, no consistent pattern is distinguishable among participants, which could have explained a potential inter-individual difference. By calculating a mean per valence group (Figure 8), a slightly trend can be observed matching the expected results. However, the values are much less distinctive than the expected GAPED scores. Therefore, it seems difficult to use FaceReader in that context.
Neutral images
GAPED reference values
1
Negative images
0
Figure 7: FaceReader’s valence score per image and per participant
Figure available in the original PDF paper.
1.5
Neutral images
GAPED reference values
1
Negative images
Positive images
0.5
0
-0.5 -1
-1.5
Figure 8: FaceReader’s mean valence score per image group
Figure available in the original PDF paper.
The difficulties met with FaceReader should however be confirmed in further studies. A frame by frame manual monitoring in order to detect miss-leadings in the face identification should be added to the protocol, as it may happens with barbed users, and hands on face gestures. Otherwise, during later interviews, some users declared that they could have “laughed on the other side of their face”, their reaction being more elicited by the succession of extreme images than by their actual content.
Measuring the cognitive component Finally, in the method we proposed, we measured the cognitive component through two systems of questions. The first one is the Geneva emotion wheel (GEW), which was developed following Scherer’s emotional model (figure.2). A set of twenty emotion labels are arranged in a circle. Each label can be rated according to its intensity using a five points scale, from the center of the circle to its periphery. A drawback of using a label-based system lies in the limitation of the provided set of terms. Moreover, Scherer added a free response area, where the user may choose a word which better fits his feeling. The user may also indicate that no emotion was felt. Another drawback of label-based questionnaires lies in the necessary interpretation by the user of the label meaning. This may lead to different understandings of a same term among participants. Therefore, the second questionnaire we propose to use is the self-assessment manikin (SAM, Bradley & Lang, 1994). This questionnaire is composed of three scales, matching the three dimensions of the valence arousal dominance system. These scales make use of a pictures-based representation of emotional values. The questionnaire is therefore compatible with a wider range of population (children, participant of different languages or cultural background). Clickable screen versions of these two systems of questions were replicated for the purpose of the experiment.
The answers to the questionnaires are consistent with the emotional value of the GAPED images. The GEW clearly presents a split between negative emotions for negative images (in red), and positive emotions for positive images
(in green) (figure 9). Moreover, neutral images are located at the center of the diagram. However, the neutral images slightly tends towards sadness and compassion. A consistent explanation would be that these images induce a low activation, as shown by the SAM questionnaire (figure 10), and in accordance with Scherer’s model of emotion (Figure 2). All the activation levels are negative: the participants feel calm. The SAM is also clearly relevant for the valence level. However, the dominance measurements do not show any major distinctions. Although many studies dismiss this item from the SAM questionnaire, this result could be explained by the lack of interactions with the stimuli.
Figure 9: Participant’s answers to the GEW questionnaire during the GAPED phase (means per image)
Figure available in the original PDF paper.
Figure 10: Participant’s answers to the SAM questionnaire during the GAPED phase (means per image) Therefore, these two questionnaires seem relevant and complementary to record subjective emotional feedbacks from users. However, the picture-based stimuli used in this section are presumably of higher arousal than an usual interface design, and these inferences should be handled carefully.
Figure available in the original PDF paper.
The ‘Objective 1’ phase of our experiment consisted of presenting GAPED pictures, whose valence score is known, to users in order to assess the efficiency of several emotional measurement methods. This phase presented the GEW and the SAM questionnaires as being relevant and complementary to express users’ emotions. However, the Face
Reader results were not satisfying. The GSR did not prove to be useful in the specific context of this experiment. Therefore, questionnaires only will be selected to pursue our second objective.
Objective #2: Testing the sensitivity of the emotional assessment system towards different interface design variations To pursue the second objective, we wanted to measure the effect of the interface design alone, excluding the task’s and content’s effects (Figure 3). Content items alone were provided in a first stage, and gathered within an interface in a second stage. In the first stage, images and texts alone were therefore sequentially displayed. In the second stage, the users interacted with a four pages interface displaying the same content. During and after each item display, user’s emotions were recorded.
Thus, we assumed that the difference between the overall UX elicited emotion, and the content elicited emotion, stood for the interface design impact.
[UX emotion] x [User profile] = ([content emotion] + [interface design emotion] + [task emotion]) x [User profile]
We also considered that the task of watching and reading would similarly impact the results whether the content was provided individually or within an interface design.
However, it is not possible to successively provide a user with two different interface versions for a same content in order to compare the interface effect. The discovering impact of the first pass would necessarily bias the second pass’ perception. Therefore, two different contents were provided and balanced among two groups : UX type A and UX type B. The content used for the interactive mockups was related to two movies: “Le Mépris” for the content type A, and “Mulholland Drive”, for the content type B. Texts and images were retrieved over the Internet from royalty free sources. Movies were chosen as a support of emotional content to present consistent text and images on a multiple pages sequence. The content provided differs between the two movies. “Le Mépris” (1963) was less likely to be known by participants than “Mulholland Drive” (2001). The content structure also differs. The text chosen for “Le Mépris” present a more abstract thematic approach of the movie whereas the “Mulholland Drive” article is closer to a story. “Mulholland Drive” was also chosen because of the specific atmosphere of the content, and for the picture colors which could be associated to a vivid colors interface design. The type B interface differs from the type A by gathering the following features: a global layout composed in accordance with the golden section, a color background matching the colors of the picture, a picture with no margin, a centered title, with a larger font-size, an animated page transition, and a fading-color effect on the navigation bar buttons (figure 11).
Figure 11: Screen captures of the pages (type A on the left, type B on the right) Our objective is to determine whether the method we used is efficient enough to distinguish differences in the emotions possibly conveyed by two different interface designs. Following our earlier statement, the interface effect can be estimated as the difference between the overall experience effect, and the effect elicited by the content only. Affective and Pleasurable Design (2021)
The following diagrams present the effect produced by the content alone (blue and green), and the overall effect (red), for two different interfaces (type A and type B) (figure 12).
UX
haine
5
amusement
mepris Images only
fierte
degout Texts only
joie
peur
Figure 12: Participants’ answers to the GEW & SAM questionnaires In the following diagrams, we subtracted the content effect from the overall emotional effect, in order to distinguish the emotional effect of the user interface alone (figure 13). It is therefore possible to compare the emotional effect of the two types of design:
Figure available in the original PDF paper.
Figure 13: Comparison of emotions produced by two different interfaces These results show that the type B interface is perceived as being more fun, and slightly more pleasurable than the type A interface. The two questionnaires lead to a similar interpretation on this point. Both interfaces elicit a similar level of contentment. The activation and dominance levels are higher with the type B interface.
Figure available in the original PDF paper.
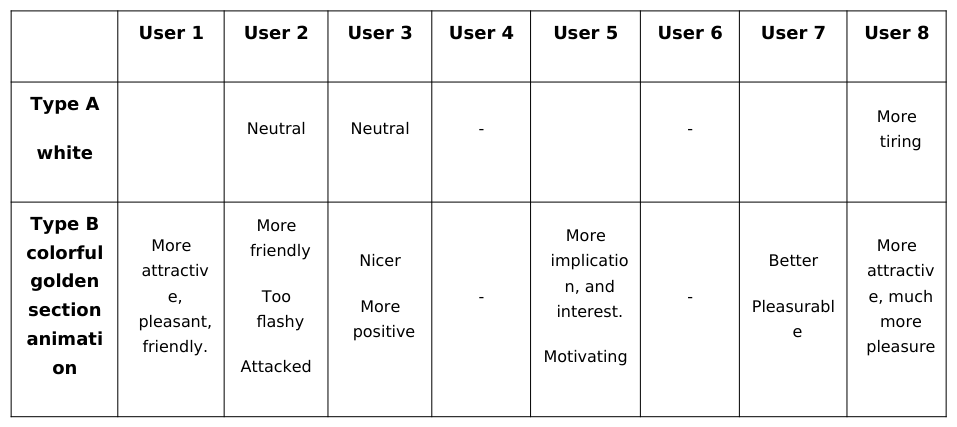
These results are confirmed by the terms chosen by the users to describe their experience with the two interfaces during the short interview at the end of the experiment (table 2).
Table 2: Emotional terms used by the participants to describe the two interfaces
These results are consistent with previous studies. Interface color lead to a better attractiveness, and may influence cognitive performance (Bonnardel, Piolat & Le Bigot, 2011; Cyr, Head, & Larios, 2010). The higher activation and dominance levels of the type B interface could also be explained by its animation features.
Therefore, the GEW and SAM questionnaires seem to provide an accurate way of assessing the emotional impact of both the content and the overall experience. Moreover, the tested process of indirect measurement of the interface design effect lead to consistent results.
Measuring interface users’ emotions: Conclusion In this section, we tested several assessment methods considering the specificities of an interface design: a continuous and changing stimulus, eliciting low-intensity emotions. Moreover, we detailed a user interface emotion model, specifying the role of the design among other components. We proposed a method to measure the emotional effect of this specific component.
Our first results showed that some usual emotion assessment methods were not adapted to the specific context of an interface user experience. Face behavioral does not seem to be a reliable source. The analysis of the electrodermal activity did not provide any insights for our experimental mockups. However these results should be relativized as secondary results orientate its adequacy towards more developed interactions, and higher level tasks. On the other hand, SAM and GEW questionnaires, even if asynchronous and subjective, allowed us to distinguish the emotional effects of the two different interfaces.
These first results invite us to use an appropriate experimental setup, based on questionnaires and EDA, to evaluate specific strategies of interface design.
CONCLUSION
Emotional design has become a crucial issue for interface designers. However, most of designers’ practices are empirical. Methods are required to better assess the emotional effect of an interface design. In a first section, this paper reported a collective interview of interface designers. A fundamental design baseline, the perception by the user of the author/designer’s empathy, was identified as a global framework for interface emotional design. In the second section, we tested several assessment methods considering the specificities of an interface design: a continuous and changing stimulus, eliciting low-intensity emotions. Moreover, we detailed a user interface emotion model, specifying the role of the design among other components. We proposed a method to measure the emotional effect of this specific component. Our first results showed that some usual emotion assessment methods were not adapted to the specific context of an interface user experience. On the other hand, SAM and GEW questionnaires, even if asynchronous and subjective, allowed us to distinguish the emotional effects of the two different interfaces. These findings will supplement further works in order to specify an emotional assessment protocol fitting the interface design particularities. This method will then contribute to measure and compare the emotional effect of various interface design strategies.
ACKNOWLEDGEMENTS
This work is supported by the French national research agency (ANR) under the SKIPPI research project (ANR- 2010-COSI-016-01). We thank very much Carole Bouchard and Vincent Rieuf (LCPI) for their supportive role in this work. We also thank the product designers of Option France for their kind participation.
REFERENCES
Allen, C. T., Machleit, K. A., & Marine, S.S. (1988). On Assessing the Emotionality of Advertising via Isard’s Differential Emotions Scale. Advances in Consumer Research, 15. 226-231. Arnold, M. (1945). Physiological differentiation of emotional states. Psychological Review, 35-48. Barrett, L. F., & Wager, T. (2006). The structure of emotion: Evidence from the neuroimaging of emotion. Current Directions in
Psychological Science, 15, 79-85. Bastien, J.M.C., Scapin, D. (1993). Ergonomic Criteria for the Evaluation of Human-Computer Interfaces. INRIA, France Baumeister, R. F., Bratslavsky, E., Muraven, M., & Tice, D. M. (1998). Ego depletion: Is the active self a limited resource?
Journal of Personality and Social Psychology, 74, 1252-1265. Bonnardel, N. (2012). Designing future products: What difficulties do designers encounter and how can their creative process be supported? Work, 41, 5296-5303. Bonnardel, N. (2011). Cognition and emotion in creative design. In S. Masmoudi, D. Yun Dai & A. Naceur (Eds.). Attention,
Representation, and Human Performance: Integration of Cognition, Emotion, and Motivation (pp. 187-200), New York: Psychology Press (Taylor & Francis Group). Bonnardel, N., & Moscardini, L. (2012). Toward a situated cognition approach to design: Effect of emotional context on designers’ ideas. Proceedings of the 30th annual Conference of the European Association of Cognitive - ECCE 2012 (pp. 15-21). Edinburgh, U.K. Bonnardel, N., Piolat, A., & Le Bigot, L. (2011). The impact of colour websites on appealing and users' cognitive processes.
Displays, 32, 69-80. Bradley, M. M., & Lang, P. J. (1994). Measuring Emotion: The Self-Assessment Manikin and the Semantic Differential. Journal of Behavioral Therapy and Experimental Psychiatry, 25, 49-59. Braithwaite, J., Watson, D. G., Jones, R., Rowe, M. (2013) A guide for analyzing electrodermal activity (EDA) & sckin
conductance responses (SCRs) for psychological experiments. Technical Report: selective attention & awareness laboratory (SAAL) Behavioural brain sciences centre, University of Brimingham, UK. Cyr, D., Head, M., Larios, H. (2010). Colour appeal in website design within and across cultures: A multi-method evaluation, International Journal of Human-Computer Studies. 68, 1-21. Dan-Glauser, E. S., & Scherer, K. R. (2010). The Geneva Affective PicturE Database (GAPED): A new 730 picture database
focusing on valence and normative significance. Davis, M. A. (2009). Understanding the relationship between mood and creativity: A meta-analysis. Organizational Behavior and Human Decision Processes, 108(1), 25-38. Desmet, P. M. A. (2003). A Multilayered Model of Product Emotions. The Design Journal, 6. 4-13. D’Mello, S. K. & Graesser, A. C. (2012). Dynamics of affective states during complex learning. Learning and Instruction, 22,
145-157. Easterbrook, J. A. (1959). The effects of emotion on cue utilization and the organization of behavior. Psychological Review, 66. Affective and Pleasurable Design (2021)
183–201. Ekman, P. (1970). Universal facial expressions of emotion. California Mental Health Research Digest, 8, 151-158. Eysenck, M. W. (1982). Attention and Arousal. New York: Springer-Verlag. Frijda, N. H. (1986). The emotions. London: Cambridge University Press. Gil, S. (2009). Comment mesurer les émotions en laboratoire ? Revue électronique de Psychologie Sociale, 4. 15-24. Halberstadt, J. B., Niedenthal, P. M., & Kushner, J. (1995). Resolution of lexical ambiguity by emotional state. Psychological Science, 6, 278-282. Hancock, P. A., Pepe, A. A., & Murphy, L. L. (2005). Hedonomics: the power of pleasurable ergonomics. Ergonomics in Design.
8-14. Humphreys, M. S., & Revelle, W. (1984). Personality, motivation, and performance: A theory of the relationship b0etween individual differences and information processing. Psychological Review, 91, 153–184. Jolland, M. (2012). Comment prédire la créativité auto-perçue à partir du stress de l’état émotionnel et du bien-être ? Une
approche exploratoire. Mémoire de Recherche. Aix-Marseille Université. Kokkonen, M., & Pulkkinen, L. (2001). Examination of the paths between personality, current mood, its evaluation, and emotion regulation. European Journal of Personality, 15, 83-104. Lafleur, J., Béliveau, R., (1994). Les quatre clés de l’équilibre personnel. Montréal : Editions Logiques Mandler, G. (1982). The structure of Value; Accounting for Taste, in T. Tighe & al (Eds.). Affect and Cognition: The 17th
Annual Carnegie Symposium (pp. 3-36), Hillsdale, NJ (Lawrence Erlbaum Associate) Massé, R., Poulin, C., Dassa, C., Lambert, J., Bélair, S. et Battaglini, A. (1998). The Structure of mental health: higher-order confirmatory factor analyses of psychological distress and well-being measures. Social Indicators Research, 45: 475-504. Mayer, J. D., & Gaschke, Y. N. (1988). The experience and meta-experience of mood. Journal of Personality and Social
Psychology, 55, 102-111 Mehrabian, A. (1996). Pleasure-Arousal-Dominance: A General Framework for Describing and Measuring Individual Differences in Temperament. Current Psychology: Developmental - Learning - Personality - Social 14. 261-292. Noldus (n.d.). Retrieved February 10, 2014, from http://www.noldus.com. Norman, D.A. (2002) Emotion and design: Attractive things work better, Interactions Magazine. IX, 36-42. Norman, D.A. (2002). The design of everyday things. New York, NY: Basic Books. Norman, D.A. (2005) Emotional design: Why We Love (or Hate) Everyday Things. New York, NY: Basic Books. Park, J., & Banaji, M. R. (2000). Mood and heuristics: The influence of happy and sad states on sensitivity and bias in
stereotyping. Journal of Personality and Social Psychology, 78. 1005–1023. Plutchck, R. (1980). Emotion: Theory, research, and experience: Vol. 1. Theories of emotion, 1, New York: Academic Russell, J. A. (1980). A circumplex model of affect. Journal of Personality and Social Psychology, 39. 1161-1178. Russell, J. A., & Barrett, L. F. (1999). Core Affect, Prototypical Emotional Episodes, and Other Things Called Emotion: Dissecting the Elephant. Journal of Personality and Social Psychology, 76. 805-819. Russell, J. (2003). Core Affect and the Psychological Construction of Emotion. Psychological Review, 110. 145-172. Sanabria, J. C., Cho, Y., Sambai, A., & Yamanaka, T. (2012). Image-Word Pairing-Congruity Effect on Affective Responses.
Kansei Engineering International Journal, 11. 91-100. Sanna, L. J. (1998). Defensive pessimism and optimism. Cognition and Emotion, 12. 635-665. Schachter, S. (1959). The Psychology of Affiliation. Stamford: Stamford University Press. Scherer, K. R. (2005). What are emotions? And how can they be measured? Social Science Information 44. 695-729. Scherer, K. R., & Tannenbaum, P. H. (1986). Emotional Experiences in Everyday Life. Motivation and Emotion, 10(4), 295–314. Schwarz, N., & Bless, H. (1991). Happy and mindless, but sad and smart? The impact of affective states on analytic reasoning. In J. P. Forgas (Ed.), Emotion and social judgments. 55-71. Oxford, England: Pergamon Press. Shneiderman, B. (2004). Designing for fun: How can we design user interfaces to be more fun? Interactions. September-October,
48-50. Shneiderman, B., & Pleasant, C. (2005). Designing the User Interface: Strategies for Effective Human-Computer Interaction (4th), Boston, MA: Addison Wesley. SKIPPI (n.d.). Retrieved February 10, 2014, from http://www.skippiproject.com. Strongman, K. (2003). The Psychology of Emotions. Chichester: Wiley. The Fun Theory (2009.). Retrieved February 14, 2014, from http://www.thefuntheory.com/piano-staircase. Vakratsas, D., & Ambler, T. (1999). How advertising works: What do we really know? Journal of Marketing, 63, 26-43.
LISTED IN THE AHFE DIGITAL BOOKSTORE CATALOGUE
Explore the complete digital volume
Advances in Affective and Pleasurable Design
Read this individual research paper free through the original publisher, or explore the full digital proceedings book.
ISBN 978-1-4951-2109-8
Explore this ISBN in the AHFE Bookstore ↗Listed in the July 2026 bookstore catalogue; search by ISBN to confirm current availability · Digital book purchase optional