Patrick Moratori, Christian Wagner, Robert Houghton (2021). Transforming Physiological Data from a Generic Sensor to a Specialised One for Affect Detection. In: Advances in Affective and Pleasurable Design. AHFE Open Access, vol. 14. https://doi.org/10.54941/ahfe100545
Continuous reduction on hardware costs has been bringing the opportunity to employ cheap sensors to measure physiological data. However, this comes at a price of capturing some noisy information, which most likely would compromise both analysis and interpretation of the raw results. This paper investigates the reliability of a generic and a specialised sensor on capturing heart rate data and the challenge of extracting meaningful information from it for affect detection. A controlled stimulus in a laboratory setting is performed, in which participants play different levels of the game Tetris while their signal variations are observed. Since only the generic sensor does not reproduce the expected behaviour, filtering techniques are proposed to approximate its signal to the specialised one. Experimental results confirm that this goal is achieved by applying either “Grubbs' test”' for outliers detection or “three-sigma rule”. Such transformations highlight the need of filtering techniques for affective computing because they avoid misinterpretation of the results, as well as it represents a starting point towards finding a ground-truth to link possible user affect and physiological data.
Modelling user affect is a challenging and instigating task due to the complexity of understanding features from individuals. However, characteristics such as facial expressions and self-report statements could lead to misleading interpretations of current emotional states, i.e. a “fake”' smile representing happiness or a person completing a questionnaire when in a hurry. The use of physiological data represents an alternative to overcome this issue, since their signals are mostly involuntary. Their association with previously mentioned features would provide a more reliable interpretation of user affect.
Research efforts have been made to check possible links between emotional states and physiological data (Ben- Shakhar et al., 2007; Bailenson et al., 2008; Stemmler and Wacker, 2010; Park and Kim, 2011; Elices et al., 2012; Veld et al., 2012; Critchley et al., 2013). However, the reliable capture of information on users' affective state based solely on physiological data is still a remote goal. An important issue to highlight is the quality of captured signals by sensors, which might be producing noisy information due to their reduced hardware costs.
This paper focuses on the process of capturing heart rate signals (HR) as physiological data and the challenge of extracting meaningful information from it. The aim is to collect signals from different sensors, i.e. a generic and a specialised one, checking their reliability when users are exposed to controlled stimuli in a laboratory setting. Signals are compared and a filtering transformation from a generic to a specialised one is proposed. This study mainly emphasise the need of filtering techniques for affective computing, which represents an essential starting point to do further investigation on the identification of possible patterns on making links between physiological information and emotional states, since collected data should be accurate and purposeful. Upcoming studies have the ultimate goal of establishing a ground-truth dataset for subsequent learning and automatic recognition of user affect.
Background, Aims and Contribution Affective Computing (AC) is “computing that relates to, arises from, or deliberately influences emotions” (Picard, 1995), as initially coined by Professor R. Picard (Media Lab, MIT). It has been gaining popularity rapidly in the last decade because of its significant potential in the next generation of human-computer interfaces. One goal of affective computing is to design computer systems that can recognize and respond in a rational and strategic fashion to real-time changes in user affect (e.g., happiness, sadness), cognition (e.g., frustration, boredom) and motivation, as represented by for example speech, facial expressions, physiological signals, and neurocognitive performance. Achieving the aspirations of the very young field of AC is a strongly multidisciplinary challenge with key contributions from Psychology, Human Factors, Computer Science and other disciplines. Recent years have seen a large expansion in the body of research in and around AC (Chanel et al., 2009; Al-Mulla et al., 2011), in particular from a Computer Science perspective (Calvo and DMello, 2010), highlighting the need for engagement across disciplines to align emotion theories proposed in the Psychology literature with current modelling techniques in Computer Science.
The study discussed in this paper has been launched as a multidisciplinary research project to establish foundations for the investigation of AC, in particular from a computational intelligence point of view. It is driven both by insights from Psychology as well as the potential of modern data aggregation and interpretation techniques from Computer Science. The key challenges across disciplines are:
Psychology and Human Factors: What is emotion and how can we interpret physiological information in this context?
Computer Science: How do we automatically recognize “emotions” from multiple uncertain information sources?
Creating a ground-truth dataset to link emotional states with physiological data is not a straight forward task, as previously discussed in (Moratori et al., 2013). Many issues could be related with experiment design (e.g., intensity of the applied stimuli, workload) and/or data capture (e.g., faulty or inaccurate sensors). This paper mainly focuses on checking the reliability of different sensors on capturing Heart Rate data to reflect possible user affects. These signals are collected, analysed and compared among them. The main contribution of this study is to discuss the process of collecting meaningful physiological data for AC and possible filtering strategies to acquire more reliable information.
The remainder of this paper is organised as follows. The next section introduces the investigated problem, followed by the experiment description which defines the experimental methodology and presents, analyses and discusses the obtained results. The last section concludes the paper and describes future work.
PROBLEM STATEMENT A series of carefully crafted pre-experiments has been done to investigate physiological data for user affect. The following contexts have been analysed as stimuli: (C1) user behaviour when visualising a sequence of pre-rated images from the groups of emotions “happy”, “neutral” and “sad” and, (C2) levels of stress when playing a Tetris game with a continuous increasing workload.
ElectroCardioGram data ECG is captured by wireless Shimmer sensors (Burns et al., 2010) during the stimuli. Subsequently, heart beats per minute are extracted from this signal generating heart rate data (HR). Results from these initial experiments show that noisy signals are present for both contexts. Figure 1 (a)-(b), illustrates the presence of large peaks for C1 and C2, respectively. Due to the nature of the stimuli, no drastic changes on HR are expected on a small period of time because no strong physical effort is required during the performance of task, i.e. in general, increasing levels of stress lead to a gradual increase of the HR over time. These results highlight a possible accuracy issue with the applied sensor.
(a) (b)
(c) (d)
Figure 1. HR signals from Shimmer (a)-(b) and from Polar (c)-(d)
Figure available in the original PDF paper.
Polar sensor has been used by several researchers to monitor HR activity (Gamelin et al., 2006; Kent et al., 2009; Weippert et al., 2010; Quintana et al., 2012; Santos et al., 2013) and, consequently, this more specialised device has been employed to check the reliability of the acquired signals. Results from Polar resemble the expected behaviour, since no drastic changes on HR are observed overtime, as in Figure 1 (c)-(d) for both contexts. For instance, this smooth behaviour reflects slightly changes on HR when the user sees different groups of images on C1, or when moving between different levels of Tetris on C2.
Because of the practicability of conducting experiments and avoidance of repeating the same proceeded tasks, a step forward would be apply a filtering technique to transform the original signal into one that is similar to Polar, which would provide a reliable signal even from a generic wireless device as Shimmer.
EXPERIMENT DESCRIPTION The investigated context relies on playing the game Tetris due to its interactive, engaging and continuous demanding nature, which facilitates the immersion of users while performing required task, i.e. progressing through different levels of the game. ECG and HR values are collected in parallel from both Shimmer and Polar, respectively. Note that Polar originally delivers HR data and Shimmer signals have to be post-processed to count heart beats, in which ECG data is transformed into HR values. More details about this post-processing procedure can be found in (Moratori et al., 2013). A time window of 20 minutes is predefined to observe 11 participants playing the game, with a recording sampling rate of 0.5Hz. Subsequently, comparisons overtime time are done among sensors, in which a deviation value Dev is calculated to represent the sum of the absolute differences between signals from Shimmer and Polar.
Two filtering techniques are then applied to reduce possible noisy data from Shimmer aiming to reduce deviating values. The first one (F1) is based on “Grubbs' test” (Grubbs, 1969) and the second (F2) on “three-sigma rule” (Upton and Cook, 2008). F1 detects outliers based on the calculation of a “Z” value for each considered sample, which measures the distance to the mean divided by the standard deviation. Subsequently, each “Z” is compared with tabulated “Z critical” values defined by Grubbs, which checks if there is less than a 5\% chance to find an outlier so far from the others by chance alone. Conversely, F2 has a more straight-forward approach in which deviations are detected when values are larger than three times the standard deviation. Note that both F1 and F2 are tested separately and the process of detecting outliers is repeated until no improvements are observed for Dev.
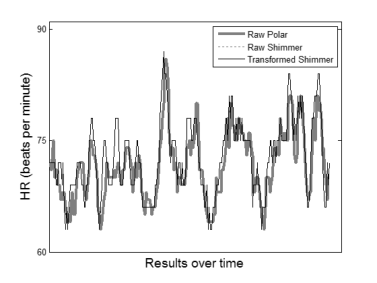
Analysis and Results Overall results obtained by both filtering techniques F1 and F2 are shown in Table 1. In general, averages and standard deviations from transformed Shimmer and raw Polar are reasonably approximated. Decreasing Dev values reflect the outlier detection. Contrariwise, these values remain unchanged when deviations are not present or cannot be identified. The total average in Table 1 indicates that both transformations are able to deliver smaller deviations. A graphical representation with data from participant 1 is presented in Figure 2 (a)-(b), in which outliers are detected using F1 and F2, respectively. Additionally, Figure 2 (c) illustrates an example when deviations are absent from the original signal captured for participant 9.
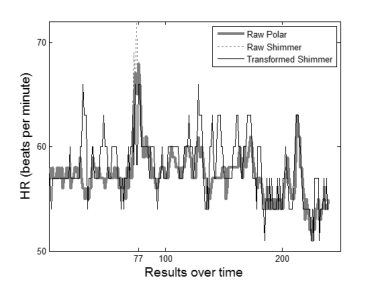
Exceptions were observed for participant 2, 4 and 8 with slightly increasing Dev because no prediction technique is applied on replacing outliers, which means that they are simply substituted by the average value of the curve. Figure 3 shows this behaviour when the outlier on the instant 77 is detected for participant 4. Note that replacing the outlier by the average leads to a transformed curve that is slightly more distant to Polar at this specific time. In such cases, a transformation of the HR signal is not required since no relevant changes are observed on the final results.
Table 1. Average, standard deviation and Dev values for Polar and Shimmer Raw values F1 F2 Polar Shimmer Shimmer Shimmer Participant Average Std Average Std Dev Average Std Dev Average Std Dev
Figure 2. Outliers detection using F1 and F2 transformations (a)-(b), respectively; and no presence of deviating values (c)
In general, slightly better performance is observed for F1 because “Grubbs' test” not only considers standard deviations and averages values, but also the t-distribution of the curve (Barnett and Lewis, 1994).
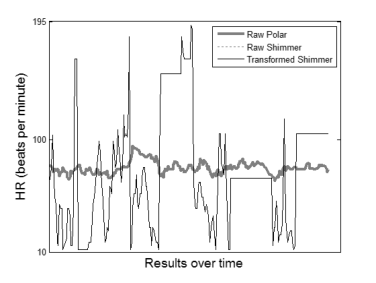
The presence of unchanged large standard deviation values after applying F1 and F2 indicates that the original signal is not a good representative of the observed feature. For instance, shimmer data from participant 6 reflects pure noise, even with an apparent similarity with Polar observing only its HR averages results, as in Figure 4. Such cases are detected and samples are automatically disregarded.
Figure 3. Slightly increasing Dev after removing outliers on the instant 77Figure 4. Example of data with pure noise captured by
Shimmer
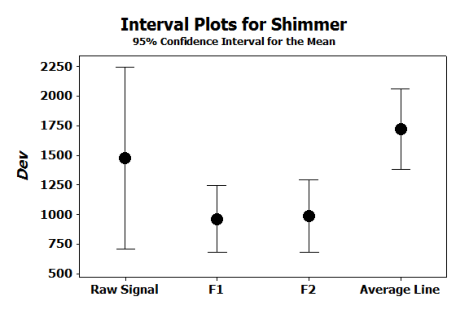
In order to check the relevance of the proposed transformations, an additional comparison with a straight average line from Shimmer is investigated. The goal is to confirm that smaller deviations can be found from both F1 and F2, while relevant signal variations are kept. Figure 5 shows a graphical representation of this comparison, using 95% confidence interval plots. The dot indicates the average value on the whole set of samples obtained by the corresponding Dev value in the x-axis. The vertical lines denote the 95% confidence interval of the mean value. Statistical differences are immediately detected when there is no overlap between the confidence intervals of two or more instances.
Figure 5. Comparisons between raw signal, F1, F2 and average line from Shimmer; the x-axis shows each of these instances; the y-axis shows the mean (dot) and 95% confidence interval (vertical bars) of Dev
According to the interval plots in Figure 5, F1 and F2 are the most competent with respect to Dev. As expected, both filtering methods are statistically superior to the average line. However, they not statistically distinct from raw Shimmer, even having the ability to deliver smaller Dev values, as previously stated using overall results from Table 1. Note that small HR variations are commonly observed for AC experiments due to nature of the required tasks, which are, in general, not physically demanding (Poli et al., 2007; Quintana et al., 2012).
Given the results in Table 1 and the additional comparison with average lines, it is confirmed that it is possible to transform a noisy signal from a generic HR sensor as Shimmer into a more specialised one as Polar, since they are reasonably approximated for the AC context.
CONCLUSIONS AND FUTURE WORK This paper checks the reliability of different sensors, i.e. a generic and a specialised one, on capturing heart rate (HR) and the challenge of extracting meaningful information from it toward recognising possible user affects. Users are exposed to a controlled stimulus in a laboratory setting while their physiological data is recorded by both sensors. The task is to play different levels of the game Tetris, in which only small variations are expected on the captured signal due to the nature of this required task. Not surprisingly, the specialised sensor reproduces the expected behaviour while the generic one delivers outliers. Consequently, filtering techniques are proposed to approximate collected signals from both devices, i.e. data from the generic sensor is post-processed to generate signals that are similar to the specialised one. Both applied techniques, namely “Grubbs' test” for outliers detection and “three-sigma rule”, succeed on this approximation. Note that such transformations are highlighted as essential because they avoid misinterpretation of the results. This contribution represents an essential starting point to do further investigation on the identification of possible patterns on user affect, since observed data should be accurate and purposeful. Future work aims to test different prediction techniques to replace outlier values and the reliability investigation of different physiological data such as galvanic skin responses (GSR) and signals from electromyography (EMG)
REFERENCES
Al-Mulla M., Sepulveda F., and Colley M. (2011), “A review of non-invasive techniques to detect and predict localised muscle fatigue”. Sensors, 11:3545–3594. Bailenson J., Pontikakis E., Mauss I., Gross J., Jabon M., Hutcherson C., Nass C., and John O. (2008), “Realtime classification of
evoked emotions using facial feature tracking and physiological responses”. International Journal of Human-Computer Studies, 66(5):303–317. Barnett V. and Lewis T. (1994), “Outliers in statistical data”. In Wiley Series in Probability and Mathematical Statistics. John Wiley & Sons, Chichester. Ben-Shakhar G., Bornstein G., Hopfensitz A., and van Winden F. (2007), “Reciprocity and emotions in bargaining using
physiological and self-report measures”. Journal of Economic Psychology, 28(3):314–323. Burns A., Doheny E., Greene B., Foran T., Leahy D., O’Donovan K., and McGrath M.(2010), “Shimmer: An extensible platform for physiological signal capture”. In Proceedings of the 32nd Annual International Conference of the IEEE Engineering in Medicine and Biology Society, Buenos Aires, Argentina. Calvo R. and DMello S. (2010), “Affect detection: An interdisciplinary review of models, methods, and their applications”. IEEE
Transactions on Affective Computing, 1(1):18–37. Critchley H., Eccles J., and Garfinkel S. (2013), “Chapter 6 - interaction between cognition, emotion, and the autonomic nervous system”. In Ruud M. Buijs and Dick F. Swaab, editors, Autonomic Nervous System, volume 117 of Handbook of Clinical Neurology, pages 59 – 77. Elsevier. Elices M., Soler J., Fernandez C., Martin-Blanco A., Portella M., Perez V., Alvarez E., and Pascual J. (2012), “Physiological and
self-assessed emotional responses to emotion-eliciting films in borderline personality disorder”. Psychiatry Research, 200(2-3):437–443. G. Chanel, J. Kierkels, M. Soleymani, and T. Pun. “Short-term emotion assessment in a recall paradigm”. International Journal of Human-Computer Studies, 67(8):607–627, 2009. Gamelin F., Berthoin S., and Bosquet L. (2006), “Validity of the polar s810 heart rate monitor to measure r-r intervals at rest”.
Medicine and Science in Sports and Exercise, 38(5):887–893. Grubbs F. (1969), “Procedures for detecting outlying observations in samples”. Technometrics, 11(1):1–21. Kent L., ONeill B., Davison G., Nevill A., Elborn J., and Bradley J. (2009), “Validity and reliability of cardiorespiratory measurements recorded by the lifeshirt during exercise tests”. Respiratory Physiology &Neurobiology, 167(2):162 – 167. Moratori P., Wagner C., Houghton R., Shipp V., Johal J., Welch P., and Ali S. (2013), “Towards a ground truth dataset for affect
detection from physiological information”, In Proceedings of the 9th International Conference on Intelligent Environments
- Applications of Affective Computing in Intelligent Environments (ACIE13), pages 128–136, Athens, Greece. Park S. and Kim K. (2011), “Physiological reactivity and facial expression to emotion-inducing films in patients with schizophrenia”. Archives of Psychiatric Nursing, 25(6):37–47. Picard R. (1995), “Affective computing”. Technical Report 321, M.I.T Media Laboratory Perceptual Computing. Poli S., Sarlo M., Bortoletto M., Buodo G., and Palomba D. (2007), “Stimulus-preceding negativity and heart rate changes in
anticipation of affective pictures”. International Journal of Psychophysiology, 65(1):32–39. Quintana D., Guastella A., Outhred T., Hickie I., and Kemp A. (2012), “Heart rate variability is associated with emotion recognition: Direct evidence for a relationship between the autonomic nervous system and social cognition”. International Journal of Psychophysiology, 86(2):168–172. Santos D., Silva A., Matias C., Magalhaes J., Fields D., Minderico C., Ekelund U., and Sardinha L. (2013), “Validity of a
combined heart rate and motion sensor for the measurement of free-living energy expenditure in very active individuals”. Journal of Science and Medicine in Sport, In Press. Stemmler G. and Wacker J. (2010), “Personality, emotion, and individual differences in physiological responses”. Biological Psychology, 84(3):541–551. Upton G. and Cook I. (2008), “A Dictionary of Statistics”. Oxford University Press, 2008. ISBN-13:9780199541454. Veld D. de, Riksen-Walraven J., and Weerth C. de (2012), “The relation between emotion regulation strategies and physiological
stress responses in middle childhood”. Psychoneuroendocrinology, 37(8):1309–1319. Weippert M., Kumar M., Kreuzfeld S., Arndt D., Rieger A., and Stoll R. (2010), “Comparison of three mobile devices for measuring rr intervals and heart rate variability: Polar s810i, suunto t6 and an ambulatory ecg system”. European Journal of Applied Physiology, 109(4):779–786.
LISTED IN THE AHFE DIGITAL BOOKSTORE CATALOGUE
Explore the complete digital volume
Advances in Affective and Pleasurable Design
Read this individual research paper free through the original publisher, or explore the full digital proceedings book.
ISBN 978-1-4951-2109-8
Explore this ISBN in the AHFE Bookstore ↗Listed in the July 2026 bookstore catalogue; search by ISBN to confirm current availability · Digital book purchase optional