Fei Gao, Peng Ji (2026). Limitations of Emotion Recognition Methods in Usability Testing: A Case Study of Facial Expression Recognition on Smart Home Terminal Interfaces. In: Human-Computer Interaction & Emerging Technologies. AHFE Open Access, vol. 233, pp. 238–248. https://doi.org/10.54941/ahfe1007523
With increasing market demands for convenient and accurate emotional feedback, emotion recognition technology has become a preferred tool for evaluating the usability of interaction design, owing to its precision, stability, and high responsiveness in deriving emotional states from users' physiological indicators. However, the mapping mechanism between emotion recognition outputs and usability assessments remains unclear and under-defined. This study investigates the application of facial expression recognition technology in usability testing for smart home terminal interfaces, aiming to clarify the mapping characteristics between objective and subjective data in such contexts and to resolve erroneous correlations between emotional representations and usability judgments.First, we identify the relationship between trend-based emotional states and usability evaluations and propose a method to isolate effective instantaneous emotions. Second, we optimize the emotional calibration range and reveal the matching pattern between transient emotions and their designated calibration domains. Finally, through the fusion of dual-dimensional data, we correct recognition errors and propose a bidimensional feedback optimization method suitable for nonlinear mapping, which is further validated through experimental testing.This method effectively overcomes the limitations of traditional emotion recognition technologies in capturing subtle emotional fluctuations and filtering out irrelevant emotional responses, offering a new approach for enhancing the reliability of emotion-based usability evaluation.
Emotion recognition technology infers users’ emotional states by monitoring physiological signals such as heart rate, galvanic skin response, and respiratory rate (Landowska and Miler, 2016). It is characterized by high accuracy, stability, and responsiveness. However, its practical application reveals notable limitations (Gohumpu, Xue, and Bao, 2023). Physiological indicators are susceptible to environmental fluctuations and individual differences, making it difficult for standardized models to yield objective usability assessments under specific user conditions (Marx, 2023; Barrett et al., 2019).
Limitations of Emotion Recognition Methods in Usability Testing 239 For instance, during sustained exposure to negative tasks, users may exhibit persistently negative emotional trends with corresponding negative physiological fluctuations. Yet, such emotional manifestations do not necessarily reflect actual system that is highly usable and efficient. Although emotion recognition systems are adept at capturing momentary emotional fluctuations, the mapping between emotional expressions and usability remains ambiguous. Short bursts of physiological arousal—such as excitement triggered by AI operation errors—may be misclassified as positive affect, leading to misleading usability conclusions (Yan et al., 2013; Saffaryazdi et al., 2022).
Current research in emotion recognition largely focuses on technical accuracy while overlooking users’ internal cognitive and emotional contexts (Rodrigues, de Souza Santos, and Gama, 2025; Drungilas, Ramašauskas, and Kurmis, 2024; Schmidt et al., 2020). These limitations raise concerns about the validity and consistency of usability testing outcomes, potentially obscuring real usability issues. Misinterpretation of affective signals may misguide design decisions and lead to deviations in optimizing user experience.
To address these issues, this study proposes the Dual-Dimensional Feedback Optimization (DFO) method, aiming to enhance the applicability of emotion recognition in usability testing. By integrating user context- awareness techniques, the DFO method constructs an adaptive evaluation framework that links emotional states with usability judgments. Within this framework, objective data from emotion recognition systems and subjective data from self-report measures are merged to form a comprehensive, panoramic understanding of users’ emotional responses.
RELATED WORK
In recent years, emotion recognition technologies based on physiological measurements have achieved remarkable progress; however, their application in usability testing remains fraught with significant challenges (Karray et al., 2008; Abdulrahman, Baykara, and Alakus, 2022; Poria et al., 2017). Current research generally progresses along three major directions. Environment- related studies attempt to quantify the emotional influence of contextual factors through physiological signals, with galvanic skin response (GSR) being used to construct weighted models for indoor environmental design (Guo and Wu, 2024). Algorithmic advancements have aimed to improve recognition accuracy, such as the implementation of Bi-directional Long Short-Term Memory (Bi-LSTM) networks on EEG signals, which has yielded a 12.7% increase in classification accuracy (Vishal, Uma, and Florence, 2024). Meanwhile, design-integrated research explores how physiological indicators can support iterative optimization in interface design—for instance, through the combination of eye-tracking data and heart rate variability (HRV) to refine layout structures (Ball and Richardson, 2024). Despite these developments, existing approaches have yet to systematically resolve the dual-layer mapping challenge between physiological signals, emotional states, and usability evaluation.
240 Gao and Ji A central bottleneck in the application of emotion recognition technologies to usability evaluation lies in the widespread reliance on a linear mapping assumption—an approach that significantly underestimates the complex, nonlinear relationship between emotional states and usability outcomes. The prevailing pipeline—data acquisition → emotion inference → usability assessment—reduces rich, multidimensional affective experiences into simplified cause–effect chains, which introduces notable errors when deployed in real-world contexts (Kan et al., 2023).This limitation is particularly evident in two scenarios. First, when a user laughs in response to a system malfunction that induces a sense of absurdity, linear models may misclassify the transient physiological arousal as a positive usability signal. Second, empirical studies have shown that under stress-inducing conditions, up to 23% of seemingly positive emotional expressions are in fact masked manifestations of anxiety (dos Santos de Lima, Scortegagna, and Bertoletti de Marchi, 2024).
Of particular note is the interpretability advantage of FER: its misclassifications (e.g., laughter triggered by system errors) can be visually verified via recorded video footage. This offers a tangible window into emotion recognition errors and makes FER a particularly valuable tool for investigating common pitfalls in affective computing (Moin et al., 2023; Yang et al., 2025; Haq et al., 2024). Based on the identified gaps in current research.
METHOD
During the formal experiment, three types of data were collected concurrently. First, performance data included task completion time (interclass correlation coefficient, ICC = 0.82), deviation from optimal operation paths, and the number of operational errors (ICC = 0.79). Second, subjective evaluation data were collected immediately after the completion of each task set using an adapted version of the System Usability Scale (SUS), expanded to 20 items rated on a 7-point Likert scale ranging from −3 to +3. The scale demonstrated strong internal consistency (Cronbach’s α = 0.887–0.910), good model fit (CFI = 0.94), and acceptable error level (RMSEA = 0.06). Third, physiological data were recorded using FaceReader 9.0, which continuously tracked changes in facial expressions. Emotional valence was computed as a continuous value ranging from −1 to +1, with dual-coding agreement reaching 0.78, ensuring acceptable reliability in expression analysis.
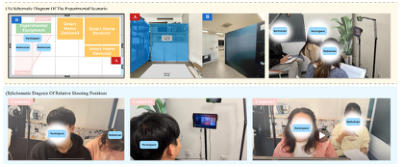
Figure 1: Schematic diagram of the experimental environment and relative location of equipment.
RESULTS
Given the fundamental differences between the subjective scores obtained from rating scales and the emotional valence data derived from facial expression recognition—both in terms of data sources and measurement principles—the original data exhibit substantial disparities in scale. These differences significantly constrain the comparability and integration of the two data types. Therefore, the first step in our analysis was to apply normalization procedures to align the data scales and enable meaningful cross-modal comparisons.
To address scale incompatibility and facilitate data comparability, both emotional valence values and subjective scale scores were normalized using the min–max normalization method. The normalization formulas and variable definitions are as follows: Emotional Valence Normalization:
min n
− = − max min
f f f f f (1)
Where: fn = normalized emotional valence f = raw emotional valence value (as extracted from FaceReader) fmax = maximum observed emotional valence value fmin = minimum observed emotional valence value
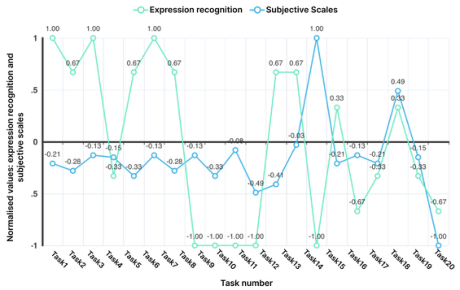
This figure illustrates the normalized emotional valence values derived from facial expression recognition (objective data) alongside self-reported emotional ratings from the subjective scale. Both data types were normalized to a common range of [–1, 1] to enable direct comparison. The visual comparison highlights convergence and divergence patterns across tasks, offering insight into the consistency and discrepancy between physiological and self-reported emotional responses.
Figure 2: Comparison of subjective and objective data.
242 Gao and Ji During the experiment, the raw data obtained from facial emotion recognition exhibited a systematic bias, with all values concentrated in the neutral-to-negative emotional range. This distribution did not align with the actual behavioral patterns observed during user interaction. Behavioral observations indicated that in typical usage contexts, users rarely displayed exaggerated emotional expressions; instead, their reactions were primarily characterized by micro-expressions. Further analysis revealed that the intensity of micro-expressions during real-world usage reached only 15–20% of the standardized expressions typically recorded in controlled laboratory settings (t(29) = 8.77, p < 0.001).
As a result, the raw emotional data exhibited two major issues:
1. Insufficient valence variability: The average emotional valence fluctuation (ΔEV = 0.22 ± 0.05) in real-use scenarios was significantly lower than that in laboratory reference datasets (ΔEV = 1.50 ± 0.12). 2. Low emotional discriminability: The ability to distinguish between emotional states was limited (Cohen’s d = 0.31), making it difficult to capture nuanced emotional transitions.
These problems suggest that the raw emotion recognition outputs failed to accurately reflect the diversity of users’ affective responses in real-world contexts, thereby limiting the practical applicability and reliability of emotion-based models in usability assessment.
Sentiment Data Correction Methods To address the aforementioned limitations, the research team developed a comprehensive emotion data calibration framework, implemented through the following procedure. Under standardized experimental conditions— ambient lighting set at 500 ± 50 lux and noise levels maintained below 40 dB—four trained experimenters (2 male, 2 female) simulated the full spectrum of emotional expressions, ranging from negative to positive. Each basic emotional state (e.g., neutral, happiness, anger, surprise) was held for 5 seconds and recorded across three repetitions per individual. All recordings underwent preprocessing steps including facial alignment, illumination compensation, and removal of motion artifacts. From the processed data, representative emotional valence (EV) values were calculated for each emotion category:
1. Neutral emotion: EV = 0.12 ± 0.03 2. Happiness: EV = 0.85 ± 0.07 3. Anger: EV = –0.65 ± 0.05 (p < 0.01) These values served as baseline calibration references for correcting the attenuated or misrepresented valence values observed in real-world user data, thereby enhancing the sensitivity and interpretability of the facial expression recognition system.
Limitations of Emotion Recognition Methods in Usability Testing 243 A linear transformation was applied to standardize the emotional valence data, with the goal of restoring the compressed dynamic range to a psychologically meaningful interval while preserving the original relative order of the data points. The calibration yielded the following improvements:
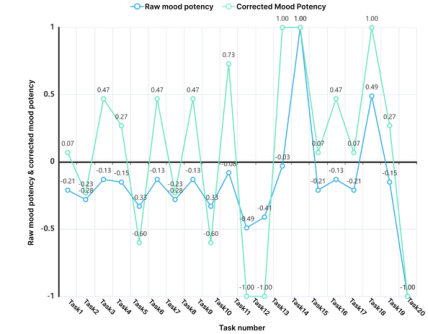
Figure 3: Data recalibration.
This figure compares original emotional valence values with recalibrated ones across 20 tasks, demonstrating the effect of correction strategy. Recalibrated values (green line) show better alignment with expected outcomes than original readings (blue line).
The corrected emotional valence data demonstrate that the calibration process effectively addressed the limitations of the original dataset, particularly the issues of low valence magnitude and insufficient variability. After correction, the data spanned the full emotional spectrum—from negative to positive—and exhibited more pronounced fluctuations, thereby offering a more accurate reflection of users’ emotional responses across different tasks. These results validate the effectiveness of the proposed calibration method in enhancing emotion recognition accuracy and provide a more reliable data foundation for future user experience evaluations.
EXPERIMENTAL RESULTS AND ANALYSIS The emotional valence data obtained from facial expression recognition showed a strong negative bias, with normalized values concentrated predominantly in the [–1.00, 0] range, accounting for 85% of the tasks (17 out of 20). Specifically, 12 tasks registered emotional valence values below –0.1, with Task 11 (Activating Living Room Central Air Conditioning) and Task 20 (Enabling Continuous Dialogue in Voice Assistant) recording the lowest values at –0.4872 and –1.00, respectively.
For tasks that revealed significant discrepancies between subjective and objective evaluations—such as Task 14—a targeted user study is recommended to investigate the underlying causes of such anomalies. Finally, the interaction strategies observed to perform well in basic configuration
244 Gao and Ji tasks should be considered for broader application across other functional modules, leveraging their demonstrated usability advantages.
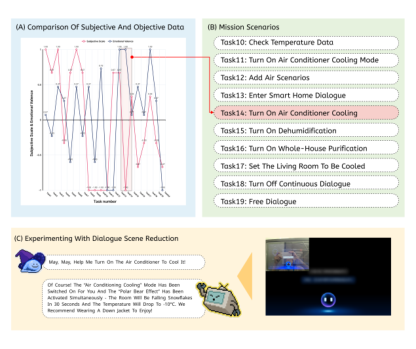
In Experiment 1, we compared subjective rating scale scores with objective data from the emotion recognition system (see Figure A). In Task 14 (“Voice command to activate cooling mode”), the emotion recognition system reported a relatively high emotional valence, suggesting a positive emotional state. However, participants’ self-reported ratings for the same task were notably lower, indicating neutral or even negative emotional responses.
To investigate this discrepancy, we reviewed the experimental scene, particularly focusing on the interaction in Task 10 involving the smart home voice assistant. For example, when a participant issued the voice command, “Xiaomei, please turn on the cooling mode” (see Figure C), the system responded with an unexpected and humorous reply: “Certainly! ‘Cooling mode’ has been activated. Additionally, the ‘Polar Bear Effect’ is now on—snow will begin to fall in 30 seconds, and the room temperature will drop to –10°C. We recommend putting on your down jacket and enjoying the moment!”
This unexpected and playful response elicited spontaneous laughter from the participant. While the emotion recognition system correctly identified the facial expression associated with amusement or joy, the subjective evaluation reflected a misalignment between the user’s expectations and the system’s performance—highlighting the need to distinguish task-related usability satisfaction from momentary affective responses induced by unrelated factors such as humor.
Figure 4: Comparison of subjective and objective emotional potency of users during the completion of the 20 tasks, as well as specific scene descriptions for each task. The figure contains two parts: (A) a chart comparing subjective and objective data, and (B) a list of task scenarios, and (C) scenario reduction dialogues.
In this scenario, a significant divergence was observed between the objective data generated by the emotion recognition system and the subjective self- report ratings: Objective Data: As shown in Figure A, the emotion recognition system— based on facial expression analysis—detected a marked increase in emotional
Limitations of Emotion Recognition Methods in Usability Testing 245 valence during Task 14, reaching a high positive value. This was primarily due to the system identifying the participant’s smile, which was interpreted as an indicator of positive emotional arousal.
Subjective Data: In contrast, the participant’s self-reported rating indicated a much lower emotional valence, close to the negative end of the scale. In post- task feedback, the participant explained that while the system’s humorous response was amusing, it failed to address the actual command. As a result, they felt dissatisfied with the voice assistant’s performance, leading to a lower usability rating despite the momentary laughter.
One of the key factors contributing to the misjudgment was the incorrect interpretation of facial expressions. Facial expression recognition technology primarily relies on detecting facial muscle movements to infer emotional states. However, in Task 14, the participant’s smile was triggered by the unexpected and humorous nature of the smart home system’s response to a voice command error. The emotion recognition system identified the smile and, based on its algorithmic rules, classified it as a sign of positive affect.
In reality, the participant’s laughter was not an expression of satisfaction with the system’s performance, but rather a spontaneous reaction to the absurdity or humor embedded in the system’s failure to fulfill the intended request. Such emotional responses, while outwardly appearing as positive (e.g., smiling), may in fact contain elements of sarcasm, resignation, or mild frustration.
Secondly, the lack of contextual awareness in the emotion recognition model further exacerbates its susceptibility to misclassification in complex task scenarios. Most facial expression recognition systems operate on the assumption of a direct mapping between facial movements and emotional states, without incorporating a deeper understanding of the user’s actual situation or the interactive context.
To improve the accuracy of emotion recognition systems, it is essential to integrate subjective self-report data with objective recognition outputs, thereby enhancing the model’s contextual sensitivity and affective interpretation capabilities. Such integration can better support the disambiguation of expressions and improve the system’s performance in detecting emotional responses under complex and dynamic task conditions.
This study proposes a dual-modal contradiction detection model, termed the Conflict Index (CI), which integrates user self-reported ratings and facial expression valence to identify emotional inconsistencies in AI service interactions—such as instances of “laughing out of frustration” triggered by system errors. By standardizing data from 7-point Likert scales and the Facial Action Coding System (FACS), we developed a quantifiable contradiction index () and established a three-level intervention mechanism (Leong et al., 2024). Experimental results demonstrate that the CI-based model significantly outperforms traditional unimodal approaches in reducing user complaint rates (). The model operates on three categories of standardized input data, each supported by physiological or psychological foundations:
Table 1: Standardised data bases.
Table available in the original PDF paper.
Variable Symbol Range Physiological / Psychological Basis User Rating R [–3, 3] Variant of the 7-point Likert scale (–3 = very poor, 3 = excellent)
Facial Valence V [–1, 1] Standardized using the Facial Action Coding
System (FACS)
User Confirmation C {0, 1} 0 = Not confirmed, 1 = User explicitly selected “AI error” Variables for Conflict Index (CI) Model(1) Facial Valence (V)
Calculated based on the activation intensity of AU6 (zygomaticus major) and AU4 (corrugator supercilii) in the Facial Action Coding System (FACS):
− = ∈− 6 4 [ 1,1] AU AU Max
I I V I (2)
(2) User Confirmation (C) Obtained via a real-time pop-up question:
Equations and mathematical formulas are available in the original paper PDF.
The CI is synthesized by combining the absolute deviation of the subjective rating (i.e., emotional intensity), facial valence, and a confirmation factor reflecting user-validated contradiction:
CI∈[0,1] (4) CI-Based Decision Thresholds and Intervention Strategy
CI Interval Judgment Result Action Recommendation [0.0, 0.3] No contradiction No action required
(0.3, 0.7] Potential contradiction Automatically log and monitor for follow-up (0.7, 1.0] Confirmed contradiction Trigger manual verification and user experience audit
Based on the computed CI value, a tiered strategy is used to classify emotional conflict risk and determine the appropriate automated or manual intervention:
Limitations of Emotion Recognition Methods in Usability Testing 247 Note: Experimental results show that this tiered intervention framework significantly reduced the misclassification rate compared to unimodal baselines (p < 0.01), particularly in scenarios involving humor or unexpected responses.
CONCLUSION
This study examined the limitations and potential of emotion recognition technologies in usability testing, with a particular focus on facial expression- based evaluation within smart home terminal interfaces. By analyzing the roles of both trend-based and momentary emotional responses, we uncovered the complex mapping relationship between subjective and objective affective data and its implications for usability assessment.
The proposed Dual-Dimensional Feedback Optimization (DFO) method and the subjective-scale-assisted mapping correction strategy offer new insights into the deployment of emotion recognition systems in complex interactive contexts. These approaches contribute to improving the interpretability, reliability, and contextual sensitivity of emotion-based usability evaluations.
ACKNOWLEDGMENT
I would like to express my sincere gratitude to my supervisor for their invaluable guidance, rigorous academic insight, and continuous encouragement throughout this research. I also thank all members of the research group for their constructive discussions and technical support.
REFERENCES
Abdulrahman, A., Baykara, M. and Alakus, T.B. (2022) ‘A novel approach for emotion recognition based on EEG signal using deep learning’, Applied Sciences, 12(19), 10028. Ahmad, Z. and Khan, N. (2022) ‘A survey on physiological signal-based emotion
recognition’, Bioengineering, 9(11), 688. Ball, L.J. and Richardson, B.H. (2024) ‘Eye-Tracking and Physiological Measurements for UX Evaluation’, Human-Computer Interaction Journal, 42(7), pp. 823–835. Barrett, L.F., Adolphs, R., Marsella, S., Martinez, A.M. and Pollak, S.D. (2019)
‘Emotional expressions reconsidered: Challenges to inferring emotion from human facial movements’, Psychological Science in the Public Interest, 20(1), pp. 1–68. Chen, Z.T., Weng, Z.X., Lin, J.D. and Meng, Z.X. (2023) ‘Personalized Emotion Recognition by Personality-aware High-order Learning of Physiological Signals’. Dewi, C., Gunawan, L.S., Hastoko, S.G. and Christanto, H.J. (2024) ‘Real-time facial
expression recognition: advances, challenges, and future directions’, Vietnam Journal of Computer Science, 11(2), pp. 167–193. dos Santos de Lima, E., Scortegagna, S.A. and Bertoletti de Marchi, A.C. (2024) ‘Psico Bot: a robot for psychological assessment of children and adolescents’, Ciencias Psicológicas, 18(2). Drungilas, D., Ramašauskas, I. and Kurmis, M. (2024) ‘Emotion Recognition in
Usability Testing: A Framework for Improving Web Application UI Design’, Applied Sciences, 14(11), 4773.
heart rate and facial expression for interactive gaming environments’, IEEE Access, 8, pp. 11896–11906. Egger, M., Ley, M. and Hanke, S. (2019) ‘Emotion recognition from physiological signal analysis: A review’, Electronic Notes in Theoretical Computer Science, 343, pp. 35–55. Ekman, P. (2009) ‘Lie catching and microexpressions’, in The Philosophy of
Deception, 1(2), p. 5. Gohumpu, J., Xue, M. and Bao, Y. (2023) ‘Emotion recognition with multi-modal peripheral physiological signals’, Frontiers in Computer Science. Available at: https://doi.org/10.3389/fcomp.2023.1264713 Guo, Y., Zhang, T. and Huang, W. (2023) ‘Emotion recognition based on multi-
Read this individual research paper free through the original publisher, or explore the full digital proceedings book.
ISBN 979-8-950676-09-3
Explore this ISBN in the AHFE Bookstore ↗Listed in the July 2026 bookstore catalogue; search by ISBN to confirm current availability · Digital book purchase optional