Markus Köhler, Björn Falk, Robert Schmitt (2021). Integrating User Attention for Design Evaluations in Customer-Oriented Product Development. In: Advances in Affective and Pleasurable Design. AHFE Open Access, vol. 14. https://doi.org/10.54941/ahfe100591
The importance of user-oriented design enhancing Perceived Quality increases. The impact of customers’ emotions on purchasing decisions increases the interest in applying multi-sensorial measurement methods during the product development process (PDP) in order to objectify emotions. It is important that emotional information about products can be gathered and applied by the combined usage of visual impressions with different modalities for capturing and objectifying user attention and emotions. Furthermore, rules are necessary to define a sufficient level of data as well as to communicate it into product development. This paper describes a methodology based on principles of Kansei Engineering and presents selected results of the research project CONEMO. An overview is given on how to measure and to use emotion and objectified data about quality perception for decision-making during a customer-oriented product development. CONEMO aims at a standardized procedure with an easy-to-follow methodology that is based on a Quality Gate systematics which involves customers’ attention and emotional evaluation of design alternatives during early phases of PDP and contains descriptions, requirements, measurement parameters, product structure and function. Specifications were developed to transfer Eye-Tracking data into design requirements to combine both latent, objectified and explicit, conscious data during the PDP. The presented methodology intends to support product designers by evaluating product concepts and innovations.
MOTIVATION In a time of globalized markets and the increasing technical competence of low wage countries the importance of user-oriented design that enhances customers’ perception and the active design of Perceived Quality increase dramatically. A good understanding of user perception makes the difference between success and failure. During the design of new products it is a company’s aim to make right decisions in choosing product design alternatives at early phases and to be aware of customers’ demands, especially of those which strike customers the most. The Product Development Process (PDP) is one of the core processes of manufacturing companies and significant to the companies’ success (Ehrlenspiel, 2009). By transferring requirements into products with high Perceived Quality and selling them especially well, manufacturing companies will be able to differentiate from their competitors. However, companies have to focus on the evaluation of visual impressions before in order to succeed. The fact that nearly 80 percent of all information is gathered by the eye shows the importance of visual impression and how it influences the evaluation of products (Berghaus, 2005). Thus, a methodology for product development is needed that concentrates on the objectified evaluation of visual impressions by applying measurement systems, e.g. Eye-
Tracking. As a result, the difficulty of gaining a comprehensive customer demand profile including both explicitly mentioned as well as implicit, latent needs, which customers often are not able to describe accurately, can be reduced. Right decisions about product design alternatives can only be based on comprehensive, valid customer data. Therefore, a methodology is needed to elicit data and information about customer attention and emotion, to integrate these data and information into the PDP and to ensure the enriched PDP for a continuous customer- oriented development process.
IMPORTANCE OF CUSTOMER-ORIENTED DESIGN EVALUATIONS FOR PRODUCT DEVELOPMENT The PDP (2.1) is the core process to transfer customer requirements and needs into product specifications and product characteristics. This process hast to be ensured by applying an appropriate Quality Gate approach in order to generate a continuous and robust process (2.2). Since the importance of Perceived Quality is increasing, the measuring of customers’ attention and comparing different design concepts by objectified data are important to develop products that evoke positive emotions (2.3). Thereby, knowledge about customers’ different levels of perception (latent and explicit perception of products) and a common product understanding between companies and customer target groups are essential for emotional product design. One of these methodologies integrating the evaluation of emotions and having the potential to integrate data of visual impressions for product design is Kansei Engineering (2.4).
Product Development Process and Failure Costs The PDP defines the product on basis of an abstract product idea which adapts desirable product characteristics to customer demands (Figure 1). The subsequent step is the product development conducted on the basis of a concept of the product and its stepwise design and realization (Beaujean et al., 2011). Moreover, component development and process planning are necessary in order to realize prototypes as well as the pre-series production (Ehrlenspiel, 2009). As the PDP proceeds, the determination of product characteristics restricts the companies’ possibilities for design alterations and technical adjustments and subsequently it is crucial to focus early phases since the expenses for the correction of failures are relatively low (Lindemann, 2005; Schmitt and Pfeifer, 2010).
Product
Product
Idea
Design Product Concept
Component Development
Prototype Realization
Pre-series Production series permission project permission functional specification requirement specification
technical permission
tool permission
Figure 1: Phases of the PDP (based on Ehrlenspiel, 2009)
Figure available in the original PDF paper.
Studying established products runs the risk that customer requirements have already been misinterpreted or neglected in previous design decisions and any future change of the product can lead to high costs for redesign. The economic dimensions during PDP indicate that 75% of all production costs are induced at the phases of product concept and product design (Schmitt and Pfeifer, 2010). Thus, the evaluation of different design alternatives is important in all phases of the PDP, but crucial in early phases.
Quality Gates Systematics Quality Gates or Gating (Prefi, 2003) is often used in industry as a monitoring and controlling systematics during development processes. A typical process is the stage-gate-process (Cooper, 1994) which is often used in order to stipulate clear and effective rules for a successful PDP (Schmitt and Pfeifer, 2007). Stages are phases in which activities are bundled and performance and results are achieved. Gates are decisions and checkpoints which subdivide the PDP. Critical success factors for defining Quality Gates are the implementation on critical positions of the PDP, the definition of internal customer-supplier-relationships, the selection of an appropriate evaluation model and the continuous application. Main attributes of the Quality Gate systematics are input, performance of activities, criteria catalogue (checklist) and output. There is the same procedure that applies for each stage. First the development team determines the criteria catalogue which includes the measured parameters. Later these parameters are compared to the measured output value during the monitoring at the Quality Gate. To meet the demands of
https://openaccess.cms-conferences.org/#/publications/book/978-1-4951-2109-8 criteria with different urgency and rating, it is helpful to differentiate criteria in “must-meet” and “should-meet”. At each gate, the product is assessed by a relevant authority. The objective of having checkpoints after each development phase is to reduce the probability of failure.
Perceived Quality and Eye-Tracking The PDP should strongly focus on Perceived Quality in order to anticipate customers’ evaluation of product alternatives. Perceived Quality became an important issue in companies’ strategies to differentiate from competitors (Falk, Quattelbaum and Schmitt, 2008) and is defined as the emotional and cognitive comparison between product characteristics and requirements and needs of the target group (Figure 2). The comparison is based on conscious as well as unconscious perception and linked to customer experiences and expectations (Schmitt, Quattelbaum and Lieb, 2008).
Perception Characteristics „latent“ „want“
Corporate Orientation
Market Needs
Overlap between Requirements and Characteristics Corporate
„articulated“ „can“
Skills Market Requirements
Figure 2: Understanding of Perceived Quality (Köhler, Falk and Schmitt, 2013 based on Schmitt,
Quattelbaum and Lieb, 2008)
Due to the fact that the customer’s product perception is complex and can be structured in different levels of perception which differs in their level of detail (overall impressions down to technical parameters) an application which captures latent needs and articulated requirements is necessary in order to compare different product concepts and alternatives on different levels of perception. (Falk, Quattelbaum and Schmitt, 2008).
Figure 3: Structured approach towards Perceived Quality (Schmitt and Pfeifer, 2010) An appropriate application offers the structured approach towards Perceived Quality by Schmitt and Pfeifer (Figure 3). This approach focuses on subdividing a product beginning from the overall product impression perceived by a customer down to technical parameters. Elements that are perceived as one entity are called perceptive clusters, which again can be divided into quality attributes. The quality attributes are described by descriptors and their correlation with technical parameters leads to physical quantities (Schmitt and Pfeifer, 2010). Customers looking at a certain product do not look at every single part of the product rather than grouping certain areas to clusters of perception. These clusters are firstly perceived as one system element and are situated in a high structure level (e.g. a door or the hood of a car).
Figure available in the original PDF paper.
The measurement of user attention and design evaluation can be divided into verbal methods (e.g. face-to-face survey, phone interview, online survey) and non-verbal methods (e.g. Eye-Tracking, ECG). Concerning the measurement of visual attention and evaluations, the oldest and simplest approach of detecting the eye movements of a target person is direct observation of a trained observer (Hofer and Mayerhofer, 2010). Nowadays, Eye- Tracking systems are mainly used to deduce the attention evoked by product components and to visually evaluate different designs. Thereby, fixations, saccades and scan paths are the most important key figures to record valuable and objective input data for product development. Fixations are time intervals in which the eyes rest in one special position, taking in or encoding information. Saccades are rapid eye movements between fixations and scan path means a sequence of saccade-fixation-saccade. Some additional metrics as gaze (look), pupil changes and blink rates are also studied. (Mello-Thomes, Nodine and Kundel, 2004; Hoeks and Levelt, 1993; Stern, Boyer and Schroeder, 1994) The visual impression can be influenced, as the gaze track is affected by current thoughts. Therefore, while thinking of a product attribute, the attention and the view are focused on the components that are considered as connected to it (Yarbus, 1967). Thus, it is possible to capture useful information on the implicit, latent customer requirements by applying visual measurement via Eye-Tracking.
Kansei Engineering Kansei Engineering is a product development methodology which aims at the development or improvement of products by translating customers’ psychological feelings and needs into specific product's design parameters. The term Kansei derives from the Japanese language and combines the two different signs Kan (feel, emotion, impression) and Sei (heart, mind, believe, dynamic) (Lee et al., 2002; Schütte, 2005; Schütte, 2002). The traditional methods of Kansei Engineering try to translate impressions, feelings and demands regarding established products or concepts into new design solutions and precise technical parameters (Nagamachi, 1989) in order to actively design a product with a high Perceived Quality (see Figure 2). The main method of Kansei Engineering in order to grasp customer’s feeling about the product is the semantic differential (Osgood, 1957; Nagamachi, 1995). Further typical methods like the Kano Model (Kano, 1984), systems and functions analysis and measuring physiological signals (e.g. GSR, EMG) should be used later during the application of Kansei Engineering.
Semantic differential is a type of a rating scale designed to measure the connotative meaning of products and product components from customers’ point of view. The semantic differential scales are based on semantic opposites such as "good-bad", "soft-hard", "fast-slow” which helps to define most important semantic concepts regarding a specific product (Osgood, 1957). It is mostly used for standardized questionnaires (articulated and explicit information, self-reporting methods) (Figure 4, right). Due to the fact that people always describe products by using words which reflect their feelings and opinions, these words can be grouped in semantic concepts.
Customer satisfaction Excitement
Level of implementation 2 The mattress is … HEALTHY NOT HEALTHY 3 The mattress is … FRESH NOT FRESH Basic needs 4 The mattress is … BREATHABLE NOT BREATHABLE
Figure 4: Kano Model (based on Kano, 1984) and Semantic differential (based on Osgood, 1957) The Kano Model (Figure 4, left) can be applied to classify product characteristics which technically meet the basic requirements and additionally foster emotionally inspiring product characteristics (Schmitt and Pfeiffer 2010; Kano et al., 1984). This anticipation of emotional customer requirements (excitement) helps to differentiate a company from its competitors and represents a critical success factor, especially in those markets with little difference in technology (Kano et al., 1984). It turns out that the quality of a product in classical understanding as a technical excellence might no longer be sufficient to delight customers.
Figure available in the original PDF paper.
KANSEI ENGINEERING BASED METHODOLOGY FOR INTEGRATING CUSTOMERS' VISUAL PERCEPTION INTO PDP Based on the state-of-the-art contents, different questions regarding the implementation of multi-sensorial measurement methods into the Kansei Engineering methodology have been raised (3.1). These research questions have been analyzed during the research project CONEMO and lead to an extended methodology (3.2). This methodology was presented and validated together with different SMEs. Results of this step are exemplarily mentioned in chapter 3.3.
Research Questions and General Methodology The following extended Kansei Engineering methodology to be applied during a PDP shows solutions on how to use methods for emotional product design. The challenge will be to make use of appropriate methods accomplishing these steps successfully and to integrate these methods into an existing product development environment. That way it is important to summarize the used concepts of emotional design and to implement these concepts in an easy-to- use approach which is systematically used during PDP.
Based on chapter 2, the subsequent research questions are of importance for ascertaining a high Perceived Quality, for enhancing Affective Engineering and consequently for entrepreneurial success:
Which are the most relevant components according to the visual cognitive impression?
How can Eye-Tracking be applied to objectively detect relevant components?
How can product ideas be implemented into semantic concepts based on a common product understanding between customers‘ and companies‘ perspectives?
Do semantic concepts have any influence on the attention of the most important product components?
How can emotional evaluations of special design alternatives be measured?
Do semantic concepts have any influence on emotions concerning special design alternatives?
Which impact do semantic concepts have on the relevance of visually perceived product components?
How can this methodology be integrated and ensured in a product development environment?
Choice of Design Alternatives
Determination of Product Structure Generating Semantic Framework
Integration objectified data about user attention and emotion into PDP
Alignment of Semantic Framework and Product
Applying Quality Gates
Structure
Component Product Idea Product Develop- Design Product Concept Prototype Realization ment
Pre-series Production
Alignment of common product understanding and relevant product components
Model Building and Design
Objectification of user attention and emotions for the assessment of product design alternatives Evaluation
Applying appropriate statistic methods e.g. repeated-measures ANOVA, T-paired test
Figure 5: Methodology for integrating customers' visual perception into PDP based on Kansei Engineering (based on Schütte, 2005 and Ehrlenspiel, 2009)
Figure available in the original PDF paper.
As part of a comprehensive methodology based on Kansei Engineering (see Figure 5 and Köhler and Schmitt, 2012; Schmitt et al., 2013; Köhler, Falk and Schmitt, 2013) the following methods and steps are used to answer the aforementioned research questions:
Structuring the product by systems analysis and structured approach towards Perceived Quality
Applying Eye-Tracking to identify most important components of a product design alternative by investigating user’s attention
Collecting and reducing systematically different product ideas, descriptions and deriving semantic concepts
Aligning customers’ and company’s product understanding by methodical collection of words representing the product understanding
Applying semantic concepts to differentiate between design alternatives
Linking product understanding with perceived product components and delivering design rules
Applying appropriate statistic methods in order to derive significant decision
Objectifying the explicit and latent emotional response
Extending Quality Gates of PDP by integrating elicited data of user’s attention and emotional evaluation Methodology of CONEMO
Since measuring visual impressions is often more decisive than other impressions (e.g. haptic, acoustic) especially during the early phases of PDP (Duchowski, 2007), the research project CONEMO (Köhler and Schmitt, 2012; Schmitt et al., 2013) focuses on an extended Kansei Engineering methodology enabling to evaluate the visual perception of product concepts and designs. The developed methodology aims at collecting objective data and parameters about visual perception of design alternatives by Eye-Tracking combined with traditional methods (e.g. questionnaires) in order to evaluate different design concepts and to gradually integrate the collected knowledge into the PDP.
Generating Determining
Capturing & Implications
Aligning Semantic Framework & Evaluating
Semantic Framework
Product Structure
Emotions
for PDP via Quality Gates
Product Structure
Figure 6: Extended Kansei Engineering Methodology
Figure available in the original PDF paper.
Definition of the Semantic Framework Already in the phase of product idea of the PDP, it is important that both, company and target customer group are “talking about the same things”. Therefore, the central goal is to align the company’s orientation on upcoming products with the customer perspective in order to define a semantic framework consisting of semantic concepts describing best a common product understanding.
Generating concepts
Reducing concepts
Company‘s orientation
Product Understanding
Customer‘s Perspective Validating concepts
Figure 7: Creating a common product understanding (left) and reducing the number of product ideas
Figure available in the original PDF paper.
(right)
A first step is to transfer company’s ideas for upcoming products into describing words or semantic concepts. Supporting methods are focus group workshops and semi-structured interviews conducted with company representatives. Further, the company has to identify the potential target groups taking into account demographic criteria. The customer perspective is defined by using standardized questionnaires or open interviews. The assessment of these semantic concepts applying semantic differentials and scales should be done without knowing the future product. Correlation analysis is used in order to assess the consistency between customers’ and company’s requirements regarding a product understanding of an upcoming product. Then, appropriate methods to reduce the amount of words are affinity diagrams, factor analysis and structural equation modeling. Moreover, the Kano Model can be used in order to classify semantic concepts, e.g. into “must-be”- and “attractive”-requirements (Köhler, Falk and Schmitt, 2013). The results of this step are strategy requirements catalogues or strategy matrices overlapping both semantic spaces in order to find a framework for the according product understanding.
Product Structure The deduction of the product structure from product prototypes, sketches or even computer-rendered pictures and the definition of relevant product components (Product tear-down via Eye-Tracking) are the central goals of this step and are e.g. part of the phase of product concept of the PDP. It is a breakdown either by technological properties (systems analysis) or perception clusters based on the evaluation of customers’ perception (see chapter 2.3). The technical method for conceptual disassembling a system into its subcomponents is the systems analysis that lacks the ability of visible evaluation.
Technical Level
Perception Perception Overall Impression Cluster
Overall Product Component
Figure 8: Systems analysis (left), structured approach towards Perceived Quality (right) Therefore, a structured approach towards Perceived Quality (Schmitt and Pfeifer, 2010) in combination with an Eye- Tracking system provide a solution to objectively subdivide a product beginning from the overall product impression perceived by a customer down to technical parameters. With the help of Eye-Tracking systems, the perception of customers can be followed, measured and collected which finally leads to the identification of the most relevant components according to the visual impression. The most relevant components and data are pointed out with methods like Pareto-Analysis.
Figure available in the original PDF paper.
Alignment of Semantic Framework and Relevant Perceived Components This step consists of the correlation between semantic concepts and relevant product components or the linkage between semantic concepts and design alternatives on the level of overall impression. Results of this step could be applied in the phase of product design of the PDP. This can be achieved by connecting the derived semantic framework (3.2.1) with the deduced product structure by using the most relevant product components (3.2.2). Moreover, sub strategies can be derived for single semantic concepts as well as for single product components. Results of this step are product design recommendations (design rules) and a reduced number of appropriate product design alternatives.
Company Customer / Target Group [Equation or mathematical symbol available in the original paper PDF]Company and Product [Equation or mathematical symbol available in the original paper PDF]Customer preferred Strategy product quality attributes
according to the requirements of the target group 1
[Equation or mathematical symbol available in the original paper PDF]Correlation between relevant components
Product level Overall Product Component Part
and semantic concepts
Structured questionnaires
Observation of design alternatives by using Eye-
Evaluations
Tracking (e.g. fixation time)
system elements of
Definition of relevant
Perception
Implications for Design
product alternatives 2 Implications for Design Evaluations
Figure 9: Alignment of product understanding and quality attributes (based on Köhler and Schmitt,
Figure available in the original PDF paper.
By linking product components with semantic concepts a resulting matrix consisting of product understanding and quality attributes (strategy-quality attribute-matrix, (Köhler and Schmitt, 2012)) provides information about product design alternatives and shows which of these components or even entire product alternatives have higher importance concerning a semantic concept than others (see Figure 9). Therefore, for a certain time period gaze tracks, the order and the duration of eye fixations are recorded by the usage of Eye-Tracking in order to deduce the attention provoked by certain product elements. While thinking of a semantic concept, the attention and the view are focused on the components that are considered as connected to this concept (Yarbus, 1967). Thus, it is possible to capture the implicit customer requirements. To validate results, a comparison of both self-reporting-methods and gaze tracking identifies similarities and differences between explicit expressed and implicit recorded customer requirements. Consequently, this step considers the discrepancy analysis of customers’ answers regarding the overall impression of a product collected by semi-structured interviews and standardized questionnaires (articulated and explicit information, self-reporting methods) and visual measurements (latent and implicit information).
Capturing Emotional Evaluation The objective of this step is to survey the emotional response in order to investigate whether customers’ evaluation is positive or negative. Besides visual measurement systems, like Eye-Tracking, , self-reporting-tools are applied as well as methods for measuring physiological signals to gather user’s attention provoked by Perceived Quality. However, self-reporting-tools are only useful to obtain information about the conscious part of customers’ emotions. Therefore, there is a need for measurement methods measuring the changes of physiological signals (bio-signals). The most suitable physiological measurements are Facial EMG (Electromyography), measuring valence (like- dislike) and GSR (Galvanic skin response), measuring arousal (intensity). To distinguish between product design alternatives, physiological signals could be evaluated by a two-dimensional approach (GSR, EMG) to objectify the emotional response (Schmitt et. al, 2013).
Implications for Product Development and Implementation of Quality Gate Systematics Finally, the gathered information about customers’ attention and emotions are extracted and integrated into the PDP. The presented extended Kansei Engineering methodology provides the necessary information regarding perceived product quality to pass the Quality Gate and enter the next phase. Before integrating the gathered information, the existing product development environment must be adjusted and Quality Gates must be accurately positioned. After having accomplished the preparation, the next step focuses on the definition of objectives during the PDP. The main objectives are decomposed into stage-related objectives. These specific objectives of each PDP stage represent the criteria, requirements and methods used as control points for each Quality Gate. Furthermore these objectives are derived by the different contents of the extended Kansei Engineering methodology. Especially in the early periods of the PDP (product idea, product concept and product design), it is essential to focus on a customer-centered design.
RESULTS
The illustrated methodology was investigated and proven in several user studies, continuous as well as stepwise, during the research project CONEMO and validated together with SMEs from different branches. The considered products were a mountain bike, a car exterior and a watch. Different product alternatives were emotionally evaluated and compared in different phases of the study schedule. Each study revealed specific findings and indications for a well-structured and successful study design.
Generating a Semantic Framework First of all studies, an overview of semantic concepts was generated in order to find out what customers and company associate with the respective product. That procedure is crucial for aligning customer’s product understanding with the companies’ strategy (Köhler and Schmitt, 2012), because semantic concepts ensure that customer and company think similarly about the product’s requirements and emotional perception. There are several methods to find semantic concepts such as internet research, interviews with experts and focus group workshops. For an effective study design the amount of semantic concepts was reduced to a maximum of 6 concepts. Thereby, logical exclusions, diagrams of affinity or factor analysis can be applied to discover these semantic concepts that emotionally describe the product best. In conclusion, the revealed concepts have to be validated, for example by a customer- or company-oriented questionnaire, a Kano study or statistical analysis (Köhler, Falk and Schmitt 2013).
Determination of a Product Structure (Focusing on Visible Product Components) Nearly 80 percent of all information about a product is gathered visually by the eye (Berghaus, 2005). Therefore, a specific knowledge about the respective product structure perceived visually is necessary to align the level of customers’ perception with the level of technical parameters. Systems analysis and a structured approach towards quality perception were applied to detect relevant clusters of perception. These perception clusters are represented by so called areas of interest which are important for setting up a subsequent Eye-Tracking study. The results of the presented methodology revealed that the amount of perception clusters mainly depends on the complexity of the studied product. For example, a car exterior was structured into 20, a watch into 11 and a mountain bike into 6 clusters of perception (Köhler, Falk and Schmitt 2013).
. Figure 10: Example of defined areas of interest (Köhler, Falk and Schmitt 2013) Alignment of Semantic Framework and Relevant Perceived Product Components
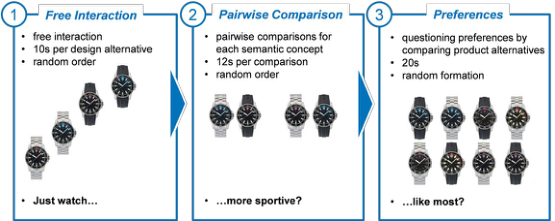
Since Eye-Tracking systems are able to track the gaze of subjects while watching the studied product and the gaze track is affected by current thoughts and emotions (Yarbus, 1967), the presented methodology mainly applied Eye- Tracking to gather objective data about visual product impressions. Moreover, these visual impressions were also used to reveal implicit and latent customer requirements. To align semantic concepts with the defined perception clusters, the Eye-Tracking studies were also organized in three phases: During the first phase (free interaction), pictures of each design alternative were separately shown for 10 to 12 seconds in order to capture reference values and to gather information about most relevant product components. Since learning effects and initial excitement can influence the results, the order of the presented pictures can organized randomly. The presented methodology revealed that seeing a specific product alternative for the first time gives precise information about the most relevant components - relevant components were identified by applying, e.g. Pareto-analysis. Pareto-analysis derives, which areas of interest were focused more than 80% of the whole mean time during free interaction. Moreover, it could be revealed that the duration that each picture is shown to the test subject also depends on the product structure and complexity. The second phase slightly differed in all conducted studies. On the one hand, the product alternatives were separately shown, connected to one of the pre-defined semantic concepts. Thereby, the test subject should think at the presented semantic concept and visually evaluated the shown product alternative. On the other hand, in another study, pairwise comparisons were conducted in combination with one pre-defined semantic concept. In this process, the test subjects should cognitively focus the semantic concept and compare both product alternatives. During the last phase, pairwise and overall comparisons of all alternatives were conducted in order to gather preferences and design evaluations in general (Köhler, Falk and Schmitt 2013).
Figure 11: Example of an Eye-Tracking schedule for watches (Köhler, Falk and Schmitt 2013) Capturing and Evaluating Emotions
Each conducted study revealed specific results about customers’ requirements and product evaluations. For analysis of the gathered data, statistical procedures like Pareto-analysis, T-Paired Tests, ANOVA or repeated-measures ANOVA were applied to detect statistically significant influences of semantic concepts on product alternatives and to interpret preferences and evaluations. In addition, questionnaires were used to compare explicit and implicit user opinion. The questionnaires were structured similar to the Eye-Tracking studies and gave additional data about preferences and requirements.
Some selected results of the studies revealed that semantic concepts could have a significant influence on design evaluations. Moreover, the most important components of the respective products could be determined and connected with specific semantic concepts. The data also revealed which design alternatives were preferred and, subsequently, how designers could advertise the product or product components. All this information can be summarized and used to build models that ensure a high Perceived Quality and indicate how a product should look like with regard to the companies’ perspective and latent as well as explicit customer requirements.
Implications for the PDP The integration of the most useful information of the extended Kansei Engineering methodology into the PDP was analyzed during CONEMO and validated by SMEs. After collecting different kinds of requirements (SME specifications, specifications based on Quality Gate Integration) a software-based tool was developed which maps the implementation of the Quality Gate systematics. It aims at supporting SMEs in order to collect, edit and provide relevant information which are relevant for objectifying customers’ emotions systematically, especially in early phases of the PDP. The tool provides a project plan with strong focus on the implementation of emotion evaluation methods. Information about main objectives, task descriptions, requirements, criteria and recommended methods are given, especially for the early phases of the PDP (e.g. Product Idea). Furthermore, responsibilities for each phase are shown as well as the maturity level of tasks and phases based on a traffic light systematics (see Figure 12). By integrating a Quality Gate systematics, SMEs are sensitized to focus on emotional product design. Based on a traffic-light systematics the product developer can recognize the status of the PDP and the level of consideration which was taken into the implementation of visual measurement methods increasing perceived product quality.
Figure 12: Screenshot of the software-based tool using the extended Kansei Engineering methodology
Figure available in the original PDF paper.
DISCUSSION
In a critical review the presented methodology, the study design and its results have to be analyzed. Regarding the study design, different useful lessons learned can be derived for practical application of the methodology. The conducted studies showed that Eye-Tracking can be applied to indicate relevant product attributes. Furthermore, semantic concepts affect the individual gaze-track and the attention evoked by relevant product attributes. The results should be interpreted on a very detailed level of quality attributes in order to link feelings expressed by semantic concepts with the attention measured by the time ratio. In general, for improving the result significance of the study the number of subjects has to be increased.
Regarding the validation by SMEs, some useful lessons learned can be deduced for describing their general situation and their product development environment. Results of expert interviews with representatives of the SMEs’ product development department highlighted the fact that most SMEs do not have a systematic procedure for collecting customer requirements and transparency about their own PDP. Additionally, SMEs usually do not focus on customers’ perspectives during early phases of the PDP. Moreover, SMEs do not have either any financial capacities or specific know-how or methods in order to conduct multi-sensorial studies, e.g. via Eye-Tracking. The feedback of SMEs regarding the usage of the software-based tool underlines that the collected requirements have been implemented well. The usability and the layout of the developed software-based tool based on Microsoft Excel® have been pointed out as intuitive, clear-structured and the tool was assessed as cost efficient. In conclusion, SMEs assessed the extended Kansei Engineering methodology and its implementation into a software-based tool as a communication structure for handling new emotional data which supports their decision-authority during the PDP.
CONCLUSIONS AND FUTURE RESEARCH ACTIVITIES The presented extended Kansei Engineering methodology reveals how to gain valuable input data of customers by applying visual measurement systems as Eye-Tracking in order to determine relevant product components and to compare different product designs on different levels of perception. Additionally it is also revealed how to implement these comprehensive customer data into different phases of the PDP, especially in the early ones. The integration of gaze tracking into the Kansei Engineering methodology can be applied to align customers’ product understanding with technical parameters in order to design products with a high Perceived Quality. Nevertheless, the results show that usual techniques for gathering customers’ product impressions (e.g. questionnaires) should be supported by more objective applications in order to understand customers’ product evaluations and decisions entirely which leads to a more comprehensive basis for decision-making during the PDP. Moreover, the methodology is to be extended stepwise by studying further and detailed levels of customers’ perception. Further research should also concentrate on deeper analysis of recorded Eye-Tracking data to interpret why subjects really focused one component longer than another as well as on the influence of the number of subjects on more significant results. Besides the different possibilities of sensorial measurement systems, the implementation of Quality Gates and the resulting software-based tool can be adapted and extended by assessment heuristics in order to consider different significance levels concerning the defined tasks (objectives) during each stage of the PDP. Based on these assessment heuristics, traffic light systematics, as a part of the Quality Gates systematics, can be applied more accurately in order to grant approval for passing the Quality Gate and entering the next stage of the PDP.
Possible extensions could be the implementation of research studies regarding the haptic perception at a later stage of the PDP when prototypes are already designed. During the prototype realization stage of the PDP research studies regarding the perceived usability of products and multi-sensorial, combined visual and haptic, perception can be applied in order to objectify most of the sensorial perception of the customer.
ACKNOWLEDGEMENTS
The paper presents results from the cooperative research project CONEMO (funded by CORNET program) of the Laboratory for Machine Tools and Production Engineering (WZL), RWTH Aachen University, Germany together with the Institute of Biomechanics of Valencia (IBV), Spain. The funding agencies are IMPIVA (Operational Programme FEDER of the Comunidad Valenciana, Spain) and AiF (Germany). The CORNET promotion plan 47EN of the Research Community for Quality (FQS), August-Schanz-Str. 21A, 60433 Frankfurt/Main has been funded by the AiF within the program for sponsorship by Industrial Joint Research and Development (IGF) of the German Federal Ministry of Economic Affairs and Technologies based on an enactment of the German Parliament. The authors would like to express their gratitude to all parties involved.
REFERENCES
Beaujean, P., Grob, R., Häfen, K., Köbler, E., Köhler, M., Quattelbaum, B., Schmitt, R., Seitz, R., Wagner, M., & Willach, A.
(2011), “Emotionale Produktgestaltung – Wert der wahrgenommenen Qualität“, in: Proceedings: Tagungsband zum AWK, Brecher et al. (Eds.). pp. 229-264. Berghaus, N. (2005), “Eye-Tracking im stationären Einzelhandel. Eine empirische Analyse der Wahrnehmung von Kunden am Point of Purchase”, Dissertation. University of Duisburg-Essen, Germany. Cooper, R. G. (1994), “Third-generation new product processes”, PRODUCT INNOVATION MANAGEMENT Volume 11 No.
1. pp. 3-14 Duchowski, A. T. (2007), “Eye Tracking Methodology: Theory and Practice”. Springer, London, United Kingdom. Ehrlenspiel, K. (2009), “Integrierte Produktentwicklung: Denkabläufe, Methodeneinsatz, Zusammenarbeit”, Hanser München/Germany Falk, B., Quattelbaum, B., Schmitt, R. (2008), “Product Quality from the Customers‘ Perspective – Systematic Elicitation and
Deployment of Perceived Quality Information”, in: Proceedings of the 6th CIRP-Sponsored International Conference on Digital Enterprise Technology, Huang, G. Q., Mak, K. L. & Maropoulos, P. G. (Eds.). pp. 211-222. Hoeks, B., Levelt, W. J. M. (1993), “Pupillary dilation as a measure of attention: A quantitative system analysis”, BEHAVIOUR, RESEARCH METHODS, INSTRUMENTS, & COMPUTERS Volume 25 No. 1. pp. 16-26 Hofer, N., Mayerhofer, W. (2010), “Die Blickregistrierung in der Werbewirkungsforschung. Grundlagen und Ergebnisse”, DER
MARKT Volume 49 No. 3-4. Kano, N. (1984), “Attractive quality and must-be quality”, HINSHITSU: JOURNAL OF THE JAPANESE SOCIETY FOR QUALITY CONTROL Volume 14 No. 2. Köhler, M., Falk, B., Schmitt, R. (2013), “Objectifying user attention caused by visually perceived product components”, in:
Proceedings of 16th International Congress of Metrology. DOI: http://dx.doi.org/10.1051/metrology/201314002. Köhler, M., Schmitt, R. (2012), “Systematic Consumer Evaluation Measurement for Objectified Integration into the Product Development Process”, in: Advances in Affective and Pleasurable Design, Ji, Y.G. (Ed.). pp. 503-512 Lee, S., Harada, A., Strappers, P. J. (2002), “Pleasure with Products: Design based Kansei”, in: Pleasure with Products: Beyond
usability, W. Green & P. Jordan (Eds.). pp. 219-229. Lindemann, U. (2005), “Methodische Entwicklung technischer Produkte”, Springer, Berlin Germany. Nagamachi, M. (1989). “Kansei engineering”. Kaibundo, Tokyo, Japan. Nagamachi, M. (1995), “Kansei Engineering: A New Ergonomic Consumer-oriented Technology for Product Development”, INTERNATIONAL JOURNAL OF INDUSTRIAL ERGONOMICS Volume 15 No.1.
Mello-Thoms, C., Nodine, C. F., & Kundel, H. L. (2004), “What attracts the eye to the location of missed and reported breast cancers?”, in: Proceedings of the Eye Tracking Research and Applications Symposium, ACM Press (Ed.). pp. 111-117 New York, USA. Osgood, E. C., Suci, G.J., Tannenbaum, P.H. (1957), “The Measurement of Meaning”. Urbana, Illinois, USA. Prefi, T. (2003), “Qualitätsorientierte Unternehmensführung”, P3 – Ingenieurgesellschaft für Management und Organisation.
Aachen, Germany. Schmitt, R., Pfeifer, T. (2007), “Masing - Handbuch Qualitätsmanagement”. Hanser, Germany Schmitt, R., Pfeifer, T. (2010), “Qualitätsmanagement: Strategien – Methoden – Techniken” München”, Hanser, Germany,. Schmitt, R., Köhler, M., Durá, J., Diaz-Pineda, J. (2013), “Objectifying User Attention and Emotion Evoked by Relevant Perceived Product Components”, in: Proceedings of 11th International Symposium on Measurement Technology and Intelligent Instruments ISMTII. Schmitt, R., Quattelbaum, B., Lieb, H. (2008), “Perceived quality as a key factor for strategic change in product development”,
in: IEEE International Engineering Management Conference. pp. 311-316 New Jersey, USA. Schütte, S. (2002), “Designing Feelings into Products – Integrating Kansei Engineering Methodology in Product Development”, Institute of Technology, Department of Mechanical Engineering. Linköping, Sweden. Schütte, S. (2005), “Engineering Emotional Values in Product Design – Kansei Engineering in Development”, Dissertation.
Institute of Technology, Department of Mechanical Engineering. Linköping, Sweden. Stern, J. A., Boyer, D., Schroeder, D. (1994), “Blink rate: A possible measure of fatigue”, HUMAN FACTORS Vol. 36 No. 2. Yarbus, A. L. (1967), “Eye Movements and Vision”, Plenum Press, New York, USA.
LISTED IN THE AHFE DIGITAL BOOKSTORE CATALOGUE
Explore the complete digital volume
Advances in Affective and Pleasurable Design
Read this individual research paper free through the original publisher, or explore the full digital proceedings book.
ISBN 978-1-4951-2109-8
Explore this ISBN in the AHFE Bookstore ↗Listed in the July 2026 bookstore catalogue; search by ISBN to confirm current availability · Digital book purchase optional