Ralf Philipsen, Philipp Brauner, Sebastian Stiller, Simone Runge, Robert Schmitt, Martina Ziefle (2020). Understanding and Supporting Decision Makers in Quality Management of Production Networks. In: Advances in The Ergonomics in Manufacturing: Managing the Enterprise of the Future. AHFE Open Access, vol. 12. https://doi.org/10.54941/ahfe100429
Quality management is an important aspect of viable manufacturing processes. In order to qualify decision makers to understand the fundamental principles of quality management in production networks, we developed a game-based simulation and learning environment that can furthermore be used to understand how human factors influence the quality of decisions in complex production networks. Previous studies have shown that underlying human factors must exist, that predict the players’ performance, but it is currently unexplored which factors contribute to high performance. To investigate these human factors in more depth and to further refine the quality management serious game, we conducted a series of studies. As expected, expertise had a great impact on performance. However, contrary to our expectations, cognitive skills had no influence. The refined decision dashboard with seamlessly integrated self-adapting visualizations on key performance indicators had a significant positive impact on game performance. Most importantly, the studies suggest that the developed game is a valuable contribution to the vocational training of quality managers as the quality of their decisions is increased.
With the introduction of process orientation in organizations, interfaces between different functions and disciplines came into focus in order to achieve a more global optimization throughout the production system of a whole com- pany or even in supply chains (Gaitanides, 2007). Especially quality and inspection planning as well as production and supply chain management are important disciplines when it comes to management and decision making in value streams and production systems.
Both disciplines use various quantitative and qualitative methods supporting their decisions. In supply chain man- agement statistical analysis of order and inventory data as well as various forecast methods are used for material planning. Moreover, in state-of-the-art inspection planning, risk analysis of product requirements and various statis- tical methods such as the Weibull analysis are used to select inspection policies and quality levels on machine and shop floor level.
Today, modern enterprise resource planning (ERP) systems support managers in their decision making. Neverthe- less, managers have to stay in control of their systems and need to know about cause-and-effect chains as well as logics and routines in the software solutions and decision making systems (Bossel, 2004) (Robinson, 2004) (Greasley, 2004). To train managers in their decision making processes, simulation models and serious games are used to sensitize managers for typical problems in their domains. Simulation games such as the Beer Distribution Game or KANBAN simulations were developed for production and supply chain managers to stress the analytical modeling capabilities in combination with human intuition of managers (Kühl et al., 2009) (Hardman, 2009) (Brauner, 2013). However, quality management did not have an equivalent game in order to train inspection and quality planners in production network before (Philipsen, 2014).
Goldratt’s Game, which was introduced to demonstrate the theory of constraints, addresses quality and inspection planners but lacks the opportunity of decision making. Similar to the Beer Distribution Game, which gives a demon- stration of the Bullwhip effect, Goldratt’s Game is a turn-based game in which players are in charge of the steps of supply chain or production processes, providing and processing vendor parts into a given product. Due to a presup- posed variance which is connected to each of the process steps, the player will find out how variation and poor process quality amplifies in multi-stage production systems. Nevertheless, the players cannot influence the profit in terms of higher revenues or lower costs although total quality management concepts prove the impact of quality management on entrepreneurial and financial success (Schmitt and Pfeifer, 2010).
In order to give quality managers the opportunity to influence the success of the multi-stage-system in production networks, Goldratt’s Game needs to be extended: Quality managers can increase product quality resulting in higher turnover and customer satisfaction while optimizing processes for cost reduction. Hence, a trade-off between prod- uct quality maximization and process quality improvement for lower costs is required.
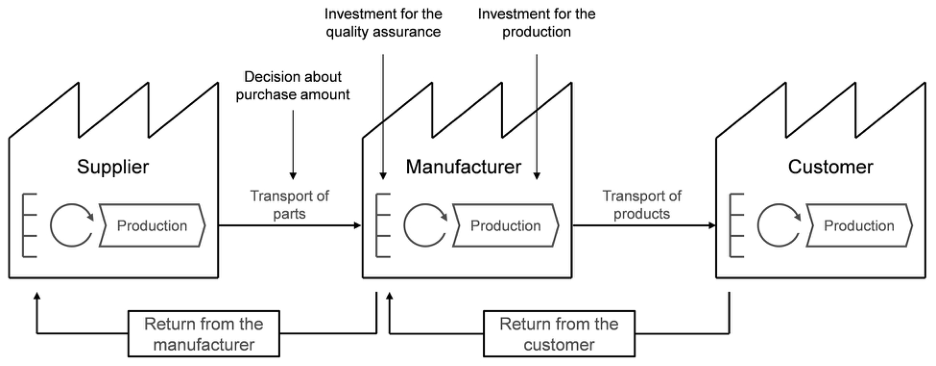
Figure 1: Principle of the Q-I-Game
Our Quality-Intelligence-Game (Q-I-Game) was designed based on a production system with three stages: the sup- plier, the manufacturer, and the customer (see Figure 1). The player will take the role of the manufacturer and make choices linked to the decision problems of quality and production management.
First, the player has to decide about the investment in quality inspection and assurance for incoming goods. The higher the investment in inspection capacity, the lower the rate of faulty parts entering the manufacturer’s produc- tion system thereby decreasing the possibility of bad products significantly. The inspection policy also facilitates the supplier development as the supplier will learn from the complaints and has to reimburse the player for the faulty de- liveries.
Second, the player needs to decide about the investments in the internal product and process quality level. This takes into account that excellent processes and products need a certain investment level to stay on a stable level. As de- scribed in Goldratt’s Game before: Lower investments in production and product quality will amplify the manufac- turer’s variance significantly. The manufacturer will be penalized with rising customer complaints and high scrap rates.
Third, the manager has to decide about the purchase of vendor parts. In addition to the procurement possibilities of the Beer Game, the player has to take the internal scrap rate, poor vendor parts quality and customer complaints into account, risking fines when products are out-of-stock but also increasing his inventory costs when stock levels are too high.
The game gains additional complexity from the introduction of random events: first, a drastic drop of vendor part quality; second, a change of the internal quality function due to severe process problems such as broken machines and measurement instruments; third, the customer demand can shift.
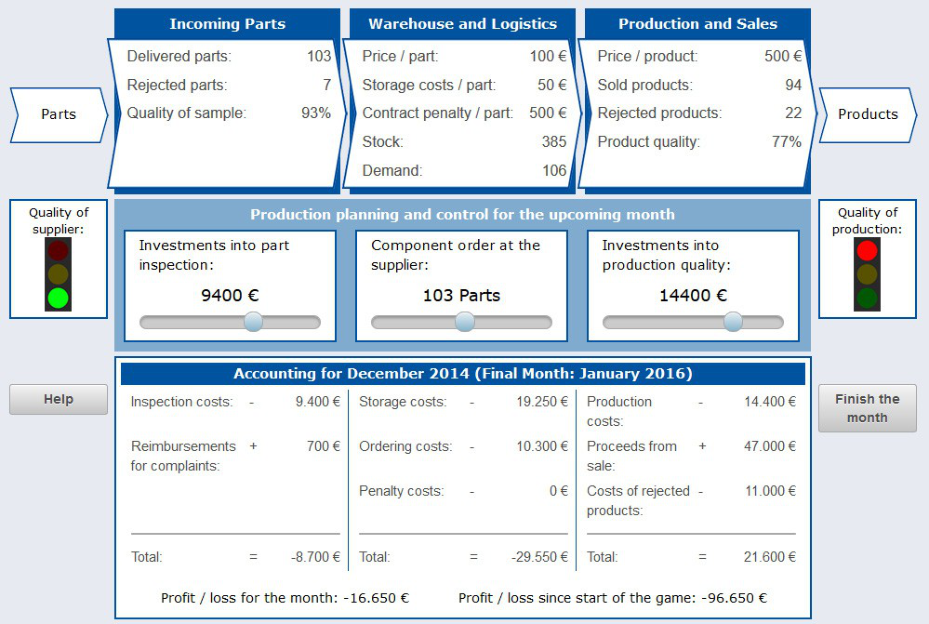
The Q-I-Game was implemented with Java EE 7 to allow a web-based use in trainings and studies. The user inter- face, developed in several iterations with the help of usability experts, arranged the information based on the mate- rial flow within the company (see Figure 2).
Figure 2: Dashboard of the Quality-Intelligence-Game
Previous studies revealed the game’s positive impact on the player’s awareness for quality management issues as well as the player’s ability to adjust quality management parameters to the company’s needs more carefully. Another finding of those studies was that players who achieved a high/low profit in the first round of the game also achieved a high/low profit in the second round. Therefore, underlying human factors must exist that explain players’ perfor- mances in the game, though these factors have not yet been clearly identified. However, it has already been proven that personality traits, risk tolerance, and the personal attitude towards quality have no significant influence on player’s performance (Philipsen et al., 2014).
RESEARCH OBJECTIVES The objectives of this research were twofold. First, it is another step towards closing the knowledge gap regarding the influence of user diversity on decision making in quality management and within the developed simulation in particular. Therefore, the first part of our research dealt with understanding decision-makers by analyzing the impact of thematic expertise and cognitive skills, e.g., information processing and reasoning, on performance within the simulation. Second, we improved the user interface of the game to support users to make better decisions and thereby gain higher performances without changing the game model itself. In order to achieve these goals three con- secutive studies were conducted.
The following sections describe the basic methods of conducting and evaluating our studies. Afterward, the methods and results of the individual studies are presented before the results of all studies are combined.
Game Conditions and Variables In general, all of our studies consisted of a combination of the quality management simulation and survey elements, i.e., either a questionnaire or an interview. Each participant had to play two rounds of the game consisting of 24 sim- ulated months each. In contrast to previous studies, the game conditions were kept constant in both rounds. There was only a spontaneous drop in the internal production’s quality, while the supplier’s quality had the standard vari- ability in relation to player’s complaints, but was not exposed to any spontaneous changes. Previous studies identi- fied these conditions as the highest level of difficulty (Philipsen et al., 2014).
The achieved profit within the game was considered the key measure a for player’s performance. Furthermore, addi- tional values were analyzed in order to classify the playing behavior, for example durations, frequency of adjust- ments, the average quality of outgoing products, or the resulting contract-penalties for failing to meet customer de- mands. Only the first 20 months of each round played were included in the analysis, to rule out last-minute changes in playing behavior, such as emptying the storage completely at the end of the game. Unless otherwise indicated, all values relating to profits, penalties, and investments will be presented as rounded to thousands for clarity reasons: computations, however, have been conducted with exact values.
Scales and Evaluation All surveys contained several questions to gather demographic data like age, gender or levels of education. Further- more, the scale of technical self-efficacy of Beier’s inventory (Beier, 1999) was used to classify the participant’s affinity towards technology. 6-point Likert scales were used in surveys for all non-dichotomous questions dealing with user opinions, ranging from 0 (no approval) to 5 (complete approval). Unless the observed variable offered a clear dichotomy, groups were created with median splits. The data obtained was analyzed using bivariate correla- tions as well as uni- and multivariate analyses of variance (ANOVA, MANOVA). Additionally, Pearson’s chi- square tests were used to identify significant associations between categorical variables. Pillai’s trace values (V) were considered for significance in multivariate analysis. α = 0.05 was the criterion for significance in all tests.
IMPACT OF EXPERTISE AND COGNITIVE SKILLS The first study was conducted in order to identify underlying human factors that impact a player’s performance. Be- cause previous research had already shown that personality traits, risk-taking, and the attitude towards quality have no significant influence on decision-making in the simulation (Philipsen et al., 2014), the present study focused on the influence of thematic expertise and cognitive skills. In decision-making situations, the user has to take into ac- count a variety of data provided by the dashboards of modern enterprise-resource planning (ERP) systems. Informa- tion and its interrelations have to be perceived, processed, and evaluated, whereby especially the speed of informa- tion processing, the capacity of the working memory, and the reasoning capability could be of importance.
Method
The study was designed as laboratory experiment for several reasons. First, previous studies showed the difficulty to identify thematic expertise and knowledge in online studies, because the gathered data is mostly based on self-as- sessments of the participants, whereas laboratory experiments allow a more accurate classification of the individual level of knowledge and the professional occupation. Second, most tests dealing with cognitive skills cannot be con- ducted online in a reliable way. For those reasons, all user tests took place in a controlled environment at the Hu - man-Computer Interaction Center of RWTH Aachen University.
The impact of several cognitive skills on performances within the game were studied. The number-comparison test of Ekstrom et al. (Ekstrom et al., 1976) was used to classify user’s capability of perceiving and processing numbers. Furthermore, the user’s working memory, especially its capacity and the speed of information processing regarding letters, was measured with Lehrl and Blaha’s KAI-N test (Lehr and Blaha, 2001). Additionally, the participants de- ductive reasoning abilities were assessed with the Intelligence-Structure-Test 2000R of Amthauer et al. (Amthauer et al., 2001).
Participants 24 people took part in the experiments. Eight of them worked at the department of mechanical engineering and in- dustrial management of the RWTH Aachen University. Accordingly, dealing with quality management, production planning, and supply-chain management was part of their daily work. Therefore, these participants formed the group of experts. 16 participants from RWTH Aachen University and the FH Aachen University of Applied Sciences who had no previous knowledge or experiences regarding the subject were recruited as a control group. 70.8% (17) par- ticipants were male, 29.2% (7) female. The age ranged from 21 to 40 years with a mean of 27.4 years (SD = 4.8). 58.4% (14) had a university degree, 37.5% (9) a high school diploma, and 4.2% (1) had finished a vocational train- ing. The average level of technical self-efficacy in the sample was rather high with M = 4.1 (SD = 0.8) and a scale maximum of 5.
The scores in the number-comparison tests ranged from 11.0 to 31.0 (scale: min = 0, max = 48) with an average score of 20.8 (SD = 5.6). The average memory span of the sample determined by KAI-N test was 7.0 (SD = 1.0) (unitless scale: min = 0, max = 8.6) and the average speed of the participants’ working memories was 20.0 (SD = 2.3) (unitless scale: min = 0, max >= 23). Therefore, the expected values regarding people with a high school diploma or university degree of Mmemory, exp. > 5.8 and Mspeed, exp > 18 (Lehrl and Blaha, 2001) were met. The scores in the reasoning test ranged from -6 to 7 (unitless scale: min -12, max = 12) with an average score of M = 1.2 (SD = 2.9). The only significant difference between experts and amateurs regarding cognitive skills was found in the mem- ory span (F (1, 22) = 9.646, p = .005 < .05 *). On average, experts achieved higher values (M = 7.8, SD = 0.6) than amateurs (M = 6.6, SD = 1.0).
Results
In the following section some tendencies will be presented that we assume are significant effects. However, we could not conclusively prove their impact due to the small sample size. This fact will be discussed in more detail in the discussion part of this paper.
The achieved profits within the game varied greatly across all participants and ranged from -492.5 to +269.8 in the complete sample. In accordance with previous studies, a correlation between players’ performances in the first and second round (r = .646, p = .001 < .05 *) was found. Players who achieved a high/low profit in the first round, on average achieved the equivalent level of profit in the second round. Additionally, players were able to significantly improve their average profits in the second round (V = .255, F(1, 22) = 7.546, p = .012 < .05*).
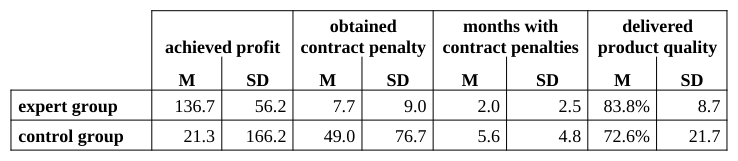
Table 1: Average achieved profits, obtained contract penalties, and quality of delivered products based on expertise level achieved profit obtained contract penalty months with contract penalties delivered product quality
The experts achieved an average profit of 136.7 (SD = 56.2), while the participants in the control group, hereinafter referred to as amateurs, could gain an average of 21.3 (SD = 166.2) (see Table 1).
Although a significant impact of expertise on the achieved profit (F(1, 22) = 3.582, p = 0.72, n.s.) could not be shown directly, there was a significant association between the participants’ expertise and whether or not they be- long to a high performing group in the game (Χ2(1) = 6.750, p = .027 < .05 *). Furthermore, the experts caused on average lower contract penalties (M = 7.7, SD = 9.0) than the amateurs (M = 49, SD = 76.7) and the number of months in which penalties had to be paid was lower in expert group, as well (see Table 1). However, the criterion for significance was not reached for either value, with F(1, 22) = 2.262, p = .147, n.s. for the impact of expertise on the averagely obtained contract penalties and F(1, 22) = 3.855, p = .062, n.s. for the impact on the number of months with penalties. The products delivered by participants of the expert group had on average a higher quality (M = 83.8%, SD = 8.7) than the amateurs’ (M = 72.6%, SD = 21.7), but this difference could not be proven significant ei- ther (F(1,22) = 1.954, p = .176, n.s.).
None of the researched cognitive skills correlated with the players’ performances. Neither the speed of information processing (rno-comparison = -.031, pno-comparison = .885, n.s. and rkai-n = .309, pkai-n = .142, n.s.) nor the capability of reasoning reached the criterion for significance (r = .372, p = .074, n.s.).
IMPROVEMENT OF THE USER INTERFACE In addition to analyzing the impact of human factors on players’ performances, a second study was conducted to im- prove the existing user-interface, which was developed in several iterations with usability experts, with the aim to assist participants in achieving a better performance without changing the game model itself. In particular, the focus was on the question what information has to be provided and how it should be visualized in order to achieve an opti- mal game score. Although high values of obtained contract penalties and lacking user reactions after spontaneous quality drops in previous studies (Philipsen et al., 2014) revealed that the current presentation of storage and quality levels could be improved, the most important information for achieving high profits is not yet fully identified.
Method
This improvement study was also designed as a laboratory experiment, in which the participants had to first play the game and then do a card-sorting task. All 25 values provided within the game had to be sorted into groups ranging from “not relevant” to “very relevant” with the aim to adapt the presentation of information based on its importance in the revised interface. The “Law of Categorical Judgment” by Thurstone (e.g., Bortz and Doering, 2006) was used to analyze the significance of the group assignments and the sizes and boundaries of the groups themselves. After the card-sorting, guided interviews were conducted to find out which parts of the user interface were perceived as good or bad and which elements needed improvement, e. g., to resolve comprehension problems. Additionally, users were asked whether and what additional information has to be provided in the game to achieve a better score.
Participants The sample consisted of 10 participants recruited at the department of mechanical engineering at RWTH Aachen University. Their age ranged from 22 to 33 years with a mean age of 27.2 years (SD = 3.3). 60% (6) of the partici- pants were male, 40% (4) female. 70% (7) mentioned a university degree as highest achieved level of education, while the remaining 30% (3) had a high school diploma. The average level of technical self-efficacy in this sample was 4.1 (SD = 0.5).
Results
The analysis of the card sorting task has consistent results regarding the group assignments. Only 4 of the 25 values were rated as very relevant by the users. This category with the highest level of importance consisted of the values product quality, demand, profit/loss per month and stock. The number of rejected products, the profit/loss since the start of the game, and the quality of sample were mentioned by the participants as relevant for their decision-mak- ing. The rest of the provided information was rated as hardly or not relevant. Especially the static values that do not change during a game, like the storage costs per part or the contract penalties per non-delivered product, were rated as not relevant.
All in all, the users’ evaluation of the existing interface was rather positive during the interviews; yet there were ele- ments that were criticized and need improvement. The interviews revealed that some participants had problems with the used wordings in the game. Especially the word “demand” was mentioned as unspecific and ambiguous. Addi- tionally, users requested a more conspicuous positioning of this important value on the interface. Another common request was a spatial separation of dynamic and static data, because this would reduce the distraction caused by less important data and increase the perceptibility of changes. Another improvement, requested by 8 out of the 10 partici- pants, were indicators to make the users pay attention to changes, especially for negative or even critical trends. Ar- row-shaped indicators were suggested, because they are already familiar from dashboards used in the financial sec- tor. Finally, some participants mentioned that the help-button was rather hidden and should be made more obvious to avoid it being overlooked by players.
Changes in the Revised Interface The findings of the card-sorting experiments, the interviews and previous studies led to the following changes:
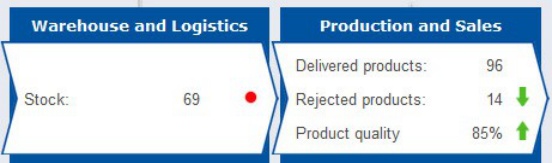
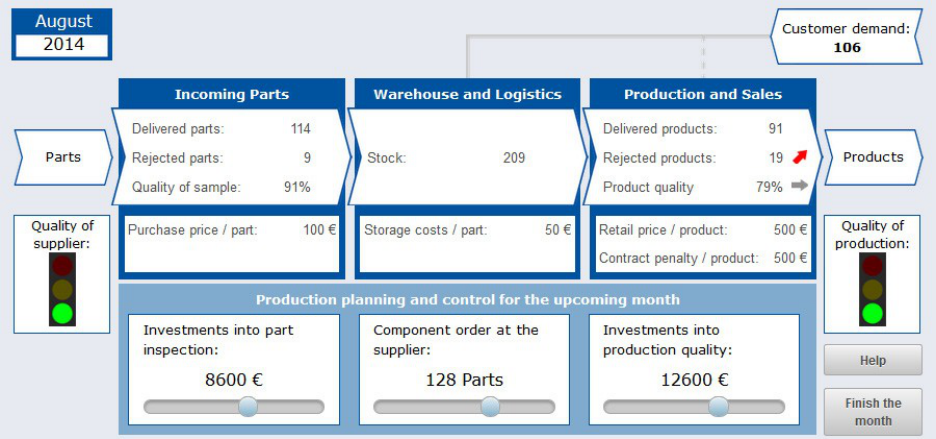
Three indicators were introduced (see Figure 3) for some of the items which were mentioned as highly rele- vant. First, a dichotomous indicator was implemented to warn the user when the storage level is no longer sufficient to meet customer demands. Furthermore, two multilevel indicators in the shape of arrows were introduced to visualize changes regarding the customer complaints and the quality of outgoing products: The arrow’s orientation indicates the relative change compared to the previous month and its color corre- sponds to the implication of this change, with green for a positive trend and red for a negative variation.
Static values that do not change during the game, like the storage costs or the product price, have been spa- tially separated from the dynamic data.
“Demand” was renamed “customer demand” and separated spatially from the information about the own company to symbolize that customer demand is a value received from an external source.
The help-button was moved to the opposite side of the dashboard.
The display of the current month was moved to a more conspicuous position in the upper-left corner.
Figure 3: Indicators for inadequate storage levels (left) and change of product quality / rejected products (right)
Figure 4 provides a screenshot of the new and revised user interface including the aforementioned changes. Further suggestions of participants, for example introducing additional layers to supply other information only on request or changing the provided charts, were not implemented in this first revision.
Figure 4: Upper part of revised user interface
VALIDATION OF THE REVISED USER INTERFACE After implementing the new user interface, another study was conducted to compare both versions and to validate the assumed increase of players’ performances while using the improved interface.
Method
The experimental setup of the study consisted of the mandatory two game rounds and a multi-part online question- naire. The user interface of the game was modeled as a within-subject variable. All participants had to play one round with the old user interface and one round with the improved one. The order of interfaces was fully random- ized between the subjects. The other game conditions, for example spontaneous quality drops, were not changed in comparison to the previous studies. Therefore, the level of difficulty was identical for all players. Also, the game model itself was not changed.
Each round of the game was followed by a questionnaire part to gather the user’s opinion regarding the recently played interface. The questions were mostly taken from the Post-Study System Usability Questionnaire (PSSUQ) from Lewis (Lewis, 1992) and the survey of Prümpter and Anft (Prümpter and Amft, 1993) related to the interna- tional ergonomic norm ISO 9241/10 and adapted to the game context. The focus of the items was on the suitability for the task, the suitability for learning, the self-descriptiveness, and the difficulty of use. The final part of the survey consisted of a direct comparison of the two user interfaces: the users had to decide which of the played interfaces performed better regarding the visualization, positioning and scale of provided information, the positioning of inter- action elements, as well as the usability, learnability, and comprehensibility of the game as a whole. Two-tailed bi- nomial tests assuming a random choice (i.e., 50%) were used to analyze significances for dichotomous questions.
Participants Although a total of 98 people started the introductory questionnaire, only 41 of them played both rounds of the game and finished the post-survey. The data obtained was analyzed with regard to players who have not played seriously. Criteria were, for example, extreme investments or the absence of any adjustments of investments or orders during the game. Therefore, one case had to be removed, which led to the final sample size of N = 40 cases. 24 (60.0%) of the participants were male, 16 (40.0%) were female. Their age ranged from 20 to 65 years, the mean age was 30.3 (SD = 10.9) years. A university degree was most frequently mentioned as the highest level of educa - tion (n = 19, 47.5%), followed by high school diploma (n = 14, 35.0%), and vocational training (n = 4, 10.0%). 64.1% (25) of the participants had previous knowledge in the field of business studies, 57.5% (23) in quality management, and 52.5% (21) in production planning. 30.0% (12) of them had also previous experiences in dealing with enterprise resource planning (ERP) tools. The average technical self-efficacy in the sample was rather high with 3.8 (SD = 1.0). On average, men (M = 4.1, SD = 0.9) had a significantly higher technical self-efficacy than women (M = 3.3, SD = 1.0), with p = .017 < .05*.
Results
There are two separate strands of results for this study: First, we will present the effects of the interface on players’ performances within the game. Second, the results of the user evaluations will be reported.
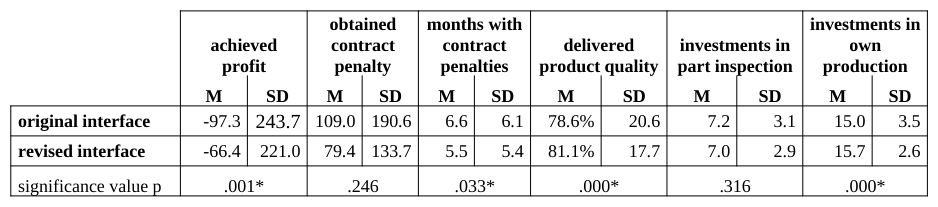
First, the used interface had a significant effect on the players’ performances. Although the average profits in com- parison to previous studies were rather low in the current sample, the players performed better with the new inter- face. Average profits raised from -97.3 (SD = 243.7) to -66.4 (SD = 221.0). The criterion for significance was reached with Pillai’s trace value V = .251, F(1, 38) = 12.738, p = .001 < .05*. Therefore, differences in the players’ behaviors within the game must exist to explain the higher average profit. Although the averagely obtained contract penalties for failure to meet customer orders were higher with the old interface (M= 109.0, SD = 190.6) compared to the use of the new one (M = 79.4, SD = 133.7), this difference was not significant (V = .035, F(1, 38) = 1.387, p = .246, n.s.). Nevertheless, the average number of months in which contract penalties had to be paid decreased sig- nificantly from 6.6 (SD = 6.1) to 5.5 (SD = 4.5) with the new interface (V = .114, F(1, 38) = 4.913, p = .033 < .05 *).
In addition to contract penalties, caused by wrong decisions in procurement, the quality management itself can be the cause of differences in the profit. Participants average quality of sold products rose from 78.6% (SD = 20.6) with the old interface to 81.1% (SD = 17.7) with the new one. This difference corresponds to an average variance of prof- its between 22.5 and 27.5 in dependence on the respective customer demand. This effect was significant with V = .327, F(1, 38) = 18.483, p = .000 < .05*. Furthermore, there was a significant difference in the investments into the own production depending on the used interface. The participants made slightly higher monthly investments while they played the new interface (M = 15.7, SD = 2.6) as opposed to the old one (M = 15.0, SD = 3.5). This ef - fect was significant with V = .293, F(1,38) = 15.747, p = .000 < .05* (see Table 2). In contrast, there was no signifi- cant difference between the two interfaces regarding the investments into the inspection of incoming parts.
Table 2: Average achieved profits, obtained contract penalties, quality of delivered products, and investments based on the different user interfaces and the associated significance values of the differences investments in months with obtained contract achieved penalty contract penalties delivered product quality investments in part inspection own production profit
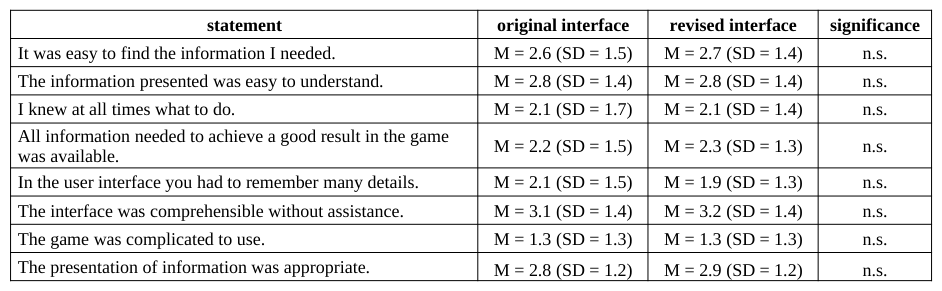
The positive effects of the revised interface on players’ performances did not appear in the user’s individual evalua- tions. There were no significant differences in the ratings of either interface. For simplicity, only the ratings of the revised interface will be mentioned in the following (for all values see Table 3). Most of the items got approval rat- ings around the neutral scale value of 2.5, especially the statements regarding the provided information like “It was easy to find the information I needed” with M = 2.7 (SD = 1.4) or “All information needed to achieve a good result in the game was available” with M = 2.3 (SD = 1.3). The largest deviations from the neutral value of approval were found for statements about the difficulty of using the interface. In particular, the statement “The interface was com- prehensible without assistance” got the highest average level of approval (M = 3.2, S = 1.4), while “The game was complicated to use” was the most negated statement with M = 1.3 (SD = 1.3).
Table 3: Average levels of approval with standard deviations of several evaluative statements statement original interface revised interface significance
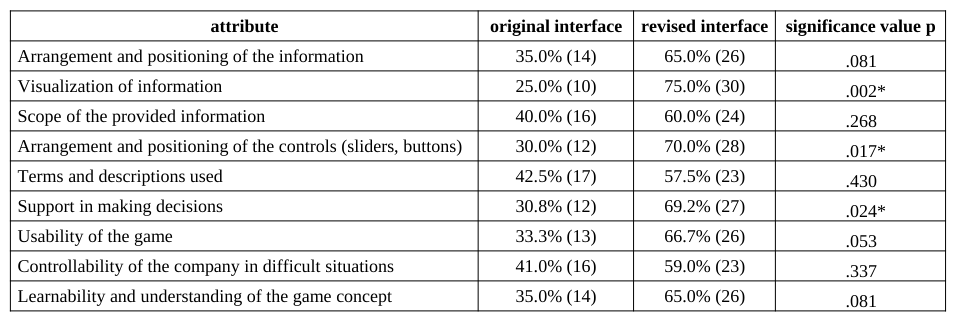
In contrast to this conformity of individual ratings after the respective round of the game, there were unique prefer- ences in the direct comparison within the final questionnaire. The participants had to choose the interface they pre- ferred regarding several attributes like arrangement and visualization of information or the usability of the game. The revised user interface was preferred by the majority of the participants in this dichotomous comparison regard- ing all provided attributes. The percentage of participants who preferred the new surface was between 57.5 and 75.0 percent (see Table 4).
The biggest differences can be found regarding the visualization of information. While only 10 participants (25.0%) preferred the original interface, three times as many preferred the revised one (75.0%, n = 30), which is significant with p = .002 < .05*. Furthermore, there was a significant difference in participants’ choices regarding the arrange- ment and positioning of the controls (p = .017 < .05*): 70.0% (28) of the users preferred the new and revised inter- face, while the remaining 30% (12) gave preference to the original version. Moreover, the majority of participants (69.2%, n = 26) preferred the revised interface regarding its support in making decisions. The criterion for signifi- cance was reached with p = .024 < .05*. The remaining attributes, however, did not lead to a significant difference in the participants’ preferences. For example, the slightest difference existed with regard to the terms and descrip- tions used: 42.5% (17) of the participants preferred the original interface regarding this attribute and 57.5% (23) chose the revised one (p = .430, n.s.).
Table 4: Preferred interfaces regarding several attributes (percentage and absolute values) and significance values of two-tailed binomial tests.
Last but most important, participants were asked which interface version they would choose if they would have to play the game again and a majority of 64.1% (25) preferred the revised one as opposed to 35.9% (14) choosing the original interface. However, this difference was not significant (p = .108, n.s.). The aforementioned values are based on the complete sample. There were no significant differences in the ratings in regards to gender, technical self-effi- cacy, or affiliation with a high- or low-performing group of participants.
DISCUSSION
This section is structured as follows: First, we discuss the identified factors influencing game performance. Second, we discuss the evolved user interface and the visualizations on the key performance indicators. Last, the suitability of the game for vocational trainings is discussed.
As in the first study that investigated the Quality Management Game, a strong correlation between the performance of the first and the second round of the game was found in all three of the presented sub studies. This implies that players who score well/badly in the first round also perform well/badly in the second round of the game. Hence, un- derlying factors exist that explain the player’s performance. However, the current studies were not yet able to ex- plain the players’ performances beyond doubt. The only factor that had a statistically significant influence is exper- tise, with players adept to the topic achieving higher average profits. The hypothesis that cognitive skills (i.e., short- term memory, information processing speed, as well as deductive reasoning abilities) have a positive influence on game performance could not be proven in our studies. Hence, we gained additional evidence that human factors ex- plain performance within the game, but currently we still need to identify these factors. We assume this is caused by three main reasons: First, the rather small sample size of each study would require rather large effect sizes. Second, the rather large variance of cumulated profits within the game hinders the application of sophisticated parametrical tests during data analysis. Third, the comparatively homogenous sample of participants of our studies with almost all participants showing almost matching scores in many of the psychometric tests. Hence, the presented studies will be mirrored with a more diverse user group to enlarge the sample size and add more heterogeneous participants to the samples.
Over the development of the game, the user interface and the decision dashboard continually evolved. During the second study presented above, we investigated how these refinements, specifically the presentation of visualizations on key performance indicators, interact with game performance. The study proved that suitable indicators can indeed amplify the performance within the game and supposedly also within real ERP systems. The overall influence of the indicators on performance was positive, however not groundbreaking. This may be caused by the misinterpreted quality indicators, which helped the participants increase their investments in quality management of their own pro- duction, but not for the incoming goods inspection. Hence, further refinements and evaluations of the indicators are necessary and mechanisms need to be developed that give more differentiated feedback and guidance.
The refined user interface not only had a positive impact on performance, it was also rated more usable and easier to comprehend by the users. Still, the revised interface was not able to provide the feeling of “being in control” of the situation, although the participants actually made better decisions and increased the company’s revenue.
The game itself showed to be a useful apparatus for vocational training. Not only did previous studies document in- creased awareness for quality management issues, also all studies have shown an increased performance for most players in the second round of the game, indicating that players learn to interact comfortably within the simulated supply chain and to adjust the quality management parameters more carefully to the company’s needs. Also, experts offering trainings and certifications in quality management judged the presented game as a suitable extension for their trainings.
SUMMARY AND OUTLOOK We presented a serious game to raise awareness for quality management in manufacturing companies. The game is a useful extension in vocational training of supply chain managers and quality managers. Furthermore, it can be used as an environment for studying the underlying human factors that explain performance and decision quality within the game and hopefully also within real decision scenarios in real companies. Further studies are needed to deeper investigate which human factors are influential for good performance within the game and whether these findings are transferable to real decision scenarios. Furthermore, the results of our studies show empirically that suitable pre- sentations of key performance indicators such as production quality and stock levels increase the players’ perfor- mances. Future studies will need to investigate if these findings are transferable outside the context of this serious game.
Acknowledgments
The authors would like to thank Eugen Altendorf for conducting the card-sorting experiments and the associated in- terviews as well as for the first drafts of the revised interface. Furthermore, Hao Ngo and Chantal Lidynia have to be mentioned for their kind support during the development of the game concept and the revision of this report.
The support of the German National Science Foundation (Deutsche Forschungsgemeinschaft DFG) through the funding of the graduate program “Ramp-Up Management – Development of Decision Models for the Production Ramp-Up” and the Cluster of Excellence “Integrative Production Technology for High-Wage Countries” (Brecher, 2012) is gratefully acknowledged.
REFERENCES
Amthauer, R., Brocke, B., Liepmann, D., Beauducel, A. (2001), "Intelligenz-Struktur-Test 2000 R", Goettingen: Hogrefe Verlag Beier, G. (1999), “Kontrollüberzeugungen im Umgang mit Technik [Locus of control when interacting with technology]“, in: Report Psychologie. Vol. 24 No. 9, pp. 684–693 Bortz, J., Doering, N. (2006), "Forschungsmethoden und Evaluation für Human- und Sozialwissenschaftler", pp. 161-163,
Heidelberg: Springer Verlag Bossel, H. (2004), "Systeme Dynamik Simulation – Modellbildung, Analyse und Simulation komplexer Systeme", p. 24, Norderstedt: Books on Demand GmbH Brauner, P., Runge, S., Groten, M., Schuh, G., Ziefle, M. (2013), "Human Factors in Supply Chain Management – Decision mak-
ing in complex logistic scenarios", in: Proceedings of the 15th HCI International 2013, Part III, LNCS 8018, Yamamoto, S. (ed.). pp. 423–432, Las Vegas, Nevada, USA: Springer Verlag Brecher, C. (2012), “Integrative Production Technology for High-Wage Countries”, Heidelberg: Springer Verlag Ekstrom, R. B., French, J. W., Harman, H. H., Dermen, D. (1976), "Manual for Kit of Factor-Referenced Cognitive Tests", Princeton, New Jersey: Educational Testing Service Gaitanides, M. (2007), "Prozessorganisation: Entwicklung, Ansätze und Programme des Managements von Geschäftsprozessen",
Muenchen: Vahlen Greasley, A. (2004), "Simulation Modelling for Business", pp. 1-11, Burlington, USA: Ashgate Publishing Company Hardman, D. (2009), "Judgment and Decision Making: In: Psychological Perspectives", pp. 120–124, West Sussex, England: John Wiley & Sons Kühl, S., Strodtholz, P., Taffertshofer, A. (2009), "Handbuch Methoden der Organisationsforschung", pp. 498-578., Wiesbaden:
VS Verlag für Sozialwissenschaften Lehrl, S., Blaha, L. (2001), “KAI- N Messung des Arbeitsgedächtnisses“, Ebersberg; VLESS Verlag Lewis, J. R. (1992), “Psychometric evaluation of the post-study system usability questionnaire: The PSSUQ”, in: Proceedings of the Human Factors Society 36th Annual Meeting, pp. 1259-1263, Santa Monica, CA: Human Factors Society Philipsen, R., Brauner, P., Stiller, S., Ziefle, M., Schmitt, R. (2014), “The role of Human Factors in Production Networks and
Quality Management”, in: HCII 2014, New York: Springer Verlag (in press) Prümper, J., Anft, M. (1993), "Die Evaluation von Software auf Grundlage des Entwurfs zur internationalen Ergonomie-Norm ISO 9241 Teil 10 als Beitrag zur partizipativen Systemgestaltung - ein Fallbeispiel", in: Software-Ergonomie ´93 - Von der Benutzungsoberfläche zur Arbeitsgestaltung, Roediger, K.H. (ed.). pp. 145-156, Stuttgart: Teubner Robinson, S. (2004), "Simulation: The Practice of Model Development and Use", pp. 4–11, West Sussex, England: John Wiley &
Sons Schmitt, R., Pfeifer, T. (2010), "Qualitätsmanagement", Muenchen: Carl Hanser Verlag
LISTED IN THE AHFE DIGITAL BOOKSTORE CATALOGUE
Explore the complete digital volume
Advances in The Ergonomics in Manufacturing: Managing the Enterprise of the Future
Read this individual research paper free through the original publisher, or explore the full digital proceedings book.
ISBN 978-1-4951-2103-6
Explore this ISBN in the AHFE Bookstore ↗Listed in the July 2026 bookstore catalogue; search by ISBN to confirm current availability · Digital book purchase optional