Yuuki Hosozawa, Masaomi Kimura (2021). A Proposal of Feature Extraction Method for Press-Through-Package Designs Based on Fourier Transformation. In: Advances in Human Aspects of Healthcare. AHFE Open Access, vol. 13. https://doi.org/10.54941/ahfe100508
In order to prevent medical accidents which originate in using drugs, we need to properly use proper drugs. In Japan, we often use PTP (Press-Through-Package) sheets as a packaging unit of medical drug tablets. In order to prevent PTP sheets from design confusion, we need to establish the method to estimate the similarity of PTP sheets. In this paper, in order to acquire the knowledge about characteristics of PTP design, we applied Fourier transformation to PTP design. Under the assumption that marks and string letters in the design can be approximated into rectangles, we defined the (approximated) function that expresses PTP design. The function consists of a prototile, expressing a layout of rectangles, and its copies. We found Fourier transformation of the function can be expressed as the product of a contribution from the layout of the copies and a contribution from the prototile, the latter of which is found to have large value along lines perpendicular to line segments connecting centers of the rectangles at the center of the FFT image of a PTP design. Based on our discussion and the results of experiments, we obtained the knowledge that the similarity index of PTP design should consist of the similarity of prototiles in PTP sheets in low spatial frequency region and the similarity of the layout of prototile copies.
In order to prevent medical accidents which originate in usage of drugs, we need the proper use of proper drugs. In order to ensure this kind of safety, it is necessary to avoid not only human errors but also confusing packages. Avoidance of confusing package is important, since it can reduce human errors. Actually, it is reported that there were 16 incidents in Japanese pharmacies which originated from the similarity of tablet packages in 2011 (Japan Council for Quality Health Care, 2012).
The problem of confusing packages is expected to be resolved by improvement of package designs. In Japan, we often use PTP (Press-Through-Package) sheets as a packaging unit of medical drug tablets. Ministry of Health, Labour and Welfare submitted a notification that requires a barcode on PTP sheets until July 2015. Though barcode scanning may help identifying drugs, because of similarity of the barcode itself, it can be much more confusing from the viewpoint of visual identification of drugs. In order to prevent PTP sheets with confusing design, we need to establish the method to estimate the similarity of PTP sheets.
Izmiya et. al. (Izumiya, 2007) and Ootsuki et. al. (Ootsuki, 2009) proposed an experimental method to evaluate PTP sheet similarity. They clarified the facts: people do not gaze at barcords printed on a PTP sheet, if a drag name and amount of ingredient is printed in black.
Tamaki et. al. (Tamaki, 2011&2012) experimentally investigated the correlation between the color difference of PTP sheets and their similarity felt by subjects. They showed color difference and similarity have a negative correlation.
Though these three studies are important from an experimental point of view, they do not give us a theoretical basis to discuss how and why PTP sheets are similar.
We focus on the fact that letters and signs are periodically printed on PTP sheets. Let us recall that there are two types of designs on PTP, a pitch controlled design and an endless design. A pitch controlled design locates letters and symbols on the fixed position and generates identical packages. As for an endless design, the letters and the symbols are differently but periodically located on sheets in order to print the brand name, the amount of active ingredient on all sheets without pitch control.
In this study, we employ Fourier analysis to the design on PTP sheets. Since periodicity of the design is two dimensional, we applied two dimensional Fourier transform to the design. Moreover, in order to recover the periodicity for endless design, we identified the “atom” part of design (prototile), which is replicated to generate the target image of PTP sheets. Under the assumption that marks and string letters in the design can be approximated into the rectangles, we define the function that approximately expresses PTP design. The function consists of a prototile, expressing a layout of rectangles, and its copies. Applying Fourier analysis to the function, we identify characteristic frequency components with the feature in the designs.
THEORY Prerequisite
Letter strings (e.g. a drug name, a pharmaceutical company name, standard unit) and marks (e.g. ecological mark) on PTP sheets are usually colored in one or a small number of colors. In this paper, we focus on the discussion about layout designs on PTP in gray scale, since it is straightforward to extend our discussion to the original colored PTP designs.
Letters and marks periodically appear in the directions of the vectors a and b. We focus on the fact that the minimal part of the design of a PTP sheet has finite area where a set of the letters and the marks is printed. The design of the PTP sheet is realized as the “tilling” of the minimal part.
Therefore, we define the prototile functionφ (x ), which has the support in the minimal part of the design. Utilizing this function, we can formulate the model of the design of PTP label as:
Equations and mathematical formulas are available in the original paper PDF.
where N and M are the number of repetitions (let us assume N ≫1 and M ≫1).
Later, we will assume that the printed drug names and the marks can be regarded as rectangles.
Let us define the rectangle function Rw , h
D (x) , which has its support in the rectangle whose width is w, height h, depth of color D, namely,
2 ∧|y|< h 2 0 otherwise
Latter of this paper, we will assume the original prototile function φ (x ) can be approximately expressed as the superposition of the rectangle functions:
Di (x ) (x−di)
Rwi, hi
where di is a displacement vector indicating the center position of the rectangle.
Fourier Transformation To understand the behavior of the function ρ (x ) in frequency domain, we apply Fourier transform to it. Let
F [ f ] (k ) denote Fourier transform of a function (x ) . Then we have the followings:
d x e
−ikxφ (x−n a−m b)
d x e
−ikxe
iknae
ikmbφ (x )
e
ik nae
ik mbF [φ] (k )
F [φ] (k ).
sin kb
sin(N+ 1
sin(M + 1
2)ka
2)kb
We should note that
has its peak value (2 N+1)(2M +1) on the lattice in
sin ka
sin kb
frequency domain spanned by the vector K satisfying Ka=2 πn and Kb=2 πm, for arbitrary integer n and m. Therefore, this result shows that F [ ρ] (k ) has its peak value (2 N+1)(2M +1)F [φ ] (K ) on the lattice.
We need to remember that there were the incidents where medical experts mixed up PTP sheets which were similar but have the different number of rows and/or columns of tablets, e.g. a five-day blister pack and a weekly blister pack. This suggests that the similarity of PTP sheet design does not originate in the number of rows/columns. This
sin(N+ 1
sin(M + 1
2)ka
2)kb
suggests that the factor
is not essential to measure the similarity of PTP sheet
sin ka
sin kb
design, since the vectors a and b span the lattice whose sites copies of the prototile sit, the factor can be identified with the part related to the periodicity of rows/columns in the design.
Therefore, we focus on F [φ ] (k ). The details of the letters and the marks in the design should be neglected in the accidental situation PTP sheets are mixed-up. This means that the region of higher k x and k y in frequency domain should be neglected to discuss the similarity of PTP sheet design. The letter strings and the marks corresponding to the lower k x and k y region can be regarded as rectangles. We, therefore, approximate the design to the rectangles located at positions of the letter strings and the marks. Additional to this, we take account of the color density of the letter strings and the marks, and let Di denote the color density of the ith rectangle.
D ( x ), and obtain F [φ ] (k ) as follows:
d xe
−ikx φ (x)
d x e
Di ( x−di)
Rwi ,hi i
Di ( x )
d x e
−ik(x+d i)Rwi, hi
Di (x )
−ikx
2 dy e
e
wi wi
hi
−ikx −ik y
e
e
2 −e ikx
hi 2−e ik y
e
−ik di D i
−ik y
e
−ik diD i
2sin k xw i 2 k x
2sin k yhi 2 k y
Power Spectrum Density A prototile of an endless design PTP sheets does not sit the same position, but the design should be regarded to be identical. In order to discuss the characteristics in the design, we utilize power spectrum density, because it is invariant under translational transformation. The spectrum density function S (k ) for the rectangle-approximated prototile function can be obtained as follows:
e
e
ik di Di
−ik d jD j
2sin k xwi 2 kx
2sin k yhi 2 k y
2sin k x w j 2 k x
2sin k yh j 2 k y
{cosk (di−d j)}Di
D j
2sin k x wi 2 k x
2sin k y hi 2 k y )
2sin kx wi 2 kx
2sin k yhi 2 k y
2sin k xw j 2 kx
2sin k y h j 2 k y
i (Di As for the factor in the form 2sin kw
2) as follows:
2 k
kw
3 }
2 −1 6( kw
k {
This gives us the approximation form of S (k ) in low k:
kx
2 (hi 2
(k y hi)
(Diwihi)
(Di wihi)(D jw jh j){1−(k (di−d j))
2{1−( (k x wi)
2 }{1−(
2(wi 2+wj 2) 24 + k y
i
(k(di−d j)) It is interesting that it can be regard as an elliptic paraboloid but the factor 1− 2 . This factor causes the
ununiformity originated from the relative positions of the rectangle centers. Because of it, if the vector k is perpendicular to di−d j, the extent of S (k )decrease caused by increase of |k| is smaller than the case of k with the other direction.
Another interesting thing is that the factors Diwi hi appear as coefficients in S (k ). Regarding the color depth Di as the length of a cuboid, the factor can be regarded as the volume of the cuboid. Though the printed label is usually single colored, a sparse mark, such as an ecological mark, can be regarded to have small value of Di by neglecting high |k| region. Bold and large letters and marks have the large value of the volume. Therefore, the term with the largest volume Diwihi is dominant in S (k ).
These tell us that the characteristics of PTP sheet designs, such as the size of letters/marks and their relative positions are reflected to S (k ) in low |k| region. The characteristics appear as the direction of k, which is perpendicular to the vector di−d j that connects the centers of the boldest and largest letters/marks.
EXPERIMENT Objective and Method
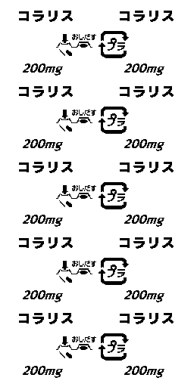
In order to evaluate our method, we applied it to imaginary designs of PTP sheets with reference to the ones in the market. In this paper, we show the results for PTP sheets shown in Figure 1. One of the PTP sheets is in the pitch controlled design (left) and another is in the endless design (right).
As the evaluation, we need to confirm: [Equation or mathematical symbol available in the original paper PDF] Characteristics of S (k ) appearing in the direction perpendicular to the vector di−d j that connects the centers of rectangles,
• Validity of rectangle approximation of letter strings and marks in the PTP sheet designs,
sin(N+ 1
sin(M + 1
2)ka
2)kb
• Reasonableness of neglecting the factor
inF [ ρ] (k ).
sin ka
sin kb
In the experiments, we utilize images whose size is 256 pixels × 512 pixels. Our experiments are conducted in the following order:
1. We applied two-dimensional Fast Fourier transform (FFT) to the label with two black rectangles in order to illustrate how characteristics of S (k ) appear. Both blocks are 16 pixels × 16 pixels, and the left block has its
−1 center sitting in the direction of ( 1 ) from the right block.
Figure 2. The imaginary label with two black rectangles.
2. We applied FFT to the label with a prototile of the design for the left PTP sheet in Figure 1. We compared it to its rectangle approximated design. In the approximated design, the parts of the (imaginary) drug name (コラリ ス, Coralith) and the dosage unit (200mg) are assigned to black rectangles, and the parts of marks, “Push out” mark and “Pla(stic)” mark, are assigned to gray rectangles. This is because the former ones are denser than the latter ones in color (black). The size of rectangles are determined to cover the letter strings/marks.
Figure 3. The prototile and its rectangle approximation.
3. We compared the result of Fourier transformation of the prototile in Figure 3 with the result for the whole label in Figure 1. We compared the results of the labels in Figure 1.
Results and discussion
+ 2 πyv ) N x N y , where u and v are spatial φ(x , y)e
1. Let the FFT of φ (x )=φ(x , y) beΦ (u,v )=∑ x , y frequencies in x and y directions. N xandN y are the horizontal and the vertical pixel number. The spectral
density|Φ (u, v )|
2around the center has large value along the linev=2u. Remind the relations thatk x=2πu Nx k y=2πv 2 has the large value along the line k x=k y.Since it is andN y=2N x. These lead that S (k )=|Φ| N y
the direction perpendicular to the vector that connects the centers of the two rectangles, this result coincides with the one led by the theory that we discussed for S (k ).
Figure 4. A FFT image of Figure 2.
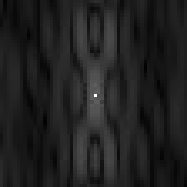
2. Figure 5 shows the Fourier transformed prototile of Figure 3 (left) and the transformed rectangles (right). This shows that, though high (spatial) frequency portions are different, the central portions −10<kx<10 and −10<k y<10 are similar (Figure 6). Under the assumption that medical experts feel similarity not in the detail of designs, coincide of S (k ) for the original prototile and its rectangle approximation in the low frequency region is important. This justifies the rectangle approximation that we discussed.
Figure 5. Comparison of a FFT image of the prototile of the pitch controlled label (left) to its rectangle approximation (right).Figure 6. Central parts of Figure 5.
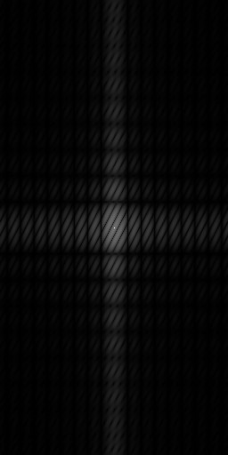
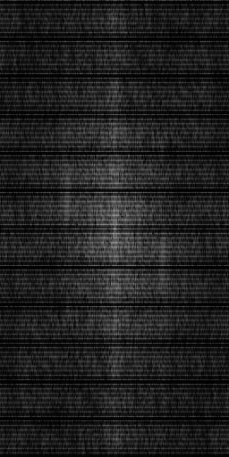
3. Figure 7 shows a FFT image of the pitch controlled design in Figure 1. Comparing it with Figure 5, we can see Figure 7 is similar to it but many horizontal lines. In the language ofF [ ρ] (k ), the difference should come from
sin( M+ 1
sin(N + 1
2)ka
2)kb . In the setting of the design of the pitch controlled label, the
sin ka
sin kb
the factor(
sin N y
2 k y
, which
sin N y
0 N y/5). Inserting these to the factor, we obtain(
10 k y)
is independent of k x. Therefore, the factor has peak lines represented as k y= 10 N y This is equivalent to v(¿2πk¿¿ y N y)=5l ¿. In the FFT image, the parallel lines are placed at 5 pixel intervals.
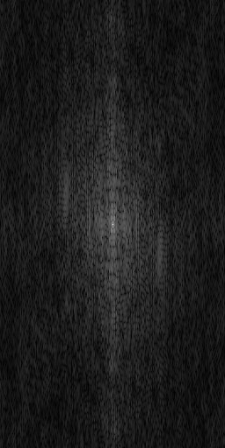
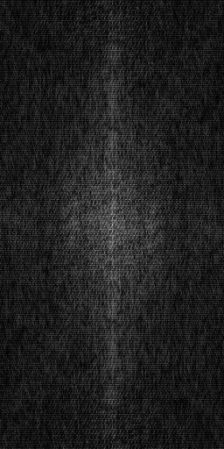
Figure 8 shows the FFT image of the endless design in Figure 1. The marks/letter strings are aligned in the same direction of blocks in Figure 2, and we can see the lines parallel to v=2u in Figure 8. The FFT image of its prototile is the left one in Figure 8. We can see the difference that originates in the design difference of the prototiles.
As we discussed, the origin of PTP sheet confusion is not the number of rows and/or columns of tablets. This suggests that we should use not the FFT images of PTP sheet designs but the FFT image of its prototile. Additional to this, we need to take account of the alignment direction of the prototiles in similarity measurement of PTP design. Therefore, the similarity index of PTP design should consist of the similarity of prototiles in PTP sheets in low |k| region and the similarity of the directions of the vectors {K } satisfying Ka=2 π and Kb=2 π.
5pix els
Figure 7. A FFT image of the pitch controlled design in Figure 1(left) and its central part (right).Figure 8. A FFT image of the endless design in Figure 1(left), its central part (center), and the corresponding part of a prototile of A FFT image of the endless design(right).
CONCLUSIONS
In this paper, we discussed the Fourier transformation applied to Press through package (PTP) design.
Under the assumption that marks and string letters in the design can be approximated into the rectangles, we defined the (approximated) function that expresses PTP design. The function consists of a prototile, expressing a layout of rectangles, and its copies. The Fourier transformation of the function can be expressed as the product of a contribution from the layout of the copies and a contribution from the prototile. The contribution from the layout of the copies has peaks on the lattice spanned by the vectors {K } satisfying Ka=2 π andKb=2 π. The contribution from the prototile is found to have large value along lines perpendicular to line segments connecting centers of the rectangles around the center of the FFT image of the PTP design.
We focused on the fact that the origin of PTP sheet confusion is not the number of rows and/or columns of tablets and the necessity to take account of the alignment direction of the prototiles in similarity measurement of PTP design. These and our experimental results suggest that the similarity index of PTP design should consist of the similarity of prototiles in PTP sheets in low |k| region and the similarity of the directions of the vectors {K }.
In future study, we will apply our result to define a similarity index of PTP sheets, which prevents from confusing PTP sheet design.
REFERENCES
Izumiya, A., Ohkura, M., & Tsuchiya, F. (2007). “A study on display to improve the visibility of PTP sheets.” In Human- Computer Interaction. HCI Applications and Services, pp. 443-449, Springer Berlin Heidelberg. Japan Council for Quality Health Care (2012), Annual Reports. Japan Council for Quality Health Care Website:
http://www.yakkyoku-hiyari.jcqhc.or.jp/contents/report/index.html (Japanese) Ootsuki, Y., Izumiya, A., Ohkura, M., & Tsuchiya, F. (2009). “Examination of Evaluation Method for Appearance Similarity of Human Aspects of Healthcare (2021)
PTP Sheets”. In Human Interface and the Management of Information. Information and Interaction, pp. 586-593, Springer Berlin Heidelberg. Tamaki, H. Sato, H. Hori, H. Sawada, Y. (2011). “Study on Effects of Color Difference on Look-alike Similarity of Drug PTP Sheets”, Japanese Society of Pharmaceutical Health Care and Sciences, Vol.21, p.141. (Japanese) Tamaki, H. Sato, H. Hori, H. Sawada, Y. (2012). “Effects of Color and Size Difference of Plural Parts of PTP Sheets on
Subjective Look-alike Similarity”, Japanese Society of Pharmaceutical Health Care and Sciences, Vol.22, p.335. (Japanese)
LISTED IN THE AHFE DIGITAL BOOKSTORE CATALOGUE
Explore the complete digital volume
Advances in Human Aspects of Healthcare
Read this individual research paper free through the original publisher, or explore the full digital proceedings book.
ISBN 978-1-4951-2093-0
Explore this ISBN in the AHFE Bookstore ↗Listed in the July 2026 bookstore catalogue; search by ISBN to confirm current availability · Digital book purchase optional