Momoko Sakai, Yohsuke Yoshioka (2026). How Street–Building Geometry Modulates the Effectiveness of Smartphone Map Orientation Methods in Direction Judgment. In: Human Factors in Architecture, Sustainable Urban Planning and Infrastructure. AHFE Open Access, vol. 229, pp. 82–90. https://doi.org/10.54941/ahfe1007956
This study investigates how variations in street patterns and building arrangements, combined with the orientation display methods of smartphone map applications—specifically North-Up and Heading-Up—influence users' map-reading performance. By establishing street configurations that combine simple or complex building shapes with various intersection geometries, the study isolated these factors to examine their respective impacts on self-localization. Using a Virtual Reality (VR) environment with a head-mounted display, 22 participants performed self-orientation tasks across eight experimental conditions. These conditions combined the two map display methods with four distinct street configurations, created by hybridizing two intersection types (orthogonal vs. skewed) and two building types (uniform vs. diverse). Analysis revealed that the Heading-Up orientation consistently resulted in shorter self-localization times than the North-Up orientation, with this difference being particularly pronounced in skewed intersections. In contrast, environments composed of orthogonal intersections and uniform building shapes led to longer task completion times, suggesting a lack of salient visual cues. Conversely, orthogonal intersections combined with diverse building shapes significantly facilitated self-localization.
In recent years, smartphone map applications have become indispensable tools in daily life due to their convenience and multifunctionality. These applications provide innovative features that traditional paper maps could not provide, including real-time self-location display, precise GPS-based navigation, free map scaling, and optimal route guidance. With this increasing sophistication, the importance of interface design that accommodates users’ cognitive characteristics has increased.
Among the functions incorporated into map applications, display method plays a crucial role in how users interpret maps and spatially locate themselves. The two primary display methods are the North-Up Map, which fixes the top of the map to the north, and the Heading-Up Map, which aligns the map with the user’s direction of movement. The North-Up Map effectively supports understanding large-scale spatial relationships (Smets et al. 2008); however, it Received February 19, 2026; Revised April 13, 2026; Accepted May 3, 2026; Available online July 20, 2026
How Street–Building Geometry Modulates the Effectiveness of Smartphone Map 83 often requires mental rotation when the user’s viewpoint does not match the map orientation, thereby increasing cognitive load (Porathe, 2012). In contrast, the Heading-Up Map aligns more intuitively with the user’s perspective and supports efficient self-orientation during local navigation (Cuevas et al., 2001; Park et al., 2024), although it may reduce awareness of global directional relationships (Brunyé et al., 2015). Since real-world navigation is influenced by environmental factors such as building height and intersection geometry, empirical investigation is needed to determine which display method better supports self-orientation under varying street conditions.
Urban street configurations reflect local history, geographic conditions, and urban planning, and thus vary across region. Recent studies suggest that urban street configurations influence navigation accuracy. For example, Zijlstra et al. (2016) reported that route complexity affects walking speed and navigation accuracy, with more complex routes reducing travel efficiency. In addition, Coutrot et al. (2022) revealed that urban street structures relate to navigation ability and that more complex street networks enhance spatial cognitive abilities more than simple grid-like layouts. These findings consistently indicate that street configurations are key factors influencing navigation efficiency and spatial cognition.
However, insufficient research has examined how map display methods interact with diverse street configurations to influence users’ map reading and navigation. If researchers identify more appropriate display methods for specific street configurations, they could recommend optimal display methods to users and service providers. In our previous study, we investigated how combinations of these display methods and various street configurations affected self-localization performance. The results indicated that Heading-Up and North-Up maps provided stable efficiency. Furthermore, in simple linear intersections, the lack of visual cues led to longer localization times. In contrast, in complex intersections, distinctive road shapes served as effective directional cues and reduced localization time. Despite these findings, it remains unclear whether the observed differences were primarily driven by road network geometry or architectural complexity. Therefore, in this study, we aimed to isolate these variables to clarify their individual effects on the self-localization process. Using virtual environment technology to create hybrid configurations, we examine how specific environmental characteristics determine the optimal map display method. This approach seeks to inform the design of more effective, cognitively supportive navigation systems for complex urban settings.
METHOD
Participants and Apparatus The participants were 22 healthy university students in their twenties (14 males and eight females). All participants had normal visual and cognitive function and prior experience with mobile mapping services. Given their presumed familiarity with basic map navigation, no preliminary screening for map-reading proficiency was performed. Each participant provided written informed consent before the trial began.
The experimental setup utilized an HTC-VIVE head-mounted display (HMD) with integrated eye-tracking technology. To maintain high optical tracking
84 Sakai and Yoshioka precision, we conducted the study in a quiet, light-controlled laboratory with black-painted walls to minimize interference. The virtual surroundings were rendered on a workstation running Windows 10 Pro, equipped with an Intel Core i5 processor, 16 gigabytes of Double Data Rate 4 RAM, and an Nvidia GeForce RTX 2070 graphics processing unit. The simulation was built using Vizard 7.0 (WorldViz), with urban models developed in Archicad 26 (Graphisoft).
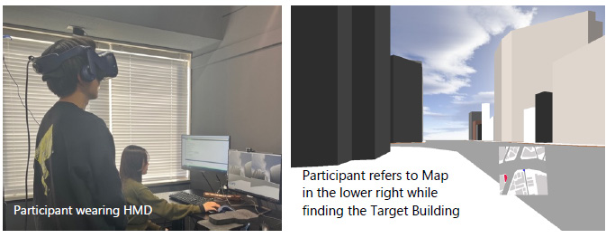
Experimental Design Participants navigated four distinct urban street layouts, each modeled after actual intersections. A simulated smartphone map appeared in the lower-right corner of the HMD’s field of view, with specific target buildings highlighted in red. The primary objective for participants was to locate the corresponding structure within the virtual space and orient themselves toward it (Figure 1).
Figure 1: Experiment in progress: Participant Interacting within the Virtual Environment.
Experimental Conditions The experiment included eight conditions combining two map display methods and four street configurations. The two map display methods were:
Heading-Up Map: The map interface automatically rotates so that the user’s current heading aligns with the top of the display.
North-Up Map: The map orientation remains static, with north fixed at the top.
In both modes, a blue triangle at the map’s center indicates the participant’s location and orientation. In the North-Up Map, this triangle rotates to reflect body movement, whereas in the Heading-Up Map, it remains fixed upward as the map rotates.
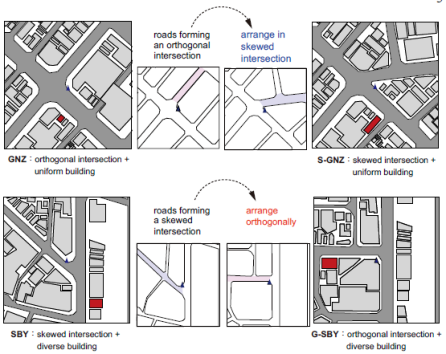
The four street configurations were modeled after real-world intersections in Tokyo and were selected for their distinct characteristics (Figure 2):
Location SBY (Shibuya Ward Jinnan 1-Chome Intersection) As elements constituting street environments, we focused on two factors: intersection geometry and building shape. We examined how the simplicity or complexity of these features affects self-orientation.
How Street–Building Geometry Modulates the Effectiveness of Smartphone Map 85 Intersection geometries were classified into two types: “orthogonal intersections” and “skewed intersections.” Orthogonal intersections refer to intersections where two roads intersect at approximately right angles (75– 105 degrees), with no major curves or branches within a 50-meter radius. In contrast, skewed intersections refer to intersections where two or more roads intersect at various angles (outside 75–105 degrees), and where curves or branches are present within a 50-meter radius.
Building shapes were similarly classified into two types: “uniform building shapes” and “diverse building shapes.” Uniform building shapes refer to configurations in which building outlines approximate rectangular prisms and align regularly along plot boundaries. Building heights show minimal variation, resulting in high visual uniformity. In contrast, diverse building shapes refer to configurations that include buildings with irregular floor plans and greater variation in building height.
Location GNZ and Location SBY differ in both intersection geometry and building shape. Specifically, Location GNZ features simple geometries for intersections and buildings, whereas Location SBY shows complexity in both elements. To isolate the individual effects of these two factors on the self- localization process, we introduced new street configurations by hybridizing the characteristics of Location GNZ and Location SBY.
The new configurations were defined as follows:
Location S-GNZ: This site features simple, orderly building shapes similar to those in Location GNZ but incorporates an irregular, diagonal road intersection modeled after Location SBY.
Location G-SBY: This site includes buildings with varied sizes and complex forms similar to those in Location SBY while using a grid-like, orthogonal road intersection inspired by Location GNZ.
Figure 2: Street configurations.
Following the initial briefing and consent process, participants were fitted with the HMD. A 5-min practice session in a separate virtual environment allowed participants to familiarize themselves with each map type.
To control for potential order effects, map types were presented using a Latin square randomization, while the four locations within each map type were randomized. Each trial followed these steps:
1. Virtual relocation to a consistent starting position at the designated site. 2. Identification of the red target building on the map displayed in the lower-right corner of the field of view, followed by body rotation to face its 3D counterpart as quickly and accurately as possible. 3. Verbal confirmation by saying “Yes” once the participant was certain of the choice. 4. Recording of task completion time by the researcher before the system automatically transitioned to the next trial.
Target buildings were counterbalanced across participants to prevent bias, and mandatory short breaks were provided between map-type blocks to mitigate fatigue.
RESULTS
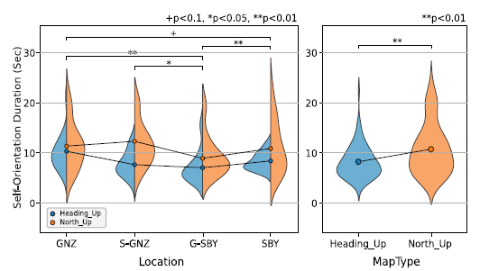
Display Method × Street Configuration The changes in task completion time under each condition are shown in Figure 3. First, regarding differences between map display methods, the mean completion time was longer for the North-Up Map than for the Heading-Up Map across all street configurations, and interparticipant variability was also greater. In particular, the difference in mean completion time between the two display methods was smallest for Location GNZ and largest for Location S-GNZ. These two locations share the same building shape type but differ in intersection geometry—orthogonal for Location GNZ and skewed for Location S-GNZ—suggesting that intersection geometry may influence the magnitude of the display method effect.
Next, regarding differences between street configurations, the mean completion time was shortest for Location G-SBY under both map display methods. Compared with Location GNZ, completion time for Location G-SBY was significantly shorter. These two locations differ in configuration: Location GNZ consists of uniform building shapes and orthogonal intersections, whereas Location G-SBY combines diverse building shapes with orthogonal intersections. This pattern suggests that visual cues from buildings may have facilitated self-orientation.
Figure 3: Self-localization time by street configuration and map display method.
To statistically examine these tendencies, a two-way analysis of variance (ANOVA) was conducted with map display method (two levels) and street configuration (four levels) as factors. The analysis revealed significant main effects for map display method (p = .001) and street configuration (p < .001).
Regarding the main effects, task completion time was significantly longer for the North-Up Map than for the Heading-Up Map. For street configuration, post hoc multiple comparisons with Bonferroni correction showed that Location GNZ had significantly longer completion times than Location G-SBY (p = .001) and Location SBY (p = .054). Furthermore, Location G-SBY had significantly shorter completion times than Location S-GNZ (p = .033) and Location SBY (p = .006).
Supplementary simple main effect analyses showed significant differences between display methods at Location G-SBY (p = .006), Location S-GNZ (p < .001), and Location SBY (p = .059).
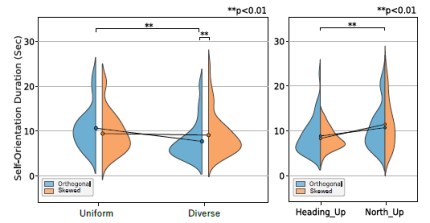
Display Method × (Intersection Geometry × Building Shape) In the previous section, we treated street configuration as a categorical variable with four levels. However, street configuration can also be conceptualized as a composite factor consisting of two components: intersection geometry (orthogonal/skewed) and building shape (uniform/diverse). We therefore treated these components as independent factors and conducted a three-way ANOVA with display method, intersection geometry, and building shape as factors (Figure 4). The analysis showed significant main effects of display method (p = .001) and building shape (p = .001). Regarding interaction effects, a significant interaction was found for intersection geometry × building shape (p = .003).
Figure 4: Self-localization time by intersection geometry and building shape.
88 Sakai and Yoshioka Because we examined the main effect of display method in the previous section, this section focuses on the interaction between intersection geometry and building shape, which we further analyzed using simple main effects. The results showed that, for orthogonal intersections, task completion time differed significantly by building shape (p < .001). Furthermore, when examining the effect of intersection geometry within each building shape, task completion time differed significantly for diverse building shapes (p = .002).
DISCUSSION
In this study, we examined how differences in display method (North-Up/ Heading-Up) and street configuration affect the time required for self- orientation in a virtual environment. We found significant main effects for both display method and street configuration.
Regarding the main effect of display method, the Heading-Up Map consistently produced shorter completion times than the North-Up Map, indicating higher efficiency in self-orientation. This likely occurs because the map orientation matches the user’s viewpoint, allowing intuitive mapping between map information and the surrounding environment, thereby reducing cognitive load. In contrast, with the North-Up Map, the direction the user faces does not align with the upward direction of the map, requiring mental rotation for correction. This additional cognitive process likely leads to longer completion times. Moreover, the greater interparticipant variability observed with the North-Up Map suggests that the ease of mental rotation may depend on individual differences in spatial ability. Previous studies have also reported increased cognitive load associated with mental rotation in the North-Up Map, and the present results are consistent with those findings (Smets et al., 2008; Porathe, 2012).
Regarding the main effect of street configuration, differences in completion time were observed among streets. Location GNZ (orthogonal intersections with uniform building shapes) showed longer completion times and smaller differences between display methods. Because road and building shapes in Location GNZ are relatively uniform, fewer visual cues may have been available, making it difficult to identify one’s current location on the map. In addition, the presence of many visually similar buildings may have led to repeated misidentifications and rechecking. In contrast, Location G-SBY (orthogonal intersections with diverse building shapes) showed shorter completion times than other streets. This street includes greater diversity in building shapes, providing more salient visual differences and richer cues for identifying one’s position. This abundance of visual features likely facilitated matching between map information and the surrounding environment, enabling relatively easy self-orientation under both display methods.
The interaction was not statistically significant; however, simple main effect analyses revealed significant differences between display methods for all streets except Location GNZ. Location S-GNZ indicated that when intersection angles are nonorthogonal, the influence of display method becomes stronger. This finding suggests that intersection configuration affects the cognitive load required to align map information with visual perception. At nonorthogonal intersections, the rotational correction required in the North-Up Map becomes more complex, increasing the discrepancy between the map and the user’s
How Street–Building Geometry Modulates the Effectiveness of Smartphone Map 89 viewpoint. In contrast, with the Heading-Up Map, the viewing direction aligns with the upward direction of the map, maintaining visual consistency even in complex intersection geometries and thereby facilitating self-orientation. In other words, display method design can mitigate the impact of intersection geometry on the integration of spatial information.
Furthermore, when street configuration was decomposed into two factors— intersection geometry and building shape—we found a significant interaction between these factors. This result indicates that the effect of building shape depends on intersection geometry. Simple main effect analyses showed that, at orthogonal intersections, building shape had a significant impact on self- orientation, and self-orientation was easier under conditions with diverse building shapes. In contrast, at skewed intersections, no significant difference was observed between building shapes. Moreover, when building shape was held constant, a significant difference between orthogonal and skewed intersections appeared only under the diverse building shape condition. These results suggest that self-orientation difficulty is determined by the interaction between the visual characteristics and the geometric structure of intersections.
Certain limitations should be acknowledged. First, individual differences in participant characteristics, such as age, prior navigation experience, and spatial cognitive ability, were not fully controlled and may have influenced task performance, limiting the generalizability of the findings. Second, the experimental design included only North-Up and Heading-Up displays and did not examine other emerging visualization methods, such as 3D maps or augmented reality navigation. Finally, although we used task completion time as an evaluation metric, this measure does not fully capture cognitive load or navigational success. Future studies should incorporate additional indicators, including positional accuracy and physiological measures, to provide a more comprehensive assessment.
CONCLUSION
In this study, we examined the effects of combinations of map display methods and street configurations in map applications on the time required for self-orientation in a virtual environment. The findings are as follows:
The Heading-Up Map required less time for self-orientation than the North-Up Map, and this difference was particularly significant on streets with skewed intersections (Location S-GNZ).
At Location GNZ (orthogonal intersections with uniform building shapes), self-orientation took longer, possibly due to limited visual cues. In contrast, at Location G-SBY (orthogonal intersections with diverse building shapes), visually distinctive buildings appeared to support direction recognition, resulting in shorter completion times.
An interaction between intersection geometry and building shape was observed. At orthogonal intersections, differences in building shape had a strong effect on self-orientation efficiency, whereas at skewed intersections, this effect was limited.
90 Sakai and Yoshioka These results demonstrate that the choice of map display method influences users’ spatial cognition and highlight the importance of considering the relationship between display method and street configuration elements, including intersection and building shape combinations. Future research is expected to contribute to the development of more practical and versatile navigation support systems by incorporating a wider variety of street patterns and more complex exploration tasks into experimental frameworks.
REFERENCES
Brunyé, T. T., Burte, H., Houck, L. A., & Taylor, H. A.: The map in our head is not oriented North: Evidence from a real-world environment, PLOS ONE, Vol. 10, No. 9, p. e0135803, 2015. (DOI: http://10.1371/journal.pone.0135803) Coutrot, A., Manley, E., Goodroe, S., Gahnstrom, C., Filomena, G., Yesiltepe, D.,
Dalton, R., Wiener, J., Hölscher, C., Hornberger, M., & Spiers, H.: Entropy of city street networks linked to future spatial navigation ability, Nature, Vol. 604, pp. 104–110, 2022. (DOI: http://10.1038/s41586-022-04486-7) Cuevas, H. M., Huthmann, A., Knudsen, A., & Wei, C.: Performance differences in a navigation task among users presented with a North-Up versus Track-Up orientation map display, Proceedings of the Human Factors and Ergonomics Society Annual Meeting, Vol. 45, pp. 1666–1670, 2001. (DOI: http://10.1177/15 4193120104502322) Smets, N., Brake, G. T., Neerincx, M. A., & Lindenberg, J.: Effects of mobile map orientation
and tactile feedback on navigation speed and situation awareness, Proceedings of the 10th International Conference on Human Computer Interaction with Mobile Devices and Services, pp.73–80, 2008. (DOI: http://10.1145/1409240.1409249) Park, H., Dixit, M. K., & Pariafsai, F.: Towards personally relevant navigation: The differential effects of cognitive style and map orientation on spatial knowledge development, Applied Sciences, Vol. 14(10), pp. 4012, 2024.1. (DOI: http://10.3390/ app14104012) Porathe, T.: Mental rotations and map use: cultural differences, Proceedings of the
Human Factors and Ergonomics Society Europe Chapter Conference, Vol. 28–29, 2012. Zijlstra, E., Hagedoorn, M., Krijnen, W., van der Schans, C. P., & Mobach, M.: Route complexity and simulated physical ageing negatively influence wayfinding, Applied Ergonomics, Vol. 56, pp. 62–67, 2016 (DOI: http://10.1016/j.apergo.2016.03.009)
LISTED IN THE AHFE DIGITAL BOOKSTORE CATALOGUE
Explore the complete digital volume
Human Factors in Architecture, Sustainable Urban Planning and Infrastructure
Read this individual research paper free through the original publisher, or explore the full digital proceedings book.
ISBN 979-8-950676-05-5
Explore this ISBN in the AHFE Bookstore ↗Listed in the July 2026 bookstore catalogue; search by ISBN to confirm current availability · Digital book purchase optional