Momoko Sakai, Yohsuke Yoshioka (2025). Evaluating Map Orientation Methods in Smartphone Applications by Analyzing Search Time Through a Virtual Environment Experiment. In: Human-Computer Interaction & Emerging Technologies. AHFE Open Access, vol. 195, pp. 82–91. https://doi.org/10.54941/ahfe1006226
In recent years, smartphone map applications have implemented numerous features enhancing usability. These include adjusting map scale and orientation, displaying user’s current location, and route guidance. Such advancements have made map reading significantly easier compared to traditional paper maps particularly by automating tasks like orientation and navigation. However, the diverse street patterns in certain urban areas can confuse users who are not proficient in map reading, such as those unfamiliar with technology or individuals in emergency situations. This confusion can reduce the benefit from the convenience of map applications in providing seamless navigation, despite their advanced functionality.This study examines the effect of smartphone map orientation methods, such as North-Up and Heading-Up as well as various street patterns and building layouts on users' map reading abilities. The research aims to identify maps display elements that facilitate self-location awareness and gain insights that contribute to developing new map applications enabling effective navigation even for users with difficulties in map reading.The experiment utilized a Head-Mounted Display (HMD) with eye-tracking function to measure gaze data as an indicator of participants' map reading processes across different map display methods and various street patterns. Participants were presented with modeled streets based on actual intersections through the HMD. A map of each location, simulating a smartphone map application, was displayed in the lower right field of view. Specific buildings were highlighted in red on the map, and participants were instructed to locate the actual position of the highlighted building and orient themselves toward it. Three types of maps were tested: North-up maps with fixed orientation, Heading-up maps that rotate with body movement, and Control-up maps that allowed free rotation. These map types were combined with five different locations, resulting in 15 total trials.Analysis revealed statistically significant differences between map types, with Control-up maps resulting in significantly longer completion times and map viewing durations compared to other map types. This result suggests that the Control-Up method presents greater difficulty for users. Moreover, an analysis excluding outliers indicated that Heading-up maps tend to be slightly more efficient than North-up maps. This finding indicates that the Heading-up method may help reduce users' cognitive load during navigation. Additionally, locations with simple layouts and linear street intersections showed significantly longer completion times compared to other locations with more complex layouts. This suggests that the simplicity of the street layout may increase task difficulty, possibly due to the lack of distinctive visual landmarks for orientation. However, the impact of location differences was reduced when Control-up maps were excluded from the analysis, indicating that appropriate map type selection could potentially mitigate the difficulties associated with simple street layouts. To enhance the effectiveness of the Heading-up method suggested in this study, further improvements need to be considered, such as dynamically switching map display methods based on user movement and environmental conditions. Expanding the scope of research in this direction could contribute to the development of more user-friendly map navigation systems for a broader range of users and use cases.
In recent years, smartphone map applications have become ubiquitous, profoundly changing how individuals navigate and interact with their environments. Featuring functions such as adjustable scaling, real-time location tracking, and turn-by-turn navigation, these applications offer substantial advantages over traditional paper maps and have become indispensable tools for everyday wayfinding.
Among the available display modes, two are commonly used: the Heading- Up Map, which rotates dynamically based on the user’s movement, and the North-Up Map, which maintains a fixed north orientation. Although display mode selection is typically based on personal preference, emerging evidence suggests that navigation efficiency is influenced not only by user abilities or preferences but also by cognitive factors and environmental factors such as street layout. For instance, Campos et al. (2021) demonstrated that user interaction with rotated or dynamically oriented maps is influenced by individual differences in spatial orientation and mental rotation abilities. Medy´nska-Gulij et al. (2022) further showed that device orientation—such as portrait versus landscape mode—modulates visual strategies and path selection.
Evaluating Map Orientation Methods in Smartphone Applications 83
Recent studies have highlighted the impact of urban street configurations on spatial cognition and navigation strategies. For example, Zijlstra et al. (2016) reported that route complexity significantly affects walking speed and accuracy, with complex layouts causing reduced movement efficiency and greater disorientation. Similarly, Coutrot et al. (2022) found that exposure to intricate street networks enhances spatial abilities more than exposure to simple grid patterns. Other studies (e.g., Zomer et al., 2019; Coutrot et al., 2019) have further underscored the intricate relationship between urban structure, individual navigation strategies, and performance in both virtual and real-world environments.
These insights suggest that the interplay between street configuration and map guidance plays a critical role in navigation effectiveness. Despite these findings, few studies have explicitly examined how map display methods interact with different street configurations to influence spatial orientation and wayfinding performance.
Given the inherent diversity of urban layouts—from orderly grids to irregular, branching networks—it remains unclear whether specific display modes are more effective for specific configurations, and under what conditions. Therefore, it is important to investigate whether certain map display methods are better suited to particular street patterns. Identifying such relationships can help users and service providers make informed decisions about optimal map displays.
This study addresses this research gap by examining how different map display methods affect self-localization performance in virtual environments modeled on diverse real-world street configurations. The findings aim to inform the design of more effective and cognitively supportive navigation systems, ultimately enhancing wayfinding experiences in complex urban settings.
METHOD
Participants and Apparatus The participants were 10 healthy university students in their twenties (six men and four women) with no visual or cognitive impairments. All participants had prior experience using smartphone map applications and were assumed to have basic map-reading skills; therefore, no preliminary map-reading tests were conducted. All participants provided informed consent prior to participation.
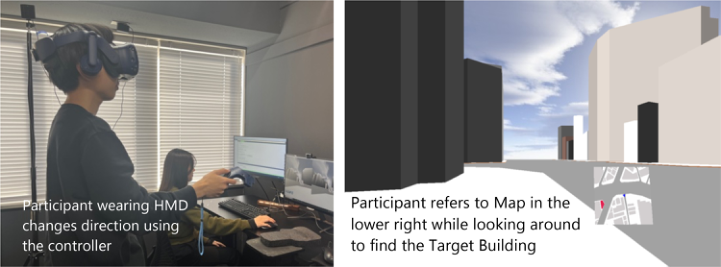
The experiment was conducted using a head-mounted display (HMD) equipped with an eye-tracking function and a handheld controller (Figure 1). The HMD’s eye-tracking function enabled the measurement of the participants’ gaze behavior (e.g., gaze shifts, fixation durations), while the controller was used by participants to interact with the virtual environment, specifically for controlling the “Control-Up Map” condition. By using the HMD, it was possible to quantitatively capture unconscious gaze movements and spatial recognition processes during the task.
To ensure the optical-tracking accuracy of the HMD, the walls of the experimental room were painted black to minimize external light interference. Additionally, the experiment was conducted in a quiet room
84 Sakai and Yoshioka
to eliminate noise. The virtual environment was rendered using an Nvidia GeForce RTX 2070 on a Windows 10 Pro computer powered by an Intel Core i5 processor and 16 GB of DDR4 RAM.
The virtual environment, constructed using Vizard 7.0, (WorldViz), was presented to the participants via an HMD (HTC-VIVE, HTC). The street model was generated using the 3D modeling tool Archicad 26 (Graphisoft). Gaze coordinates were obtained using an eye tracking system built into the HMD. Additionally, the participants held an HTC-VIVE controller in their dominant hand to interact with the virtual environment.
Experimental Design During the experiment, the participants were presented with five types of street layouts via the HMD, which were modeled after real-world intersections. A map designed to simulate a smartphone map application was displayed in the lower-right corner of the field of view, with specific buildings highlighted in red. Using this map, the participants were instructed to identify the corresponding building within the virtual environment and orient themselves toward it.
To analyze gaze behavior during the task, the eye-tracking function of the HMD recorded gaze shifts and fixation duration throughout the task. In particular, the frequency and amplitude of gaze shifts between the map and real-world view were quantitatively analyzed to examine how different map display methods influenced the map-reading process.
Figure 1: Experiment in progress: participant engaging with the virtual environment.
Experimental Conditions The experiment consisted of 15 conditions, in total combining three levels of map display methods and five levels of street layouts.
The three map display methods tested were:
Heading-Up Map: The map rotates such that the participant’s current facing direction is always at the top.
North-Up Map: The map remains fixed, with north always at the top.
Control-Up Map: The orientation of the map can be freely adjusted by the participant using a touchpad on the handheld controller, similar to a smartphone map application.
Evaluating Map Orientation Methods in Smartphone Applications 85
For all map types, the participant’s standing position and body orientation were represented by a blue triangle at the center of the map. On the North-Up and Control-Up maps, the marker moved according to the participant’s body movement. On the Heading-Up Map, the marker always pointed upward, with the map rotating to align with the participant’s movement.
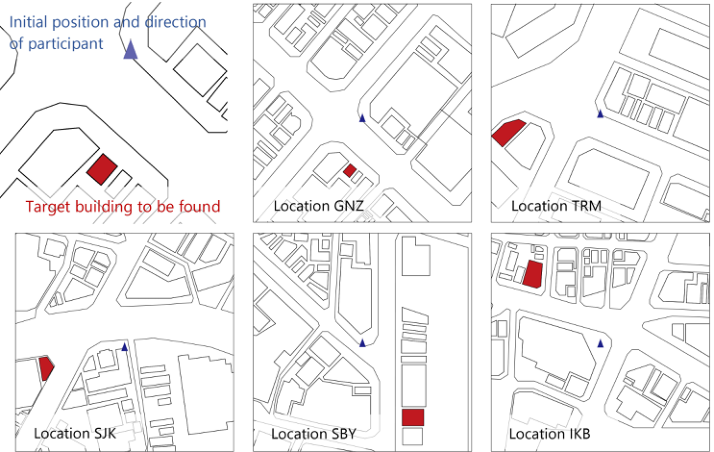
The five street layouts used in the experiment were modeled after real- world intersections in Tokyo and selected for their distinct configurations (Figure 2):
These intersections were recreated as 3D models using Archicad 26 for use in the virtual environment.
This study assessed street configuration complexity by categorizing intersections as “simple linear intersections” and “complex street configurations.” “Simple linear intersections” refer to those formed by two roads intersecting at near-right angles (75–105 degrees), exhibiting no substantial bends or branches within a 50-meter radius; these are typically found in grid-patterned networks, such as those in Location GNZ. In contrast, “Complex street configurations” involve three or more roads intersecting at varied angles (outside the 75–105 degree range) and include prominent curves or branching within 50 meters, as observed in areas like Location SBY.
Figure 2: Street configuration of the selected locations.
86 Sakai and Yoshioka
Experimental Procedure Upon arrival, the participants were provided with a detailed explanation of the experiment and informed consent was obtained. They were then fitted with the HMD, and the eye-tracking system was calibrated using its built- in calibration routine. Participants were given a handheld controller and instructed on its use. Before the formal experiment, they completed a practice session in a separate virtual environment to familiarize themselves with each map type, including the operation of the Control-Up Map. The practice session lasted for approximately 10 minutes.
For each participant, the order of the three map types was randomized using a Latin square design to minimize the order effects. Within each map type, the following procedure was repeated for each of the five locations in randomized order.
1. The participant was virtually transported to a designated starting point in Location A. The starting point was consistent across all conditions for each location. 2. Using the map displayed in the lower-right corner of their field of view, the participant was instructed to identify the building marked in red on the map and then turn to face its actual position in the virtual environment. Participants were instructed to respond as quickly and accurately as possible. 3. Once the participant was confident in their selection, they verbally indicated their confirmation by saying “Yes”. 4. Upon confirmation, the experimenter recorded the task completion time and the system automatically advanced to the next condition.
The target building varied depending on the experimental conditions (i.e., map type and location). The selection of target buildings was counterbalanced across participants to minimize any potential bias. A brief break was provided between each map-type condition to reduce fatigue.
RESULTS
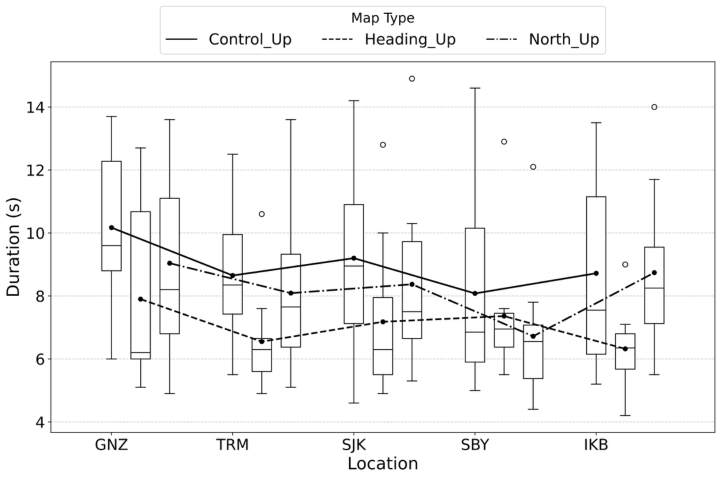
Figure 3 illustrates a comparison of the task completion times for each condition. Among the different map display methods, the Heading-Up Map had the shortest completion time, followed by the North-Up Map. The Control-Up Map resulted in the longest completion time, regardless of street configuration. Additionally, the variation among participants was the largest for this map type.
Furthermore, differences in completion times were observed across different street configurations. Location GNZ showed longer completion times for all map display methods, with a high degree of variation among the participants. In contrast, Locations TRM and SBY exhibited relatively short completion times across all map display methods.
Evaluating Map Orientation Methods in Smartphone Applications 87
Figure 3: Self-localization time for each condition.
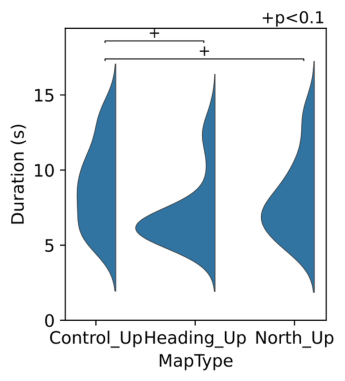
We conducted a two-way repeated measures analysis of variance (ANOVA, α = 0.05) with map display method and street configuration as factors. Both the main effects of the map display method (p = 0.041, η2 = 0.068) and street configuration (p = 0.004, η2 = 0.061) were significant, whereas the interaction effect was not (p = 0.339). A Bonferroni-corrected multiple comparison test for the main effect of the map display method revealed a trend toward significance between the Control-Up and Heading- Up maps (p = 0.063) and between the Control-Up and North-Up maps (p = 0.063). However, no significant difference was found between the Heading-Up and North-Up maps (p = 0.153).
In addition, the Control-Up Map exhibited a greater degree of variation in completion times across different street configurations than the other map display methods. This suggests that performing the task with the Control-Up Map was more challenging. Based on these findings, further analyses were conducted focusing on the Heading-Up and North-Up maps, which yielded more stable results.
Figure 4 compares the completion times for each street configuration, excluding the Control-Up map. The results of the two-way repeated measures ANOVA indicated that only the main effect of street configuration was significant (p = 0.002, η2 = 0.065). Neither the main effect of the map display method nor the interaction effect were significant (p = 0.153, η2 = 0.034 and p = 0.200, η2 = 0.043, respectively). A Bonferroni-corrected multiple comparison test for the main effect of street configuration showed that the completion time at Location GNZ was significantly longer than at Locations SBY and TRM (p = 0.011 and p = 0.031, respectively).
88 Sakai and Yoshioka
Figure 4: Self-localization time by map display method and street configuration.
DISCUSSION
This experiment examined the effects of a combination of map display methods and street configurations on the time required for self-localization in a virtual environment. The results revealed significant effects of both the map display method and street configuration on the task completion time, although no significant interaction effect was observed. These findings provide valuable insights into the cognitive processes underlying map reading and spatial orientation in complex urban environments, and highlight the key factors that contribute to efficient navigation.
Analysis of the map display method indicated a trend for the Control-Up map to be associated with longer completion times and greater variability than the Heading-Up and North-Up maps. While the Control-Up Map offers users the flexibility to adjust the map orientation, this freedom may paradoxically introduce cognitive overload, thereby hindering self- localization efficiency. The additional cognitive effort required to actively manipulate the map, combined with the need to continuously integrate changing visual representations into the virtual environment, likely imposes an excessive cognitive burden. This interpretation aligns well with cognitive load theory, which posits that performance deteriorates when the demands on working memory exceed its capacity (Chen & Kalyuga, 2019; Chen et al., 2018). Participants may have devoted considerable time to adjusting the map and exploring various perspectives, resulting in slower and inconsistent overall performance. Future research could explore strategies to mitigate this cognitive burden, such as introducing adaptive map guidance that anticipates user needs, or simplifying interface interactions to reduce the demands on working memory. In contrast, the Heading-Up and North-Up maps provided a more stable and consistent frame of reference, which appeared to facilitate self-localization by reducing the cognitive demands. The similar levels of efficiency observed between these two map types suggest
Evaluating Map Orientation Methods in Smartphone Applications 89
that preserving a stable map orientation, whether aligned with the user’s heading or fixed in a cardinal direction, enhances spatial understanding and decreases the cognitive effort required for orientation. These results are consistent with those of previous research, highlighting the benefits of stable map orientations for various navigation tasks (Ginns & Leppink, 2019; Young et al., 2014).
Further analysis focusing solely on the Heading-Up and North-Up map conditions revealed a significant main effect of street configuration on completion time. Regarding the effect of street configuration, Location GNZ consistently exhibited longer completion times and greater variability than the other locations. This finding suggests that certain street layouts present greater inherent challenges for self-localization irrespective of the map display method employed. The increased complexity of the Ginza Intersection, possibly stemming from its irregular geometry, high building density, or visual clutter, may have contributed to the difficulties observed. The participants likely required additional time to process the presented visual information and accurately match it with the map representation within this more complex environment. Moreover, the high degree of inter-participant variability observed at Location GNZ suggests that individuals may adopt different cognitive strategies when navigating complex spaces. Some participants may have relied more heavily on landmark recognition, whereas others may have prioritized path integration or cognitive mapping. Future research should investigate individual differences in cognitive strategies and their impact on self-localization performance across diverse urban layouts. A deeper understanding of these factors is crucial for designing more effective navigation aids and ultimately enhancing wayfinding efficiency in complex urban environments.
LIMITATIONS The experimental method used in this study has the following limitations, which should be taken into consideration when interpreting the results:
Participant Characteristics Individual differences such as the number of participants, their background (e.g., age, experience), map-reading skills, and spatial cognitive abilities may have influenced the required time. Since these factors were not fully controlled in this study, further validation is necessary for application to different user groups.
Experimental Design This study examined three types of maps: Heading-Up, North-Up, and Control-Up maps. However, it did not compare them with other display methods (e.g., 3D maps or AR navigation). Future research should include a wider variety of display types.
Measurement Methods This study used eye-tracking data to evaluate the map-reading process, but eye movements do not always align perfectly with cognitive processing. Moreover, self-location was evaluated based on the time
90 Sakai and Yoshioka
taken, but in real-life map use, factors such as accuracy and stress levels are also important. Future studies could achieve more comprehensive analysis by incorporating additional physiological indicators.
CONCLUSION
In this study, we experimentally examined the impact of a combination of map display methods and street configurations on the time required for self- localization in map applications using virtual environment technology. The results yielded the following insights:
Despite its flexible operability, the Control-Up Map can confuse users. This suggests that simply increasing operational freedom does not necessarily improve usability.
In simple linear intersections (e.g., Location GNZ), the lack of visual cues leads to longer localization times.
In complex intersections (e.g., Locations SBY and TRM), distinctive road shapes serve as effective directional cues, reducing the localization time.
This study clarified the characteristics and effectiveness of each map display method. These findings provide valuable insights into the selection of an optimal map display method for map applications based on user characteristics and environmental conditions.
REFERENCES
Campos, A., Campos-Juanatey, D., & Tarrio, S. (2021). Mental rotation and spatial orientation in maps. North American Journal of Psychology, 23(4), 677–688. Chen, O., & Kalyuga, S. (2019). Cognitive Load Theory, Spacing Effect, and Working
Memory Resources Depletion. Frontiers in Psychology, 10, 2649. Chen, O., Kalyuga, S., & Sweller, J. (2018). Extending Cognitive Load Theory to Incorporate Working Memory Resource Depletion. Educational Psychology Review, 30(4), 1079–1095. Coutrot, A., Manley, E., Goodroe, S., Gahnstrom, C., Filomena, G., Yesiltepe, D.,
Dalton, R., Wiener, J., Hölscher, C., Hornberger, M., & Spiers, H. (2022). Entropy of city street networks linked to future spatial navigation ability. Nature, 604, 104–110. Coutrot, A., Schmidt, S., Coutrot, L., Pittman, J., Hong, L., Wiener, J., Hölscher, C., Dalton, R., Hornberger, M., & Spiers, H. (2019). Virtual navigation tested on a mobile app is predictive of real-world wayfinding navigation performance. PLoS ONE, 14, e0213272. Ginns, P., & Leppink, J. (2019). Special Issue on Cognitive Load Theory. Applied
Cognitive Psychology, 33(5), 727–728. Medy´nska-Gulij, B., Gulij, J., Cybulski, P., Zagata, K., Zawadzki, J., & Horbi´nski, T. (2022). Map design and usability of a simplified topographic 2D map on the smartphone in landscape and portrait orientations. ISPRS International Journal of Geo-Information, 11(11), 577. Young, J. Q., Van Merriënboer, J., Durning, S. J., & Ten Cate, O. (2014). Cognitive Load Theory: Implications for Medical Education. Medical Education, 48(4), 385–395.
Evaluating Map Orientation Methods in Smartphone Applications 91
Zijlstra, E., Hagedoorn, M., Krijnen, W., van der Schans, C. P., & Mobach, M.
(2016). Route complexity and simulated physical ageing negatively influence wayfinding. Applied Ergonomics, 56, 62–67. Zomer, L., Schneider, F., Ton, D., Hoogendoorn-Lanser, S., Duives, D., Cats, O., & Hoogendoorn, S. (2019). Determinants of urban wayfinding styles. Travel Behaviour and Society, 16, 31–41.
Read this individual research paper free through the original publisher, or explore the full digital proceedings book.
ISBN 978-1-964867-71-7
Explore this ISBN in the AHFE Bookstore ↗Listed in the July 2026 bookstore catalogue; search by ISBN to confirm current availability · Digital book purchase optional