Taisei Ogawa, Yohsuke Yoshioka (2025). Relationship between Gazing Characteristics and Conflict in Overtaking Selection Toward Pedestrian Ahead. In: Advances in Human Factors of Transportation. AHFE Open Access, vol. 186, pp. 209–218. https://doi.org/10.54941/ahfe1006510
This study investigates how the walking speed of a pedestrian ahead and aisle width influence conflict and gaze behavior during overtaking selection. The experiment employed a virtual environment with a head-mounted display (MetaQuest Pro/Meta) and an omnidirectional treadmill (Virtualizer Elite 2/Cyberith GmbH). The experiment involved 13 university students, who walked through three types of spaces in sequence: “Training Space,” “Reference Speed Measuring Space,” and “Analysis Space.” The analysis space consisted of 9 conditions, defined by three speed ratios (the ratio of the pedestrian ahead's walking speed to the participant's reference speed: 0.7, 0.8, and 0.9) and three aisle widths (2.5, 3.0, and 3.5 m). During walking, torso rotation angles and Yaw angles of gaze were measured to calculate three analytical indices: “Overtaking Rate,” “Overtaking Selection Time,” and “Gazing Dispersion.”The analysis of the overtaking rate suggested that action selections were likely made based on the relative magnitudes of the following burden (attributed to the speed ratio) and the overtaking burden (attributed to the aisle width), which were anticipated during walking. For overtaking selection time, the results indicated that the influence of the following burden varied depending on aisle width, with narrower aisle widths likely causing greater conflict in overtaking selections. Furthermore, for gazing dispersion, the findings suggested that the equilibrium between the following burden and the overtaking burden could influence the distribution of gaze.These findings represent a novel contribution by demonstrating the potential to quantify conflict due to action selection through gaze analysis. Based on these results, seamless measurement of anticipated burdens during action selection may become feasible.
Historically, walking has served as the basis for urban planning. However, with the widespread use of automobiles and the diversification of pedestrian spaces, cities have shifted from people-centered designs to more multifaceted forms that accommodate various functions and purposes. This evolution has made walking more complex and subject to several constraints. In response to these changes, Fruin (1974) proposed an evaluation method
based on the level of service, incorporating factors such as crowd-flow coefficients to ensure the comfort of walking spaces. In contrast, in recent years, compact city development has been actively pursued globally as a means of sustainable urban development, leading to a shift in transition from private car use to public transportation. As a result, opportunities for walking in public spaces, such as stations and streets, are expected to increase further, ushering in an era in which the nature of walking spaces must be reevaluated. This underscores the growing importance of pedestrian comfort evaluation. In particular, spaces with restricted movement, such as underground passageways, are prone to cause discomfort by limiting free walking, making it imperative to establish environments in which pedestrians can walk comfortably. Therefore, future approaches should prioritize not only the overarching evaluation of walking spaces indicated by the level of service but also the evaluation of the individual comfort experienced.
Individual behavior in walking spaces often includes avoidance behavior, which has been the subject of several studies. For instance, avoidance behavior when a lone pedestrian crosses a crowd involves adjusting their pace by slowing down and, if necessary, taking a detour (Imanishi et al., 2016). This tendency was similarly observed when two pedestrians crossed orthogonally and speed adjustment was prioritized over trajectory changes (Basili et al., 2013). Furthermore, in two-person avoidance scenarios, distinct roles emerge: one pedestrian yields and the other proceeds first, resulting in differences in avoidance strategies (Olivier et al., 2013). While these studies elucidated behavioral characteristics during avoidance, they did not include evaluations of walking space comfort. In contrast, Takahisa et al. (2009) conducted an aisle walking experiment involving passing by an oncoming pedestrian and found that wider aisles improved the post-walking comfort evaluation. The avoidance behaviors addressed in these studies are characterized as highly inevitable and temporary hazard avoidances.
In contrast, avoidance behavior during walking includes pedestrians moving in the same direction (pedestrians ahead). In the study by Osaragi et al. (2003), this behavior has been classified into “following” and “overtaking.” The following and overtaking represent avoidance through deceleration and detour, respectively. This indicates that avoidance behavior toward the pedestrian ahead involves the need for action selection based on individual judgment rather than a fixed response. In general, individuals select actions that they perceive as more comfortable. Therefore, avoidance behavior toward the pedestrian ahead is likely to be selected by predicting and comparing the burdens associated with following and overtaking. Furthermore, this prediction was hypothesized to be based on visually acquired information, suggesting that comfort can be evaluated through gazing characteristics during action selection.
However, studies focusing on avoidance behaviors toward pedestrians ahead are limited. One reason for this is the uncertainty of the avoidance point and the long distance required, which makes verification in real space difficult. Therefore, this study attempted to develop an experimental method using virtual environment technology. It has been reported that obstacles are avoided slightly more in a virtual environment than in reality, but
Relationship Between Gazing Characteristics and Conflict in Overtaking Selection 211
the basic movement patterns are similar (Fink et al., 2007). Suzuki et al. (2020) identified gaze characteristics during step avoidance by measuring eye movements using a head-mounted display (HMD) in a virtual environment. Another study used an omnidirectional treadmill to perform long-distance walking in a virtual environment. Chakraborty et al. (2024) reported that walking on an omnidirectional treadmill tends to result in longer walking distances than with normal walking. Additionally, Lohman et al. (2022) found that while higher movement speeds on an omnidirectional treadmill make walking easier, they also tend to induce cybersickness. Virtual environments are highly useful, and while an omnidirectional treadmill has certain shortcomings compared to real walking, it provides a significant advantage in facilitating long-distance walking.
Based on the above, this study conducted an aisle walking experiment using a combination of virtual environment technology and an omnidirectional treadmill to investigate action selection toward pedestrians ahead and gazing characteristics. The purpose of this study is to obtain new knowledge that could contribute to the evaluation of aisle space comfort.
METHODS
A virtual aisle walking experiment was conducted using an HMD (MetaQuest Pro/Meta) and an omnidirectional treadmill (Virtualizer Elite 2/Cyberith GmbH). Thirteen university students (11 males and 2 females) participated in the experiment. After boarding the omnidirectional treadmill, the participants wore an HMD and were asked to navigate the virtual environment. Note that the incline angle of the treadmill was set to “3” for adults in accordance with existing studies and the user’s manual.
Virtual Environment Experimental participants were required to navigate the following three types of virtual environments created on the VR development platform (Vizard 7/World Viz) in the order of “Training Space,” “Reference Speed Measuring Space,” and “Analysis Space.” After completing each space, participants were interviewed about their degree of cybersickness, and breaks were provided as necessary.
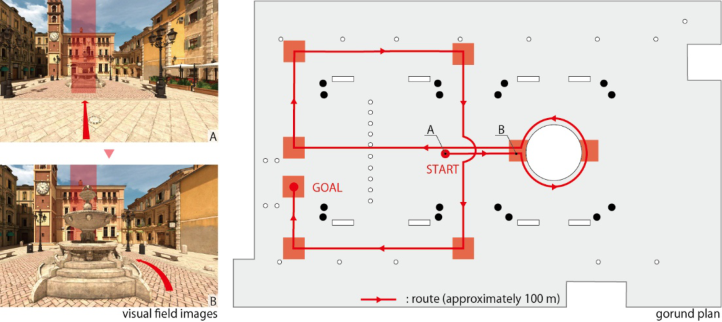
Training Space (Figure 1): Participants were asked to walk along a designated route in a sample space within the VR development platform with a task in order to familiarize themselves with the virtual setting.
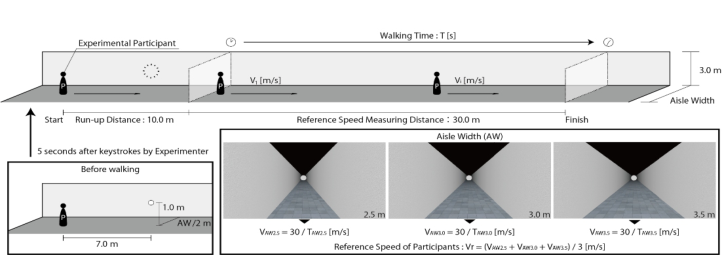
Reference Speed Measuring Space (Figure 2): The participants were required to walk through three aisles of different widths (2.5, 3.0, and 3.5 m) from a distance of 40 m. The average walking speed was determined for the 30-meter measurement section, excluding the run-up distance in each aisle, and these were averaged to determine the reference speed for each participant.
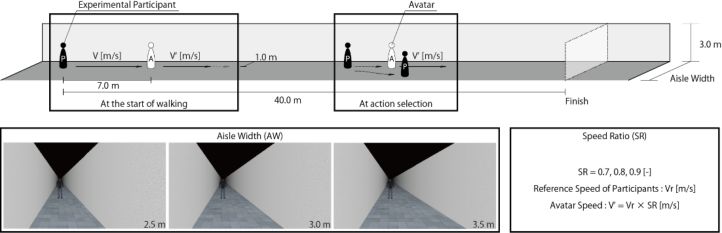
Analysis Space (Figure 3): Participants were asked to walk 40 m through the aisles under nine conditions: three speed ratios (0.7, 0.8, and 0.9) and three aisle widths (2.5, 3.0, and 3.5 m). The speed ratio was defined as the ratio of the pedestrian ahead’s walking speed to the participant’s reference speed. In this space, an avatar was placed 7.0 m in front of the participant as a
212 Ogawa and Yoshioka
pedestrian ahead, and the participants were instructed to start walking when the avatar started walking. During walking, the torso rotation angle was measured using a ring harness attached to an omnidirectional treadmill and the Yaw angle of gaze was measured using a gaze-tracking device attached to the HMD. These measurements were output at 0.1 second intervals and were used to calculate the analysis indicators.
Figure 1: Outline of training space.Figure 2: Outline of reference speed measuring space.Figure 3: Outline of analysis space.
Relationship Between Gazing Characteristics and Conflict in Overtaking Selection 213
Analysis Indicators Based on the torso rotation angle and the gazing angle measured in the analysis space, “Overtaking Rate,” “Overtaking Selection Time” and “Gazing Dispersion” were calculated and used in the analysis.
Overtaking Rate: The ratio of the number of overtaking selections discriminated based on the torso rotation angle to the total number of trials in each condition was calculated and used as an indicator of the difficulty of the overtaking selection. Overtaking was selected between the two types of actions because of the ease of discriminating action selection. In the case of overtaking, the participants were required to translate their selection into physical actions to avoid the pedestrian ahead. Consequently, the physical changes associated with avoidance behavior can capture the presence of action selection and the moment at which the decision is finalized. In a study by Tatebe et al.,(1994), avoidance behavior toward obstacles was investigated based on actual walking experiments, and the beginning point of avoidance behavior was determined from the curvature of a low-pass- filtered walking trajectory. However, this experiment was conducted on an omnidirectional treadmill; therefore, the body sway was greater than during actual walking. This led to unstable curvature values, making it difficult to determine overtaking based on a fixed criterion. Therefore, in this experiment, the following formula was established using the torso rotation angle, and the cases satisfying this formula were classified as overtaking. The torso rotation angle was smoothed by using a low-pass filter with a cutoff frequency of 0.3 Hz.
δXmin
(1)
φmax > arctan δZ0
φmax: Maximum torso rotation angle. δXmin: Minimum side distance between avatar and participant when overtaking (0.5 m).
δZ0: Forward distance from participant to avatar at start of walk (7.0 m). Overtaking Selection Time: The time required to initiate overtaking was calculated based on the torso rotation angles and used as an indicator of conflict during action selection. The torso rotation angle was measured with the front direction as the reference, where rightward rotation was assigned positive values and leftward rotation was assigned negative values. Consequently, during straight walking, the angle alternates between positive and negative values, whereas continuous rightward movement for overtaking is indicated by persistent positive values. Therefore, the start of overtaking was identified as the moment when the torso rotation angle shifted from negative to positive, immediately before reaching its maximum value. Additionally, because there were individual differences in delay at the start of walking, the overtaking selection time was measured from the point when the distance between the participant and the avatar returned to 7.0 m.
Gaze Dispersion: The standard deviation of the gaze angle within the overtaking selection time was calculated and used as an indicator of the gaze characteristics during action selection. Patients with an overtaking selection
214 Ogawa and Yoshioka
time of 1.0 second or less were excluded from the analysis, because the reliability of the standard deviation could not be ensured.
RESULTS AND DISCUSSION
Among the 13 participants in the experiment, 2 were unable to adapt to walking on an omnidirectional treadmill and failed to control their movement in the majority of conditions. Therefore, they were excluded from the analysis. Additionally, for the other participants, conditions in which the overtaking initiation time was not measurable were excluded from the analysis.
Overtaking Rate
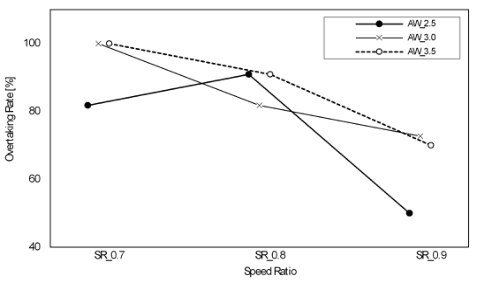
Figure 4 shows the overtaking rates for each condition, implying that the rate tends to decrease as the speed ratio increases. Additionally, in the narrow aisle width (2.5 m), the overtaking rate was lower than in wider aisles, although a reversal was observed at a speed ratio 0.8. These trends were generally consistent with the assumptions made during the experimental design, and it is considered that the decrease in the overtaking rate resulted from the reduced following burden when the pedestrian ahead’s speed accelerated and the increased overtaking burden when the aisle width was narrower.
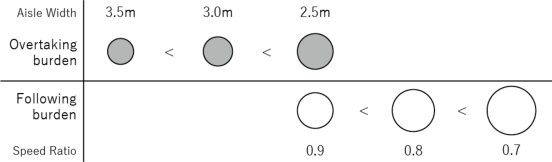
In a study by Takahisa et al. (2009), an actual walking experiment involving passing an oncoming pedestrian revealed a tendency for psychological evaluations of “comfort” and “ease of avoiding” to decrease with narrower aisle widths. This tendency is consistent with the transition of the overtaking rate in this experiment, and supports the initial hypothesis that action selection depends on the predicted burden. Among them, in the condition with a speed ratio 0.9 and an aisle width 2.5 m, where the following burden was expected to be the lowest and the overtaking burden the highest, the overtaking rate was 50.0%. This result indicates that the action selection between following and overtaking was evenly distributed, suggesting a state of equilibrium between the two burdens. From this, the following and overtaking burdens in this experiment can be expressed, as shown in Figure 5.
Overtaking Selection Time A two-way ANOVA without replication was conducted on the overtaking selection time, using speed ratio and aisle width as factors. For the speed ratio, which showed a significant main effect (F (2, 67)=3.545, p=.034, ηˆ2=.091), multiple comparisons were performed using the Shaffer’s method. Z-scores were used to correct for individual characteristics.
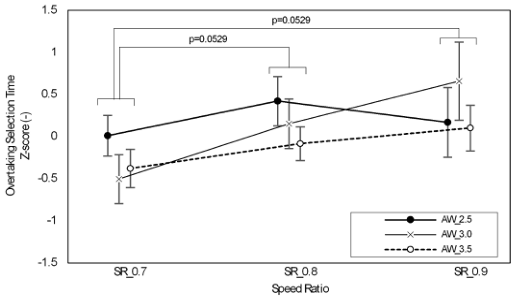
Figure 6 shows the mean and standard error ranges of the overtaking selection time for each condition. The overtaking selection time tended to increase significantly from a speed ratio 0.7 and 0.8 to 0.9 (0.7–0.9: p=.053, 0.8–0.9: p=.053). This result suggests that a reduction in the following burden and a narrowing gap between the following and overtaking burdens may have caused a conflict in action selection. However, it is also possible
Relationship Between Gazing Characteristics and Conflict in Overtaking Selection 215
Figure 4: Transition in overtaking rate.Figure 5: Image of overtaking burden and following burden.
that the slower contraction of the distance between the participant and the avatar as the speed of the pedestrian ahead increased influenced this result.
Tatebe et al. (1994) revealed that the orientation of a stationary person affected the initiation distance for avoidance. However, Takahisa et al. found that the initiation distance for avoidance is constant regardless of the aisle width or type of aisle (single corridor or mid-corridor). These findings differ in terms of the influencing factors; one is related to the target of avoidance, whereas the other is related to the environment. This suggests that changes in the environment alone do not lead to differences in initiation distances for avoidance. Because this experiment aligns with the latter study, the trends of overtaking selection time are thought to include the influence of the difficulty in reducing the distance between the participant and the avatar. However, as shown in Figure 6, there is a difference in the transition between aisle width 3.0 m and 3.5 m, with the 3.0 m exhibiting a greater influence of the speed ratio. This suggests that, as the aisle width narrows and the overtaking burden increases, the influence of the following burden becomes stronger, potentially causing conflicts.
In Figure 6, although there is no significant difference, the overtaking selection time for aisle width 2.5 m is longer than that for aisle width 3.0 m and 3.5 m at speed ratio of 0.7 and 0.8. Additionally, for speed ratio 0.8 and 0.9, the overtaking selection time for aisle width 3.5 m was shorter than that for aisle width 2.5 m and 3.0 m. These results indicated that narrower aisle widths may cause conflicts in action selection and increase the time required for selection. However, in the condition with the greatest equilibrium between the following and overtaking burdens (speed ratio 0.9,
216 Ogawa and Yoshioka
aisle width 2.5 m), the overtaking selection time showed a decreasing trend, contrary to the overall pattern. Therefore, we checked the participants who selected overtaking under this condition and found that they also overtook under all other conditions. This suggests that under the speed ratio 0.9 and aisle width 2.5 m, the participants’ intention to overtake was stronger, which may have resulted in a shorter overtaking selection time.
Figure 6: Average transition in overtaking selection time.
Gazing Dispersion A two-way ANOVA without replication was conducted on gaze dispersion using speed ratio and aisle width as factors, revealing an interaction effect (F (4, 65)=3.898, p=.007, ηˆ2=.166). Subsequently, simple main effects tests were performed, and multiple comparisons were conducted using the Shaffer’s method for groups with significant differences (speed ratio at aisle width 3.5 m: F (2, 65)=4.530, p=.014, ηˆ2=.097, aisle width at speed ratio 0.7: F (2, 65)=3.980, p=.015, ηˆ2=.095, at speed ratio 0.9: F (2, 65)=6.313, p=.003, ηˆ2=.135). Z-scores were used to correct for individual characteristics.
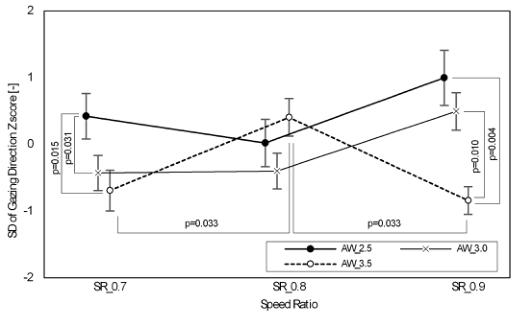
Figure 7 shows the mean values and standard error ranges of gazing dispersion for each condition. In Figure 7, at speed ratio 0.7, the gazing dispersion for aisle width 2.5 m was significantly larger than that for 3.0 m and 3.5 m (2.5–3.0: p=.015, 2.5–3.5: p=.031). On the other hand, at speed ratio 0.9, the gazing dispersion for aisle width 2.5 m and 3.0 m was significantly larger than that for 3.5 m (2.5–3.5: p=.004, 3.0–3.5: p=.010). In addition, although no significant differences were observed between aisle widths of 2.5 m and 3.0 m, there was a trend of gazing dispersion increasing from speed ratio 0.8 to 0.9. These results suggest that when the aisle width is narrow with a high overtaking burden, and when the speed of the pedestrian ahead is close to the reference speed with a low following burden, the gaze tends to be widely dispersed to the left and right. This indicates that the equilibrium between the two burdens influences gaze dispersion and further
Relationship Between Gazing Characteristics and Conflict in Overtaking Selection 217
suggests the potential existence of a threshold for the degree of equilibrium affecting gaze dispersion.
Conversely, at an aisle width of 3.5 m, the gazing dispersion for a speed ratio 0.8 was significantly greater than that for 0.7 and 0.9 (0.7–0.8: p=.033, 0.8–0.9: p=.033). However, as seen in Figure 7, the transition for the aisle width 3.5 m is substantially different than that for 2.5 m and 3.0 m. These results imply that in cases where the overtaking burden is minimal, as in aisle width of 3.5 m, and the difference between the two burdens is significantly large, the validity of the gazing dispersion decreases. Therefore, to quantify the burden using gazing dispersion, it is necessary to design an environment that can maintain equilibrium between the two burdens.
Figure 7: Average transition in gazing dispersion.
CONCLUSION
In this experiment, we analyzed three indicators—Overtaking Rate, Overtaking Selection Time, and Gazing Dispersion—to examine the effects of the walking speed of the pedestrian ahead and aisle width on conflict and gaze characteristics during overtaking selection. The results revealed the following trends for each indicator.
Overtaking Rate: The overtaking rate decreased as the speed ratio increased and the aisle width narrowed, reaching 50% under the conditions of a speed ratio of 0.9 and an aisle width 2.5 m. These results suggest that the following burden with speed ratio and the overtaking burden with aisle width were anticipated during walking and that action selections were likely made based on their relative magnitudes.
Overtaking Selection Time: Overtaking selection time was significantly longer at higher speed ratios for aisle width 3.0 m and 3.5 m, with the transition being particularly steep for an aisle width of 3.0 m. These results suggest that the influence of the following burden varies with aisle width, and narrower widths may be more likely to cause conflict owing to action selection.
Gazing Dispersion: At a speed ratio 0.7, gazing dispersion for an aisle width 2.5 m was significantly greater than for 3.0 m and 3.5 m. At a speed
218 Ogawa and Yoshioka
ratio 0.9, gazing dispersion for aisle width 2.5 m and 3.0 m was significantly greater than for 3.5 m. These results suggest that the equilibrium between following and overtaking burdens may influence gaze dispersion.
These findings represent a novel discovery that demonstrates the potential of quantifying conflicts during action selection through gaze analysis. Furthermore, based on these results, we anticipate that the extent of burden predicted during action selection can be seamlessly measured. In the future, it will be necessary to improve the indicators and consider the experimental environment to establish a new comfort evaluation method. However, this study focused solely on overtaking selection within a virtual environment. Furthermore, as the experiment was conducted on an omnidirectional treadmill, the results may differ from the real-life sensation of walking. In addition, the participant sample was also biased in terms of age and gender, which limits the generalizability of the findings. Future research should explore the applicability and utility of the findings by analyzing gaze characteristics during following behavior, comparing with real-world walking, and including a more diverse participant group. Moreover, since the gender of the pedestrian ahead may have influenced participants’ behaviors, it will be important to examine a wider set of environmental conditions.
REFERENCES
Basili, P., Saˆglam, M., Kruse, T., Huber, M., Kirsch, A., & Glasauer, S.
(2013) “Strategies of locomotor collision avoidance” Gait and Posture, 37(3), pp. 385–390. Chakraborty, S., Kane, A., Gagnon, H., McNamara, T., & Bodenheimer, B. (2024) “Comparative Effectiveness of an Omnidirectional Treadmill versus Natural Walking for Navigating in Virtual Environments” ACM Symposium on Applied Perception, No. 3, pp. 1–10. Fink, P. W., Foo, P. S., & Warren, W. H. (2007) “Obstacle Avoidance During Walking
in Real and Virtual Environments” ACM Transactions on Applied Perception, 4(1), Article 2, pp. 1–18. Fruin, J. J. (1974) “Pedestrian: Planning and design” Kajima Institute Publishing. Imanishi, M., & Sano, T. (2016) “Analysis of Avoidance Behavior from Pedestrian Perspective” J. Archit. Plan., AIJ, 81(719), pp. 57–63. Lohman, J., & Turchet, L. (2022) “Evaluating Cybersickness of Walking on an
Omnidirectional Treadmill in Virtual Reality” IEEE Transactions on Human- Machine Systems, 52(4), pp. 613–623. Olivier, A. H., Marin, A., Crétual, A., Berthoz, A., & Pettré, J. (2013) “Collision avoidance between two walkers: Role-dependent strategies” Gait and Posture, 38(4), pp. 751–756. Osaragi, T., & Sato, W. (2003) “Modeling of Pedestrian Behavior based on Mental
Stress” J. Archit. Plan., AIJ, 68(573), pp. 41–48. Suzuki, K., & Yoshioka, Y. (2020) “Effect of Distance between Corner and Step on Gaze Pattern and Walking Pattern” J. Technology and Design, AIJ, 26(62), pp. 267–271. Takahisa, Y., & Yanase, R. (2009) “A Fundamental Study about Form and Width of
Passage in the Architectural Space” J. Archit. Plan., AIJ, 74(638), pp. 809–814. Tatebe, K., Tsujimoto, M., & Shida, K. (1994) “Methods for Judging the Beginning Point of Avoiding Behavior and Avoidance Distance between a Pedestrian and a Standing Obstacle: A study on pedestrian behavior of avoiding obstacles (II)” J. Archit. Plan., AIJ, 59(465), pp. 95–104.
LISTED IN THE AHFE DIGITAL BOOKSTORE CATALOGUE
Explore the complete digital volume
Advances in Human Factors of Transportation
Read this individual research paper free through the original publisher, or explore the full digital proceedings book.
ISBN 978-1-964867-62-5
Explore this ISBN in the AHFE Bookstore ↗Listed in the July 2026 bookstore catalogue; search by ISBN to confirm current availability · Digital book purchase optional